Abstract
Around the world are continued attempts to use the vibroacoustic phenomena for purposes of diagnosis of machine condition. Particularly important becomes non-invasive methods including methods based on vibration and acoustic signals. Vibroacoustic phenomena, which relates to the working of technical objects, includes all necessary information connected with the technical condition. The biggest difficulty is the transformation of registered vibroacoustic signals and creation on their basic measures, which will be non-sensitive to any type of interference occurring during the operation of objects and recording signals. To the group of technical objects, for which are already conducted numerous studies all over the world, connected with use of vibroacoustic phenomena for diagnostic purposes which relates to the automotive drive systems, including combustion engines. Combustion engines during its working generate a whole range of vibroacoustic phenomena bringing information on the proper operation of the engine, as well as on condition of each of its elements. In a combustion engine, there are many sources of vibroacoustic phenomena, which contributes to the disruption of diagnostic information. The development of appropriate methods for vibroacoustic signal processing and complete diagnostic systems may allow future extension of the on-board diagnostics OBD system – currently in used cars. The most interesting would be the development of complex system for diagnosing the condition of the individual elements of the car engine operating by basing on information from vibroacoustic signals. In this article are shown results of research, which aim is to diagnose damages of mechanical elements of car combustion engine using vibration signals and artificial neural networks.
1. Introduction
Diagnostic systems used in modern combustion car engines are aimed at locating of the element or system, which can operate no longer because of natural usage or damage. Permanently increasing requirements for durability and reliability of car combustion engine elements and minimization of costs and bad influence to the environment, there is a need for searching information about its technical condition during operation.
Since 2000 in European Union Countries, all newly registered cars with engines equipped with spark ignition must have on-board diagnostic system [1]. In 2004 this duty started to include cars with self-ignition, and in 2006 it must be inserted also in new registered lorries. The obligation of making cars in accordance with requirements of OBD II norms caused that now are possibilities to access to the data stored in the controllers of individual systems [2]. With this solution, there are new possibilities for diagnosing the technical condition of vehicles.
Modern on-board diagnosis systems (OBD) allows for detection of faults affecting the vehicle emissions of toxic components. In practice this is diagnosing electronic systems, responsible for basic motor control functions.
In many cases confirmed in practice, some mechanical damages (for example: rising usage of valve seats and valve faces, movement of timing gear phases, usage of cylinder bearing surface, even over the acceptable dimensions for the engine) are not basis for diagnosis system reaction. The most frequent reason of this situation is applying algorithms of combustion engine adaptive control. Mechanical failures and exploitation usage, especially in early stage of development, are compensated by adaptive regulation systems, adopted as a result of the acceptable range of adjustment. Only after the occurrence of a larger failure the system switches to work in safe mode, which will allow the detection of the fault [3].
Detection of early development stage of mechanical damages by vibroacoustic methods can significantly enrich currently used systems and prevent serious damages to the combustion engines of motor vehicles. In consequence, this leads to a reduction of the negative effects of increased emissions of harmful substances into the atmosphere, and road accidents caused by technical condition of vehicles. Therefore, the use of additional diagnostic vibroacoustic system, supplementing the standard on-board system for detecting failures in the field of combustion engines can be very useful.
The main tasks of the diagnosis technical state of the car combustion engines elements may include the separation the useful vibroacoustic signal and the selection of characteristics of the processed signal susceptible to damage. One of the ways of obtaining diagnostic information is to measure the vibrations generated by the engine [4-10].
The combustion car engine is affected by both internal and external excitations. There are mainly combustion pressure, piston-crank system movement, extortion from the engine accessories operation and extortion from the timing system and drive transposition system. Vibration signal registered anywhere on the body of the engine is the weighted sum of the responses to all elementary events, whereas the weight waves are here with the pulse of the transition functions of generation to the place of the diagnostic signal reception. All engine systems are working in a specific order. Ordered elementary events are also taking place in the kinematic pairs. Therefore, according to the relative position of the shock pulse of reference signal can be determined by the kinematic pair of the engine which produced it.
Vibration signals generated by the kinematic pairs of the individual internal combustion engine and equipment due to occurrence of nonlinear phenomena caused inter alia the occurrence of backlash, non-linearity characteristics of the elastic elements are generally non-stationary. Frequency characteristics of signals significantly depend on the transmittance of the propagation path component signals from the sources to the point of measurement. The vibrations measured on the block are complex due to the overlapping of signals from different sources. Therefore, the fault diagnosis of car combustion engines by vibroacoustic method is a difficult process. Global research indicates the need to use advanced signal processing methods. Symptoms of damage resulted from advanced vibroacoustic signals processing methods, may be patterns used during the construction of the diagnostic system, based on the artificial intelligence methods, including artificial neural networks.
As the biggest difficulty in designing process of systems using artificial intelligence, the literature gives the need to consider to each task individually. So far there was no success to develop the clear guidelines on how to design and study of such systems [11-16].
2. Description of the research
The aim of this study was to diagnose several mechanical failures which can occur in a car combustion engine. For this purpose it was decided to use properly processed vibration signals emitted during engine operation, and artificial neural networks.
The object of the research was IC engine with 1.6 dm3 capacity of Ford Focus. In this studies it was decided to diagnose the following faults:
• damage to the exhaust valve,
• injector damage,
• damage to the head gasket.
Damage of exhaust valve was simulated by making a transverse incision of approximately 3 mm.
Damage to the injector was simulated by the disconnection.
Damage to the seal was to terminate the bridge between 1 and 2 cylinder.
Tests were performed on a chassis dynamometer. Recorded accelerations signals around the engine head near the intake and exhaust valve of 1st cylinder, the exhaust valve of the 4th cylinder and on the gearbox. Measurements were made for 3, 4 and 5 gear with engine speed of 2000 rpm, 3000 rpm and 4000 rpm.
During the tests a multi-channel recording device was used, produced by National Instruments Company, allowing synchronous sampling at high frequency. Vibratory signals were registered with 50 kHz frequency. Vibration acceleration transducers type of PCB Piezotronics ICP were used for the measuring. The data acquisition system was controlled by an application developed in LabView environment.
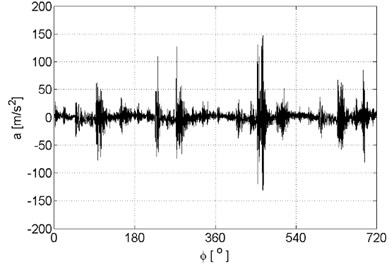
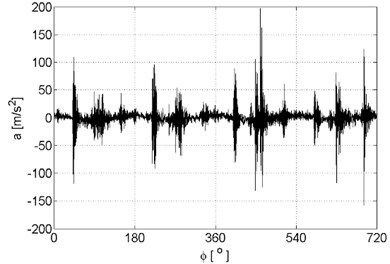
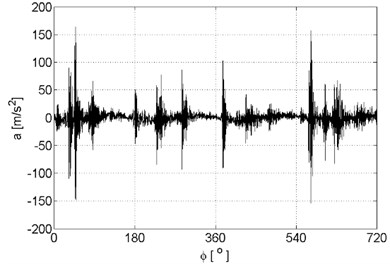
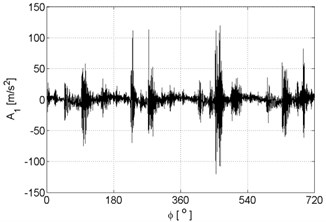
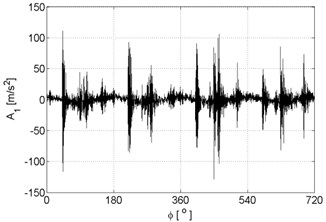
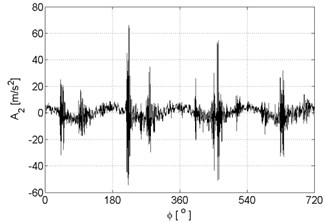
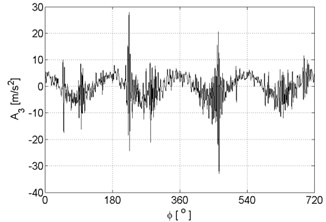
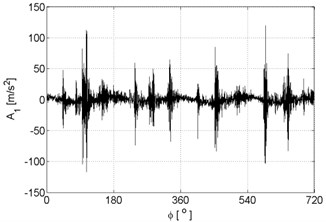
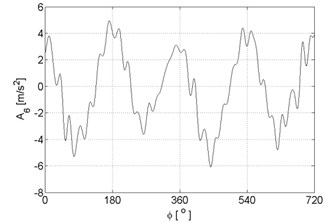
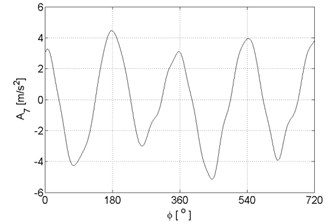
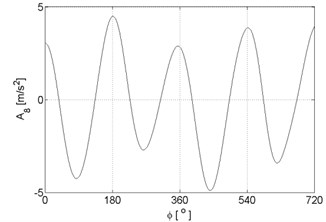
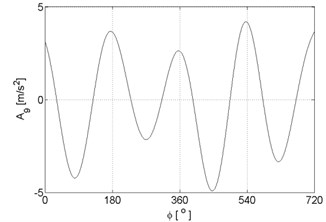
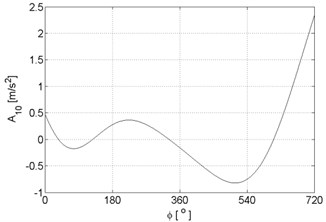
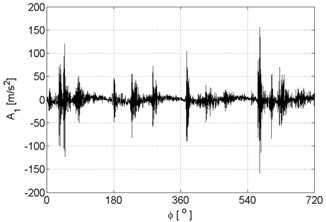
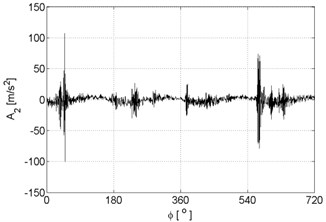
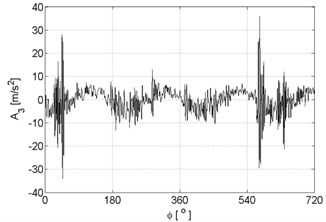
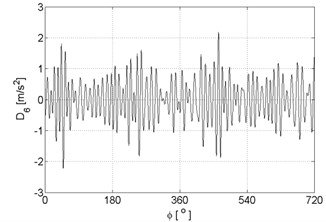
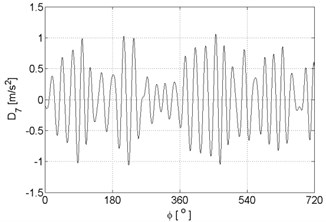
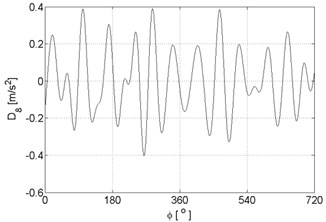
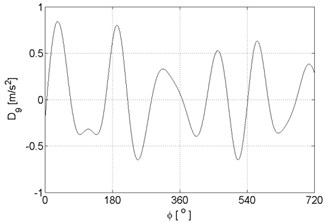
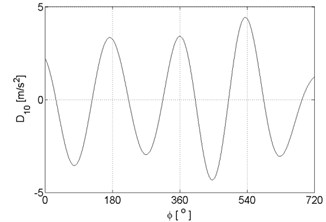
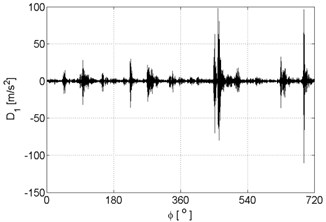
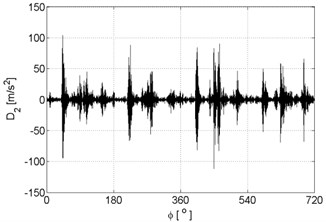
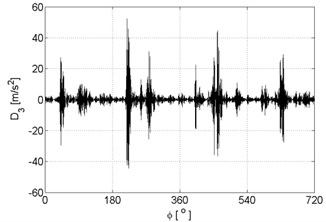
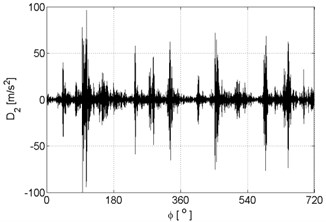
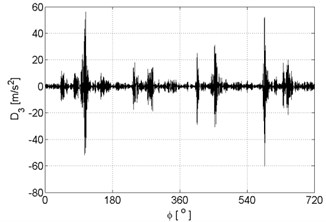
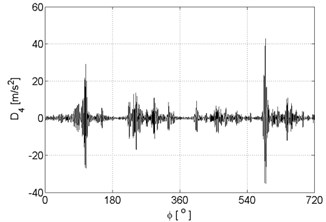
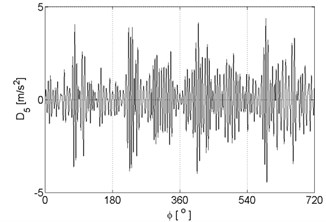
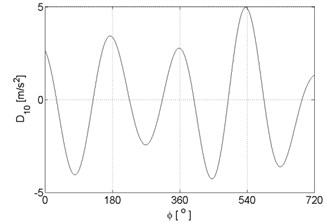
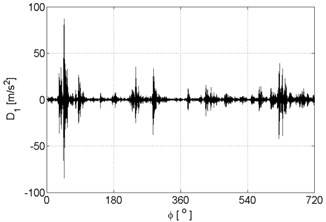
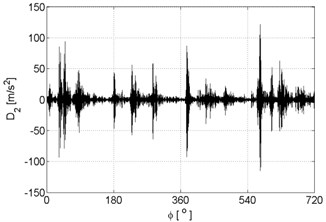
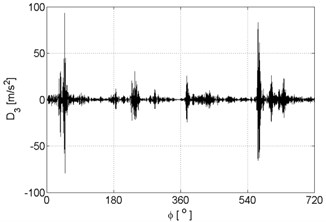
Examples of recorded vibration signals are shown in Figure 1.
Fig. 1Vibration signals registered for the engine without damages (a), damaged of exhaust valve (b), damaged of injector (c), damaged of head gasket (d)
a)
b)

c)
d)
Registered signal must be pre-processed, to be used for diagnostic purposes. One of the most common methods currently used in the diagnosis of vibroacoustic is wavelet analysis. It gives possibility of a linear decomposition of a tested vibroacoustic signal using any base function – wavelet.
Wavelets are variable marking functions whose value within a narrow range is different from zero. Majority of its energy base wavelet includes within a certain range of frequencies. Changing the frequency band of wavelets is performed by changing the value of the scale. For the base wavelet increased scale will reduce the center frequency of band-pass filter by wavelet. At the same time decreases frequency band of wavelet which is equivalent to increasing the resolution that was in the frequency domain [12, 17].
On the basis of base wavelet it is possible to generate the entire group of wavelets. This can be done using the formula:
where: – the scale value, – the value of displacement, – time.
Appropriately selected base wavelet allows to extract the correct signal from the random noise. Such disruption after the transformation are represented by coefficients with a small value. Such factors are removed from distribution by the threshold function.
The feature that distinguishes this method of signal analysis from others is:
• multi-signal decomposition,
• variable resolution in time and frequency domain,
• the possibility of basic functions other than harmonic functions.
The undeniable advantages of this method is non-loss transformation. This means that all the energy is maintained during the transition from the time domain signal to a wavelet coefficient form. It is defined as the principle of energy conservation mode during wavelet transformation (decomposition and reconstruction). This rule says that the whole energy of the signal as the sum of the squares of all samples is equal to the sum of the squares of all the wavelet coefficients.
This method shows the following advantages:
• short time computation for the harmonic base functions,
• a linear representation of the signal,
• no formation of additional interference,
• the variable resolution in the frequency domain.
As the limitations of the method we can indicate:
• the dependence as a result of the assumed function of the base,
• non-intuitive interpretation of the result obtained in graphical form.
In literature we can find wavelet transformation in discrete wavelet transformation (DWT). It can be defined as a scalar products of examined signal and base wavelet sequence :
As a result of multilevel decomposition of the signal are obtained signal approximations at a given level and the amount of detail on the following levels :
where: – representation of signal low frequency, – the component of high signal frequency.
With increasing signal level of participation details decomposition decreases. The result is that with the reduction of resolution was of detail content decreases the signal approximation.
On the basis of the research and review of the literature, it was decided to choose the discrete wavelet transformation (DWT) as a tool to support the process of building models for neural networks.
The choice of this type of signal pre-processing methods, gives the possibility of developing a system operating in real time (on-line).
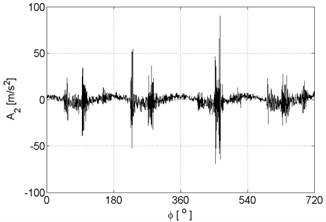
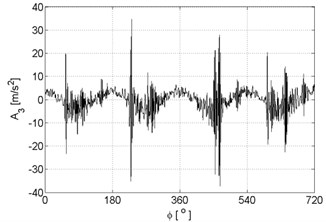
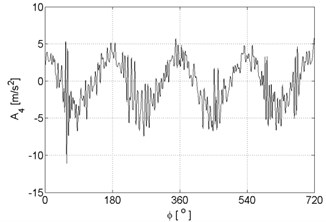
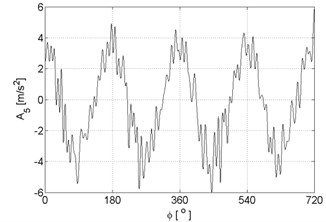
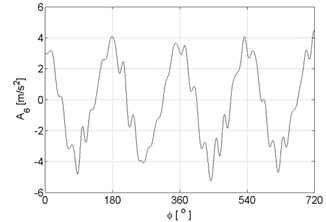
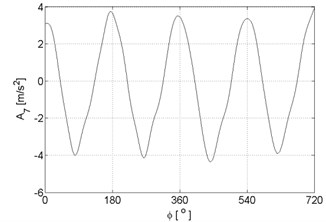
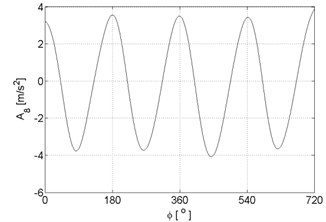
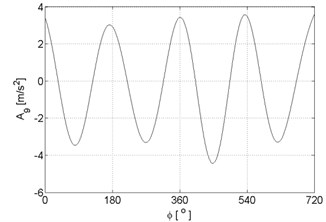
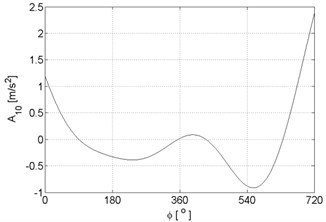
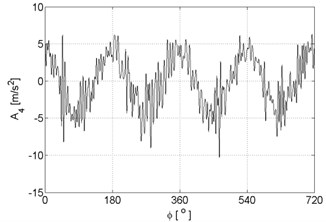
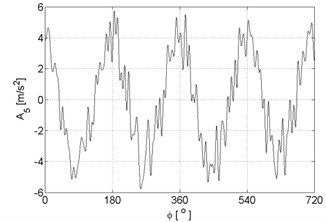
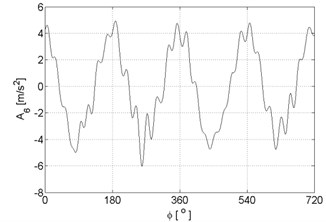
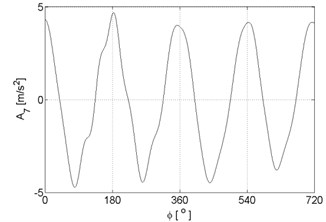
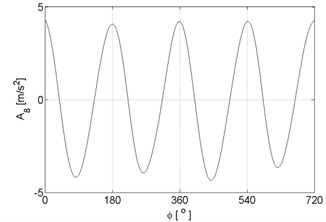
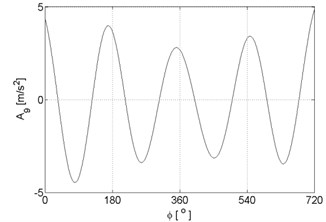
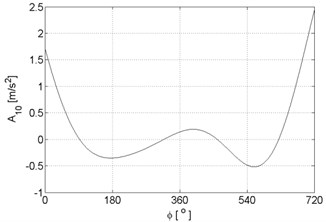
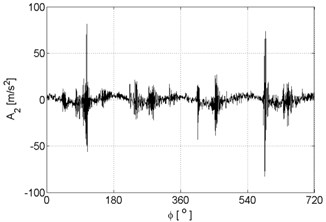
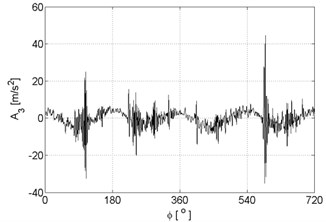
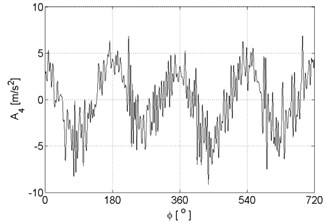
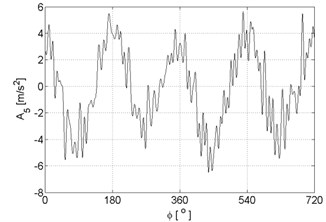
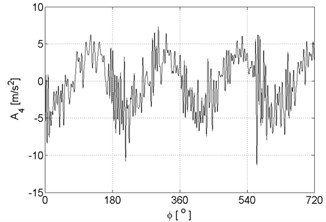
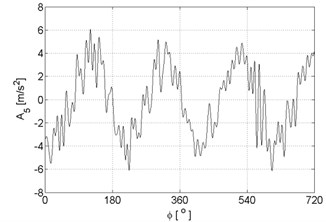
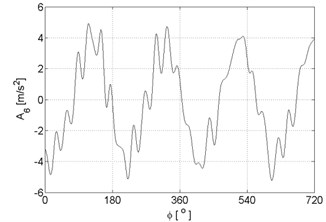
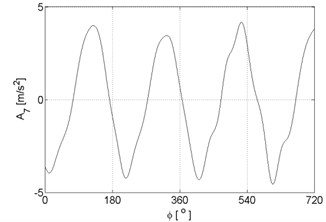
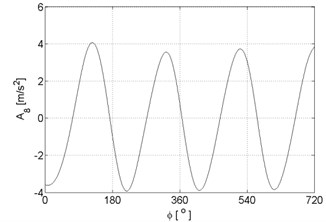
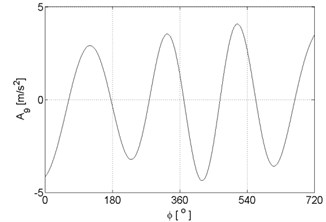
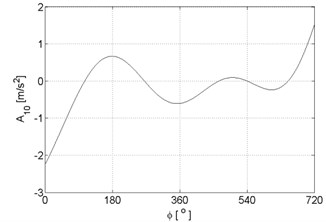
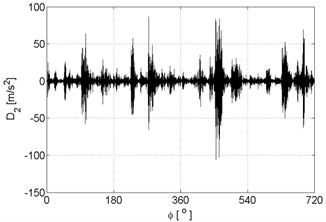
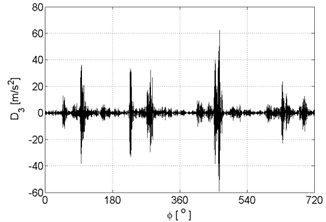
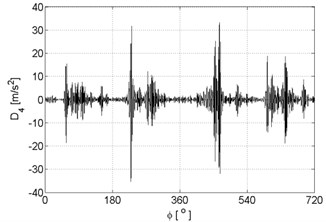
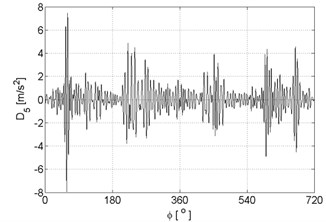
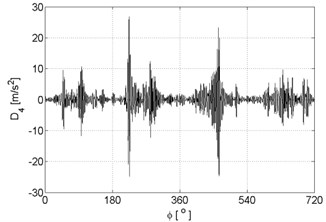
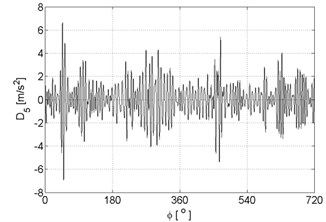
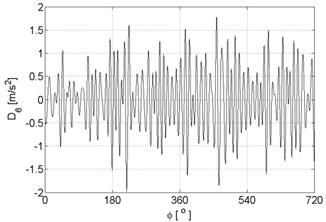
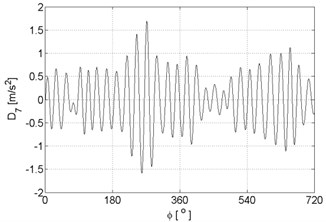
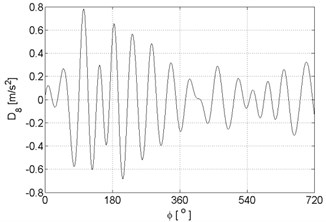
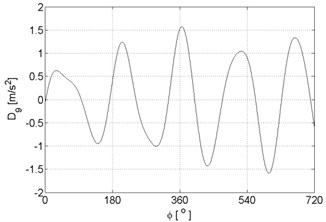
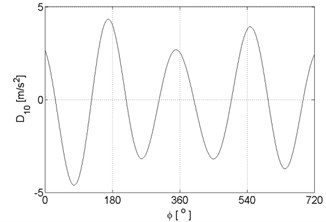
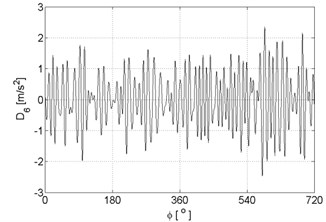
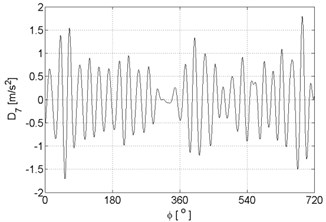
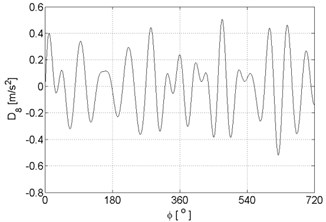
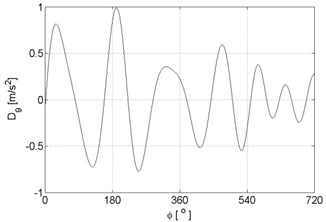
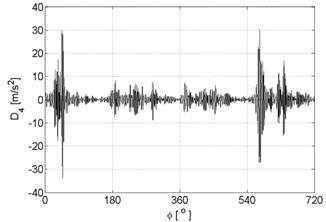
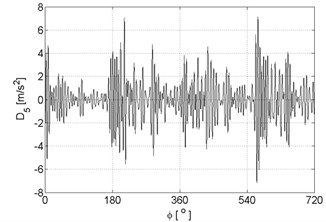
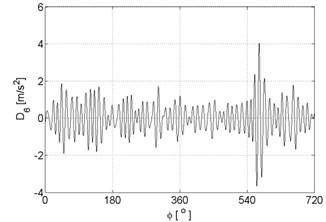
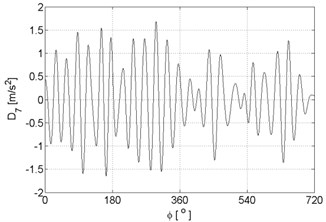
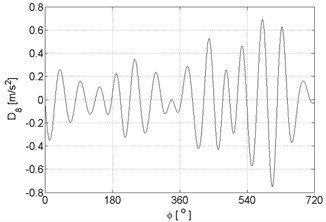
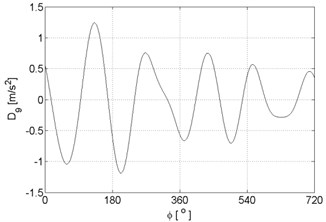
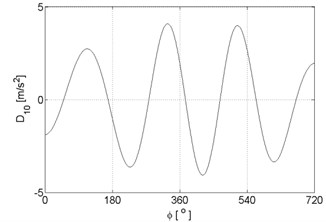
At the Figure 2-9 are shown examples of process of approximation and details appointed for measured vibration signal presented at the Figure 1.
Fig. 2Signal approximations of vibration signals registered for the engine without damages
a)
b)
c)
d)
e)
f)
g)
h)
h)
i)
Fig. 3Signal approximations of vibration signal registered for the engine with damaged of exhaust valve
a)
b)
c)
d)
e)
f)
g)
h)
i)
j)
Fig. 4Signal approximations of vibration signal registered for the engine with damaged of injector
a)
b)
c)
d)
e)
f)
g)
h)
i)
j)
Fig. 5Signal approximations of vibration signal registered for the engine with damaged of head gasket
a)
b)
c)
d)
e)
f)
g)
h)
i)
j)
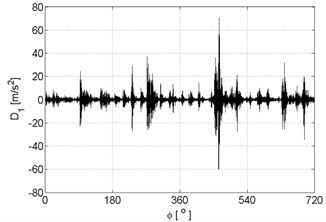
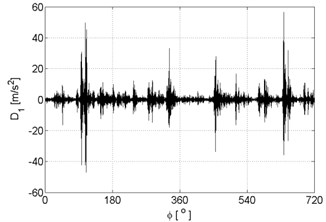
Fig. 6Signal details of vibration signals registered for the engine without damages
a)
b)
c)
d)
e)
f)
g)
h)
i)
j)
Fig. 7Signal details of vibration signal registered for the engine with damaged of exhaust valve
a)
b)
c)
d)
e)
f)
g)
h)
i)
j)
Fig. 8Signal details of vibration signal registered for the engine with damaged of injector
a)
b)
c)
d)
e)
f)
g)
h)
i)
j)
Fig. 9Signal details of vibration signal registered for the engine with damaged of head gasket
a)
b)
c)
d)
e)
f)
g)
h)
i)
j)
The objective description of the character of changes decomposed using wavelet analysis of vibroacoustic signal, adopted two ways of procedure.
The first involves the use of entropy as a measure of the signal characterized by changes in the signal. It can be determined from the relationship:
where: – analysed vibroacoustic signal.
The value of entropy is defined by measure of disorder and the degree of randomness and can be regarded as a measure of the amount of information.
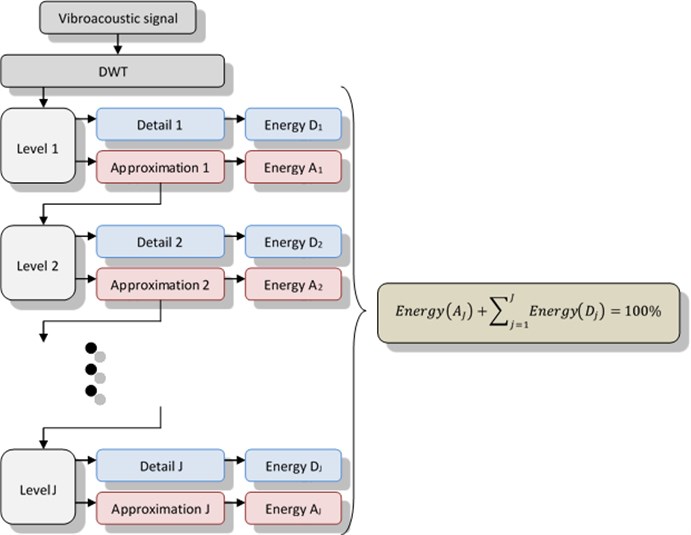
The second way of the procedure involves using signal energy to describe the changes in the vibroacoustic signal. Accepted here in accordance with the definition of the discrete wavelet transformation, that the total energy of the signal before the decomposition is equal to the sum of approximation of energy and other details. The total energy of the signal after the decomposition at the specified number of levels is taken as 100 %, and determined what percentage of this energy are approximation signals and other details. This is schematically shown in Figure 10.
Fig. 10The algorithm for determining the energy signals
On the basis of the adopted two ways of procedure, it was taken two types of patterns used in the process of learning and testing neural networks. For each way the order and the process of experiments were the same.
Starting to build the patterns, it has to say on how many levels the basis signal will be spread and which base wavelet will be used. It was decided to check usefulness of 52 base wavelet and 10 decomposition levels during researches.
In conducted researches were used wavelet from the group: haar, daubechies, biorthogonal, coiflets, symlets, reverse biorthogonal, discrete Meyer (Table 1). At the Figures 12-17 are shown results for wavelets numbered according with Table 1.
Table 1Statement of base wavelets
No. | Name | Family | No. | Name | Family |
1 | haar | Haar wavelet | 27 | coif3 | Coiflets |
2 | db2 | Daubechies wavelets | 28 | coif4 | |
3 | db3 | 29 | coif5 | ||
4 | db4 | 30 | sym2 | Symlets | |
5 | db5 | 31 | sym3 | ||
6 | db6 | 32 | sym4 | ||
7 | db7 | 33 | sym5 | ||
8 | db8 | 34 | sym6 | ||
9 | db9 | 35 | sym7 | ||
10 | db10 | 36 | sym8 | ||
11 | bior1.3 | Biorthogonal wavelets | 37 | rbio1.1 | Reverse biorthogonal wavelets |
12 | bior1.5 | 38 | rbio1.3 | ||
13 | bior2.2 | 39 | rbio1.5 | ||
14 | bior2.4 | 40 | rbio2.2 | ||
15 | bior2.6 | 41 | rbio2.4 | ||
16 | bior2.8 | 42 | rbio2.6 | ||
17 | bior3.1 | 43 | rbio2.8 | ||
18 | bior3.3 | 44 | rbio3.1 | ||
19 | bior3.5 | 45 | rbio3.3 | ||
20 | bior3.7 | 46 | rbio3.5 | ||
21 | bior3.9 | 47 | rbio3.7 | ||
22 | bior4.4 | 48 | rbio3.9 | ||
23 | bior5.5 | 49 | rbio4.4 | ||
24 | bior6.8 | 50 | rbio5.5 | ||
25 | coif1 | 51 | rbio6.8 | ||
26 | coif2 | 52 | dmey | Discrete Meyer wavelet |
In researches it was assumed, that such prepared patterns will be used for operation of neural classifiers, built at the base of artificial neural network – type PNN (Probabilistic Neural Networks). Networks of this type are constructed with three-layers – a layer of input, hidden and output. Each radial neuron models the Gauss function centred on one learner pattern. Input neurons sum the outputs of hidden neurons which belong to the class corresponding to the given output neuron. Network output values are proportional to the kernel estimators of density functions probability for different classes. After applying the normalization ensures summation to the unity are estimates probabilities of belonging to particular classes. Using this type of network it should be appropriately chosen smoothing factor . It represents the radial deviation of the Gaussian functions and is a measure of the range of neurons in the hidden layer. Too low value causes the loss of knowledge generalization property by the network, and too large value prevents proper details description. The coefficient , as well as radial networks is chosen experimentally.
Group of patterns is usually divided at the part designed for network teaching and group designed to network validation [4, 11-16, 18, 19]. Because the validation group takes part in network teaching process in some sense, its independence as a network valuation tool is being disputed. That is why, the test group is being created, which helps to make a single check of the neural network working. This set is so used to the final control operation of the neural classifier, and the result has no effect on weight change between connections. Due to the specific type of neural network PNN type, there is no need to share a set of patterns for the three parts. In this case, enough is simply divided for the learning and testing data. In the experiments carried out a set of patterns was divided in the following proportions: 50 % – teaching group, 50 % – testing group the set of patterns was made from 50 examples of each type of recognized damage and 50 examples of the absence of damage. It was together 200 examples respectively divided into training and testing sets.
In conducted experiments it was tested the usefulness of formed patterns sets for another 10 levels of decomposition to reach sets consisting of the following components:
• 1 (neural network with 2 inputs),
• 1÷2 (neural network with 3 inputs),
• 1÷3 (neural network with 4 inputs),
• 1÷4 (neural network with 5 inputs),
• 1÷5 (neural network with 6 inputs),
• 1÷6 (neural network with 7 inputs),
• 1÷7 (neural network with 8 inputs),
• 1÷8 (neural network with 9 inputs),
• 1÷9 (neural network with 10 inputs),
•1÷10 (neural network with 11 inputs).
Depending on the size of the pattern used, neural networks have from 2 to 11 inputs.
Exemplary patterns to the input of a neural network is shown in Table 2 – in the case of using the entropy of signals, and in Table 3 – in the case of using signal energy.
PNN type neural network was checked in respect of correctness of patterns classification with 86 different parameters of coefficient .
In conducted experiments the number of neurons in the hidden layer network was 100. This number is the direct result selected for experiment PNN network type, and used in the process of teaching the number of patterns.
Table 2Examples of patterns built on the basis of entropy signals
Pattern | Number of decomposition levels | Number of network input | ||||||||||
1 | 2 | 3 | 4 | 5 | 6 | 7 | 8 | 9 | 10 | 11 | ||
engine without damages | 1 | -3321491.65 | -381675.39 | – | – | – | – | – | – | – | – | – |
2 | -820864.94 | -381675.39 | -2279728.57 | – | – | – | – | – | – | – | – | |
3 | -232977.21 | -381675.39 | -2279728.57 | -483332.03 | – | – | – | – | – | – | – | |
4 | -42496.07 | -381675.39 | -2279728.57 | -483332.03 | -238238.91 | – | – | – | – | – | – | |
5 | -36436.17 | -381675.39 | -2279728.57 | -483332.03 | -238238.91 | -8318.09 | – | – | – | – | – | |
6 | -33432.71 | -381675.39 | -2279728.57 | -483332.03 | -238238.91 | -8318.09 | 183.31 | – | – | – | – | |
7 | -31641.28 | -381675.39 | -2279728.57 | -483332.03 | -238238.91 | -8318.09 | 183.31 | 513.72 | – | – | – | |
8 | -30811.87 | -381675.39 | -2279728.57 | -483332.03 | -238238.91 | -8318.09 | 183.31 | 513.72 | 227.72 | – | – | |
9 | -26298.74 | -381675.39 | -2279728.57 | -483332.03 | -238238.91 | -8318.09 | 183.31 | 513.72 | 227.72 | 551.08 | – | |
10 | -1010.25 | -381675.39 | -2279728.57 | -483332.03 | -238238.91 | -8318.09 | 183.31 | 513.72 | 227.72 | 551.08 | -31506.44 | |
damaged of exhaust valve | 1 | -3751291.38 | -816710.67 | – | – | – | – | – | – | – | – | – |
2 | -639746.84 | -816710.67 | -2940093.67 | – | – | – | – | – | – | – | – | |
3 | -159657.78 | -816710.67 | -2940093.67 | -429837.05 | – | – | – | – | – | – | – | |
4 | -69575.42 | -816710.67 | -2940093.67 | -429837.05 | -114961.66 | – | – | – | – | – | – | |
5 | -57094.37 | -816710.67 | -2940093.67 | -429837.05 | -114961.66 | -8484.22 | – | – | – | – | – | |
6 | -53620.06 | -816710.67 | -2940093.67 | -429837.05 | -114961.66 | -8484.22 | 223.09 | – | – | – | – | |
7 | -51084.62 | -816710.67 | -2940093.67 | -429837.05 | -114961.66 | -8484.22 | 223.09 | 376.63 | – | – | – | |
8 | -48642.52 | -816710.67 | -2940093.67 | -429837.05 | -114961.66 | -8484.22 | 223.09 | 376.63 | 319.50 | – | – | |
9 | -32717.31 | -816710.67 | -2940093.67 | -429837.05 | -114961.66 | -8484.22 | 223.09 | 376.63 | 319.50 | -127.28 | – | |
10 | -1291.10 | -816710.67 | -2940093.67 | -429837.05 | -114961.66 | -8484.22 | 223.09 | 376.63 | 319.50 | -127.28 | -30495.34 | |
damaged of injector | 1 | -2930666.84 | -268066.02 | – | – | – | – | – | – | – | – | – |
2 | -794250.76 | -268066.02 | -2067972.08 | – | – | – | – | – | – | – | – | |
3 | -254240.09 | -268066.02 | -2067972.08 | -455827.41 | – | – | – | – | – | – | – | |
4 | -57823.80 | -268066.02 | -2067972.08 | -455827.41 | -204149.16 | – | – | – | – | – | – | |
5 | -48438.31 | -268066.02 | -2067972.08 | -455827.41 | -204149.16 | -4799.07 | – | – | – | – | – | |
6 | -42609.45 | -268066.02 | -2067972.08 | -455827.41 | -204149.16 | -4799.07 | -465.30 | – | – | – | – | |
7 | -39621.74 | -268066.02 | -2067972.08 | -455827.41 | -204149.16 | -4799.07 | -465.30 | 282.89 | – | – | – | |
8 | -38205.86 | -268066.02 | -2067972.08 | -455827.41 | -204149.16 | -4799.07 | -465.30 | 282.89 | 296.48 | – | – | |
9 | -31854.49 | -268066.02 | -2067972.08 | -455827.41 | -204149.16 | -4799.07 | -465.30 | 282.89 | 296.48 | 503.25 | – | |
10 | -1038.46 | -268066.02 | -2067972.08 | -455827.41 | -204149.16 | -4799.07 | -465.30 | 282.89 | 296.48 | 503.25 | -35090.90 | |
damaged of head gasket | 1 | -3926466.90 | -473003.17 | – | – | – | – | – | – | – | – | – |
2 | -965214.40 | -473003.17 | -2763986.75 | – | – | – | – | – | – | – | – | |
3 | -218818.47 | -473003.17 | -2763986.75 | -768815.39 | – | – | – | – | – | – | – | |
4 | -57002.59 | -473003.17 | -2763986.75 | -768815.39 | -176654.06 | – | – | – | – | – | – | |
5 | -44742.18 | -473003.17 | -2763986.75 | -768815.39 | -176654.06 | -13264.98 | – | – | – | – | – | |
6 | -39600.56 | -473003.17 | -2763986.75 | -768815.39 | -176654.06 | -13264.98 | -972.91 | – | – | – | – | |
7 | -34896.34 | -473003.17 | -2763986.75 | -768815.39 | -176654.06 | -13264.98 | -972.91 | 56.19 | – | – | – | |
8 | -34121.09 | -473003.17 | -2763986.75 | -768815.39 | -176654.06 | -13264.98 | -972.91 | 56.19 | 284.37 | – | – | |
9 | -27883.31 | -473003.17 | -2763986.75 | -768815.39 | -176654.06 | -13264.98 | -972.91 | 56.19 | 284.37 | 399.57 | – | |
10 | 256.78 | -473003.17 | -2763986.75 | -768815.39 | -176654.06 | -13264.98 | -972.91 | 56.19 | 284.37 | 399.57 | -28385.61 | |
Table 3Examples of patterns built on the basis of energy signals
Pattern | Number of decomposition levels | Number of network input | ||||||||||
1 | 2 | 3 | 4 | 5 | 6 | 7 | 8 | 9 | 10 | 11 | ||
engine without damages | 1 | 88.04 | 11.96 | – | – | – | – | – | – | – | – | – |
2 | 27.22 | 11.84 | 60.94 | – | – | – | – | – | – | – | – | |
3 | 13.19 | 11.77 | 60.59 | 14.45 | – | – | – | – | – | – | – | |
4 | 5.76 | 11.65 | 59.97 | 14.31 | 8.31 | – | – | – | – | – | – | |
5 | 6.82 | 11.42 | 58.82 | 14.03 | 8.15 | 0.76 | – | – | – | – | – | |
6 | 9.68 | 11.00 | 56.65 | 13.51 | 7.85 | 0.73 | 0.58 | – | – | – | – | |
7 | 15.44 | 10.28 | 52.95 | 12.63 | 7.33 | 0.68 | 0.54 | 0.15 | – | – | – | |
8 | 25.17 | 9.10 | 46.85 | 11.18 | 6.49 | 0.60 | 0.48 | 0.11 | 0.02 | – | – | |
9 | 38.99 | 7.41 | 38.14 | 9.10 | 5.28 | 0.49 | 0.39 | 0.09 | 0.03 | 0.08 | – | |
10 | 54.14 | 5.39 | 27.77 | 6.62 | 3.85 | 0.36 | 0.29 | 0.07 | 0.01 | 0.06 | 1.44 | |
damaged of exhaust valve | 1 | 81.64 | 18.36 | – | – | – | – | – | – | – | – | – |
2 | 19.77 | 18.28 | 61.95 | – | – | – | – | – | – | – | – | |
3 | 9.10 | 18.17 | 61.56 | 11.17 | – | – | – | – | – | – | – | |
4 | 6.12 | 17.95 | 60.84 | 11.05 | 4.04 | – | – | – | – | – | – | |
5 | 7.16 | 17.56 | 59.51 | 10.80 | 3.96 | 1.01 | – | – | – | – | – | |
6 | 10.40 | 16.87 | 57.17 | 10.38 | 3.80 | 0.97 | 0.41 | – | – | – | – | |
7 | 16.61 | 15.68 | 53.13 | 9.65 | 3.53 | 0.90 | 0.38 | 0.12 | – | – | – | |
8 | 26.91 | 13.74 | 46.55 | 8.45 | 3.09 | 0.79 | 0.33 | 0.10 | 0.04 | – | – | |
9 | 41.30 | 10.99 | 37.24 | 6.76 | 2.47 | 0.63 | 0.27 | 0.08 | 0.02 | 0.24 | – | |
10 | 56.53 | 7.84 | 26.55 | 4.82 | 1.76 | 0.44 | 0.19 | 0.06 | 0.01 | 0.18 | 1.62 | |
damaged of injector | 1 | 90.40 | 9.60 | – | – | – | – | – | – | – | – | – |
2 | 29.03 | 9.52 | 61.45 | – | – | – | – | – | – | – | – | |
3 | 13.70 | 9.46 | 61.07 | 15.77 | – | – | – | – | – | – | – | |
4 | 6.60 | 9.37 | 60.48 | 15.63 | 7.92 | – | – | – | – | – | – | |
5 | 7.50 | 9.20 | 59.39 | 15.35 | 7.78 | 0.78 | – | – | – | – | – | |
6 | 10.25 | 8.89 | 57.39 | 14.82 | 7.52 | 0.76 | 0.37 | – | – | – | – | |
7 | 15.72 | 8.33 | 53.78 | 13.88 | 7.05 | 0.71 | 0.35 | 0.18 | – | – | – | |
8 | 25.12 | 7.40 | 47.76 | 12.33 | 6.26 | 0.63 | 0.31 | 0.16 | 0.03 | – | – | |
9 | 38.83 | 6.03 | 38.93 | 10.05 | 5.10 | 0.51 | 0.25 | 0.13 | 0.02 | 0.15 | – | |
10 | 53.47 | 4.41 | 28.48 | 7.35 | 3.73 | 0.38 | 0.19 | 0.09 | 0.02 | 0.09 | 1.79 | |
damaged of head gasket | 1 | 87.94 | 12.06 | – | – | – | – | – | – | – | – | – |
2 | 27.74 | 11.91 | 60.35 | – | – | – | – | – | – | – | – | |
3 | 10.62 | 11.81 | 59.81 | 17.76 | – | – | – | – | – | – | – | |
4 | 5.93 | 11.66 | 59.08 | 17.54 | 5.79 | – | – | – | – | – | – | |
5 | 5.94 | 11.42 | 57.84 | 17.17 | 5.67 | 1.96 | – | – | – | – | – | |
6 | 8.53 | 11.07 | 56.08 | 16.65 | 5.49 | 1.90 | 0.28 | – | – | – | – | |
7 | 13.51 | 10.44 | 52.88 | 15.70 | 5.18 | 1.79 | 0.27 | 0.23 | – | – | – | |
8 | 22.30 | 9.37 | 47.49 | 14.10 | 4.65 | 1.61 | 0.24 | 0.22 | 0.02 | – | – | |
9 | 35.22 | 7.80 | 39.51 | 11.73 | 3.87 | 1.34 | 0.20 | 0.19 | 0.02 | 0.12 | – | |
10 | 50.42 | 5.83 | 29.53 | 8.77 | 2.89 | 1.00 | 0.15 | 0.15 | 0.01 | 0.09 | 1.16 | |
Classifiers, built during conducted researches had 4 outputs. Another output responded to the occurrence of the fault, and additional outputs corresponding to the correct operation of the engine. Table 4 shows the values of the signals at the outputs for the network correctly classified pattern. Such values were obtained for the sample patterns in Table 2 and 3, which meant flawless ranking.
All applications used in the pre-processing of vibroacoustic signals and neural construction systems have been developed in Matlab/Simulink environment.
Table 4The values of the signals at the outputs of the network to correctly classified pattern
Pattern | The value of the output number | |||
1 | 2 | 3 | 4 | |
engine without damages | 1 | 0 | 0 | 0 |
damaged of exhaust valve | 0 | 1 | 0 | 0 |
damaged of injector | 0 | 0 | 1 | 0 |
damaged of head gasket | 0 | 0 | 0 | 1 |
3. Research results
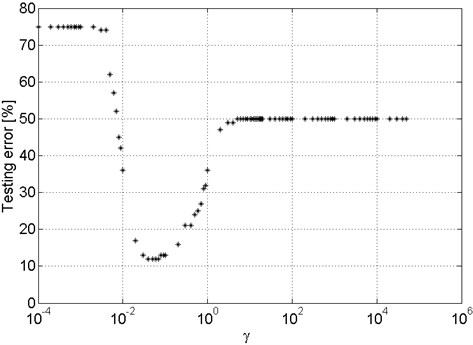
Using PNN classifiers it was verified which of the base wavelet is the best suited for use in the patterns construction process for selected mechanical damages of the car combustion engine. It was checked tens of classifiers groups, where each of which was trained on data coming from the vibratory signals recorded in a particular place (4 measuring places: exhaust valve of 1st cylinder, intake valve of 1st cylinder, exhaust valve of 4th cylinder, gearbox), for the engine operating on specified gear (3 gears), with defined speed (3 speeds). For each of 36 groups of classifiers were determined the best wavelets both for patterns built on energy, as well as on signals entropy with different number of decomposition levels (1-10). For Each of PNN classifiers were selected coefficient (Figure 11).
Fig. 11An example of the parameter γ impact on the value of the error
The results show a large dependence of the minimum classification error on the choice of the source signal and the parameters of its pre-processing in order to build the training data. Unfortunately, existing relationships are different for different tested variants, which makes it impossible to set unambiguous conclusions. Example relation are shown in Figures 12-15.
Fig. 12The best results obtained for PNN classifiers – patterns: energy, gearbox, 1 decomposition level
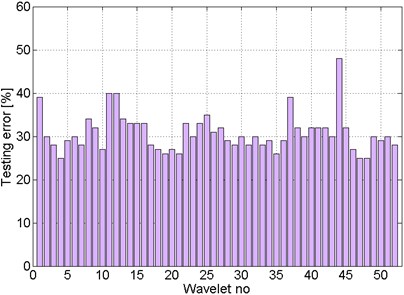
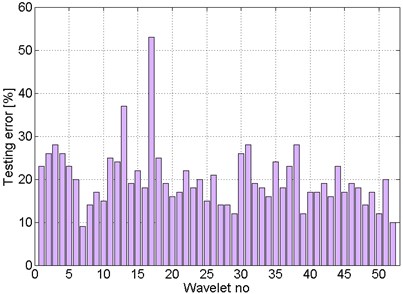
Fig. 13The best results obtained for PNN classifiers – patterns: energy, gearbox, 10 decomposition level
Figures 16 and 17 present the distribution of the number of cases for which using the given basis wavelet classifiers were characterized by the minimum value of the error. The best base wavelet would be one for which the number of cases would be 360 (4 places of vibration signals measurement × 3 gears × 3 engine speeds, for which signal were registered × 10 signal decomposition levels). It would amount to the situation, where regardless of the signal measurement method and a selected number of decomposition levels used to patterns build, the classifier would show the error-free operation. In the experiment, this situation has not occurred.
Fig. 14The best results obtained for PNN classifiers – patterns: entropy, gearbox, 1 decomposition level
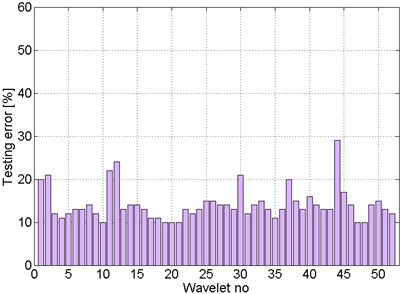
Fig. 15The best results obtained for PNN classifiers – patterns: entropy, gearbox, 10 decomposition level
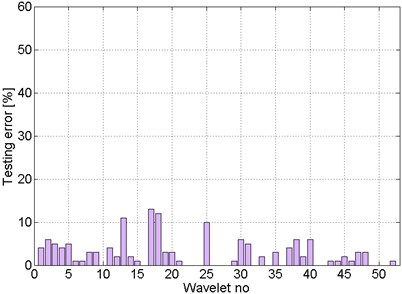
Fig. 16Distribution of cases number for which the classification errors were minimal – patterns: energy
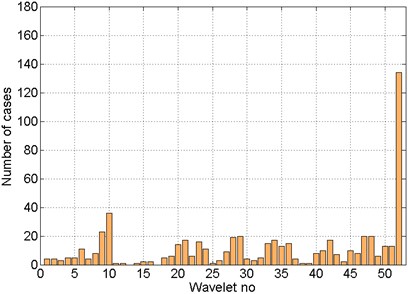
Fig. 17Distribution of cases number for which the classification errors were minimal – patterns: entropy
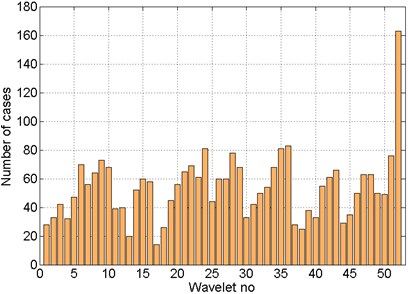
The best base wavelet, selected on the basis of the total number of cases distribution for which classification errors were minimal (Figs. 16 and 17), was discrete Meyer wavelet. On the basis of shown distributions it can be also request for more information content regarding mechanical failures occurring in the patterns obtained by using entropy than energy.
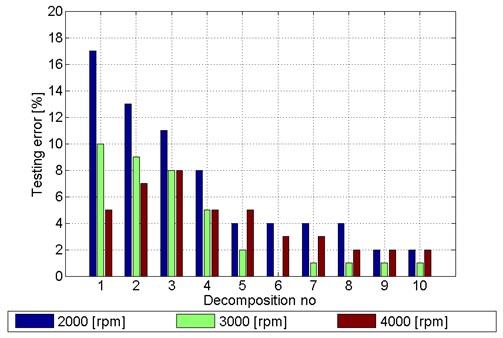
When analysing results in terms of the impact of choice of the number of signal decomposition levels in the process of creating patterns on the present level of error a trend similar to the decrease in the error with increasing patterns complexity. This can be seen in the sample dependency – Figure 18. The figure shows that the best results obtained (minimum values of test error) for classifiers built using patterns based on the entropy of signals recorded in the area of the inlet valve on the 1st cylinder, for the engine running in 5th gear speeds of up to 2000 rpm, 3000 rpm and 4000 rpm. Similar relationships can be observed for the classifiers using patterns obtained from vibration signals recorded in other places of measurement (4 measuring points) with the engine at a different speed (3 gears), with other speeds (3 speeds).
Regardless of the test variant, a significant effect on the correctness of diagnostic process was the choice of values for the probabilistic neural network (Figure 11).
Fig. 18The best results obtained for the PNN classifier – patterns: entropy, intake valve 1st cylinder, gear 5
As a result of experiments, it was possible to build a perfectly or nearly perfectly working neural classifiers, distinguishing selected mechanical damages of car engine components on the basis of vibration emission.
4. Conclusions
As the researches conducted in many centers around the world, one of the possibilities of obtaining information about the technical conditions are vibroacoustic phenomena. Selecting these phenomena as sources of information due to various reasons, including:
• vibrations are reflecting the most important physical processes that determine the correct functioning,
• vibroacoustic vibrations as a carrier of information, it is characterized by large information capacity,
• the way of vibroacoustic vibration registration allows to perform quick measurements in natural working conditions.
Vibroacoustic signal generated by the internal combustion engines of motor vehicles is a composite signal resulted from multiple sources. Splitting the signal into individual components is possible if there are known characteristics of signals generated by individual kinematic pairs. Main problems of vibroacoustic diagnosis includes finding a method of separating the signal components, which can be assigned to specific sources, and to establish rules for the assessment of the kinematic pair based on the obtained signal. It is necessary here to know characteristics of vibroacoustic signal and ways of its process [20-31].
That is why in many centers around the world are conducted researches aimed at finding the right tools, which important element are algorithms organizing the process of collecting, sorting and processing of vibroacoustic signals according to specific rules, enabling the classification of conditions and supporting mechanism recognition conducting that influence them. Different specificity and conditions of such tasks in relation to a particular object makes, that in spite of existing many checked and having application tribute algorithms of vibroacoustic signals analysis, wealth of rules and inferences based on it, they are still characterized by insufficient recognition level of determinants defining them.
In many centers around the world are carried out research on the monitoring of various parameters related to today's computerized means of transport. Currently used on-board diagnostic systems allow for the detection of simple damage when it exceeds the limits. However, if the damage is not exceeding the limit values, measured by the intermediate values representing emission criterion, such damage cannot be recognized by the imperfect system model. The research on diagnostics method application for the vehicle after repair should be considered. There are many novel repair technology, especially welding methods [32-35]. It therefore seems to be advisable to undertake research aimed at increasing the capacity of on-board diagnostic systems by extending them with additional diagnostic system based on other symptoms.
The article presents the results of research aimed at chosing damage diagnosing elements of car combustion engines on the basis of vibration signals generated during operation. Here is proposed diagnostic system using probabilistic neural networks and the method of patterns construction using discrete wavelet transformation. Obtained results confirm the possibility of diagnosing the technical condition of the car engine components using vibroacoustic phenomena generated during its working.
References
-
Directive 98/69/EC of the European Parliament and of the Council.
-
Merkisz J., Rychter M. OBD II system as a future diagnostic methods of vehicles. Maintenance and Reliability, Vol. 1, 2002, p. 38-51.
-
Dąbrowski Z., Zawisza M. Investigations of the vibroacoustic signals sensitivity to mechanical defects not recognised by the OBD system in diesel engines. Solid State Phenomena, Vol. 180, 2012, p. 194-199.
-
Czech P., Madej H. Application of cepstrum and spectrum histograms of vibration engine body for setting up the clearance model of the piston-cylinder assembly for RBF neural classifier. Maintenance and Reliability, Vol. 4, 2011, p. 15-20.
-
Ettefagh M. M., Sadeghi M. H., Pirouzpanah V., Arjmandi Tash H. Knock detection in spark ignition engines by vibration analysis of cylinder block: A parametric modeling approach. Mechanical Systems and Signal Processing, Vol. 22, 2008, p. 1495-1514.
-
Figlus T. Diagnosing the engine valve clearance, on the basis of the energy changes of the vibratory signal. Maintenance Problems, Vol. 1, 2009, p. 75-84.
-
Kimmich F., Schwarte A., Isermann R. Fault detection for modern diesel engines using signal and process model-based methods. Control Engineering Practice, Vol. 13, 2005, p. 189-203.
-
Puškár M., Bigoš P., Puškárová P. Accurate measurements of output characteristics and detonations of motorbike high-speed racing engine and their optimization at actual atmospheric conditions and combusted mixture composition. Measurement, Vol. 45, 2012, p. 1067-1076.
-
Satyanarayana-Murthy Y. V. V. Combustion analysis and knock detection in single cylinder DI-diesel engine using vibration signature analysis. International Journal of Engineering Science and Technology, Vol. 3, Issue 1, 2011, p. 10-16.
-
Villarino R., Böhme J. F. Pressure reconstruction and misfire detection from multichannel structure-borne sound. IEEE International Conference on Acoustics, Speech, and Signal Processing, 2004, p. 141-144.
-
Hu Y. H., Hwang J. N. Handbook of neural network signal processing. CRC Press Taylor & Francis Group, Boca Raton, 2002.
-
Korbicz J., Kościelny J., Kowalczuk Z., Cholewa W. Fault Diagnosis, Models, Artificial Intelligence, Applications. Springer-Verlag, 2004.
-
Tadeusiewicz R., Chaki R., Chaki N. Exploring Neural Networks with C#. CRC Press, Taylor & Francis Group, Boca Raton, 2014.
-
Tadeusiewicz R., Korbicz J., Rutkowski L., Duch W. Neural Networks in Biomedical Engineering. In Monograph: Biomedical Engineering – Basics and Applications. Exit, Warsaw, 2013.
-
Wilamowski B. M., Irvin J. D. The Industrial Electronics Handbook – Intelligent Systems. CRC Press, Boca Raton, 2011.
-
Zuber N., Bajrić R., Šostakov R. Gearbox faults identification using vibration signal analysis and artificial intelligence methods. Maintenance and Reliability, Vol. 16, Issue 1, 2014, p. 61-65.
-
Wu J. D., Chen J. C. Continuos wavelet transform technique for fault signal diagnosis of internal combustion engines. NDT&E International, Vol. 39, 2006, p. 304-311.
-
Dąbrowski D., Cioch W. Neural classifiers of vibroacoustic signals in implementation on programmable devices (FPGA) – Comparison. Acta Physica Polonica, Vol. 119, Issue 6-A, 2011, p. 946-949.
-
Sitek W., Dobrzański L., Zaclona J. The modelling of high-speed steels' properties using neural networks. Journal of Materials Processing Technology, Vol. 157, 2004, p. 245-249.
-
Bajrić R., Zuber N., Šostakov R. Relations between pulverizing process parameters and beater wheel mill vibration for predictive maintenance program setup. Maintenance and Reliability, Vol. 16, Issue 1, 2014, p. 158-163.
-
Dolecek R., Novak J., Cerny O. Experimental research of harmonic spectrum of currents at traction drive with PMSM. Radioengineering, Vol. 20, Issue 2, 2011, p. 512-515.
-
Dybała J., Zimroz R. Rolling bearing diagnosing method based on empirical mode decomposition of machine vibration signal. Applied Acoustics, Vol. 77, 2014, p. 195-203.
-
Grega R., Homišin J., Kaššay P., Krajňák J. The analyse of vibrations after changing shaft coupling in drive belt conveyer. Scientific Papers of University of Silesia Transportation Department, Vol. 72, 2011, p. 23-31.
-
Grządziela A. Diagnosis of naval gas turbine rotors with the use of vibroacoustic papmeters. Polish Maritime Researches, Vol. 7, Issue 3, 2000, p. 14-17.
-
Grządziela A. Modeling of propeller shaft dynamics at pulse load. Polish Maritime Researches, Vol. 15, Issue 4, 2008, p. 52-58.
-
Kłaczyński M., Wszołek T. Artificial intelligence and learning systems methods in supporting long-term acoustic climate monitoring. Acta Physica Polonica A, Vol. 123, Issue 6, 2013, p. 1024-1028.
-
Kłaczyński M., Wszołek T. Detection and classification of selected noise sources in long-term acoustic climate monitoring. Acta Physica Polonica A, Vol. 121, Issue 1-A, 2012, p. A-179-A-182.
-
Ragulskis M., Maskeliunas R. Measurement of transverse vibrations of piezoelectric ceramics by atomic force microscopy. Experimental Techniques, Vol. 30, Issue 2, 2006, p. 37-41.
-
Ragulskis M., Palevicius A., Ragulskis L., Bubulis A. Generalized Abel transform for the analysis of fluid vibration in a tube. Optical Engineering, Vol. 46, Issue 6, 2007, p. 065801.
-
Urbanský M., Homišin J., Krajňák J. Analysis of the causes of gaseous medium pressure changes in compression space of pneumatic coupling. Transactions of the Universities of Kosice, Vol. 2, 2011, p. 35-40.
-
Zimroz R., Bartkowiak A. Two simple multivariate procedures for monitoring planetary gearboxes in non-stationary operating conditions. Mechanical Systems and Signal Processing, Vol. 38, Issue 1, 2013, p. 237-247.
-
Węgrzyn T., Piwnik J., Łazarz B., Hadryś D. Main micro-jet cooling gases for steel welding. Archives of Materials and Metallurgy, Vol. 58, Issue 2, 2013, p. 551-553.
-
Węgrzyn T. The classification of metal weld deposits in terms of the amount of nitrogen. Conference of International Society of Offshore and Polar Engineers, Seattle, USA, 2000, p. 130-134.
-
Lisiecki A. Diode laser welding of high yield steel. Proceedings of SPIE, Vol. 8703, 2012.
-
Lisiecki A. Welding of titanium alloy by disk laser. Proceedings of SPIE, Vol. 8703, 2012.
About this article

The results presented in the paper were obtained within supported by the Polish Scientific Committee.
