Abstract
Considering the practical necessity of realizing the aircraft structure health monitoring (SHM), not only some advanced sensors must be adopted, an appropriate signal processing method is also necessary, in order to achieve the goals of signal characteristic extraction and health assessment. Based on the fact that piezoelectric (PZT) sensor signals extracted from the monitored structure carry a lot of useful health related information, this paper proposes to utilize the power characteristics of PZT signals for health assessment of the aircraft structure. The Hilbert-Huang Transform (HHT) algorithm is employed to calculate the power characteristic vector, after that, the self-organizing map (SOM) is used to map the corresponding characteristics into a confidence value (CV) which represents the health state of the monitored structure. The experimental results demonstrate that the proposed method is reliable.
1. Introduction
Structural health monitoring (SHM) technique is integrated smoothly by information science and engineering with materials science, which utilize embedded or surface pasted sensor system as the neural system, capturing health related real-time information online, in order to monitoring and predicting the structural damages by using information processing and fault diagnosis methods. The real-time monitoring of the aircraft components can be achieved by utilizing the SHM technique, which saves the time for disassembling and checking the related components. As a result, the flight time can be guaranteed, and the maintaining cost is sure to be largely reduced.
Recently, the applications of SHM are mainly concentrated in structural hardness and fatigue test on ground. Around the year 2013, Airbus and Boeing Company planned to work on the online monitoring of the aircrafts, and hoped to realize the goal of the whole aircraft monitored by the year of 2018. Since the 1990s, our country started to investment in researches on complicated large-scale aircraft SHM technology of the 863 Aerospace hi-tech program. Some research units like NUAA, Chongqing University, HUST, HIT, etc. have got a lot of achievements on SHM work, such as self-adaptive composite materials, self-diagnosis and self-repairing of fiber smart structural, as well as damage localization using acoustic emission, wavelet analysis and neural network [1]. These methods mainly focus on the signal itself, less considering about digging into the inner characteristics of the monitoring signals. This paper proposes to utilize the power characteristics of PZT signals for health assessment of the aircraft structure, and the experimental results demonstrate that the proposed method is reliable.
2. Experimental setup
Sensor system acts as the info-source of the SHM, considering the aircraft structural characteristics, the chosen sensors should be light, small, low-power, large range of working temperature, good environmental adaptability and inference resistance, arranged at the points that well reflect the changes of related parameters, and finally respond to the health state of the aircraft structural. In this experiment, we use the piezoelectric material sensor PZT [2] to monitor the structural health state of a CFRP stiffened panel, the experimental set up is shown in Fig. 1, showing the panel bonded with PZT sensors.
Fig. 1Experimental setup
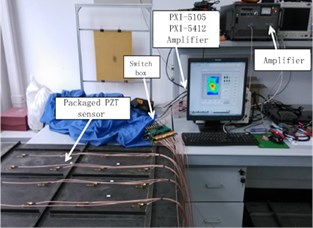
Fig. 2Distribution of PZT sensors on the panel
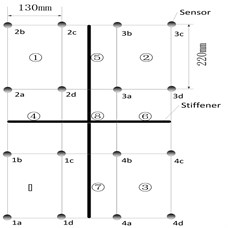
Compared with traditional sensors, PZT sensors possess the advantages of electromagnetic interference resistance, waterproof, high temperature resistance and corrosion resistance. In order to perform the multi-site damage detection, the monitoring area is divided into several subareas. Considering the property of the Lamb wave in specific material and the geometric shape of the CFPR stiffened panel, the distribution of PZT sensors is optimized, shown in Fig. 2.
In this study, we set the No. 3 area as an example, under the impulse sine wave of sensor 4c at a rate of 60 kHz, the signal of sensor 4a is used to monitor the structural health of this area. After the signal feature extraction process, the extracted Power feature vectors from the sensor 4a are input to a SOM neural network, which will help to get a normalized confidence value (CV) that indicates the health state of the No. 3 area.
3. Power feature extraction from the monitored signal
The HHT method is composed of empirical mode decomposition (EMD) and Hilbert transform (HT) [3]. Its core part is to decompose the signal through EMD method and get the intrinsic mode functions (IMF) of signal; the detailed process of EMD is shown in Fig. 3. For the IMF components, they must satisfy the following two conditions:
1) The number of zero-crossing points and the number of extreme points must be equal or at most differ by one;
2) The mean value of the envelope defined by the local maxima and the envelope define by the local minimum is zero. Once the IMF components are obtained, then do the Hilbert transform on them so as to obtain the instantaneous frequency and amplitude of signal.
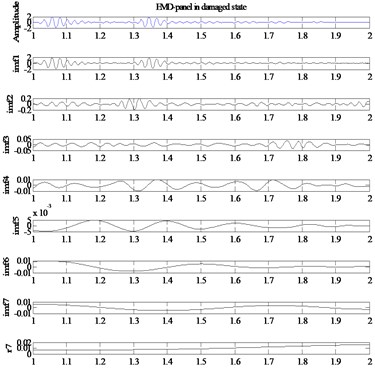
EMD method is based on local feature analysis of the monitord signal, which explodes the complicated signal into numbered IMF components that reflect their simple oscillaation modes respectively, containing the frequency conponets from high frequency to low frequency in due order [4]. Besides, EMD method is complete and the IMF components perfom a good orthogonality, which makes the IMF Power feature vectors aviliable to be utilized for health assessment. Fig. 4 and Fig. 5 show the EMD results of normal state and damaged state of the panel’s No. 3 area, respectively.
Through the decomposition process mentioned in Fig. 3, we got the wanted IMF components. After doing the Hilbert Transform on each IMF component , with the Hilbert spectrum defined, then the Hilbert marginal spectrum can also be be expressed as follows:
In Eq. (1), is the sampling time. The marginal spectrum offers a measure of the total amplitude contribution from each frequency value. This spectrum represents the accumulated amplitude over the entire data span in a probabilistic sense.
Fig. 3The flowchart of empirical mode decomposition
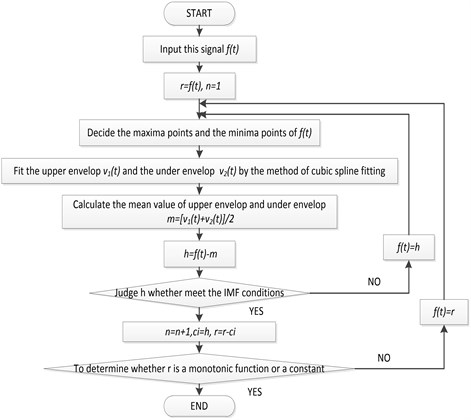
Fig. 4EMD result of the normal state panel
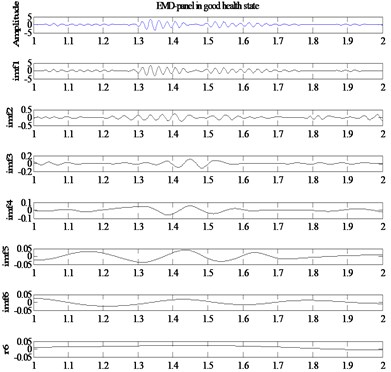
Fig. 5EMD result of the damaged state panel
HHT spectrum displays the rules of the signal power distrubuting along with the instant frequency, Fig. 6 shows the HHT spectrum of normal state and damaged state of the panel’s No. 3 area, respectively.
For the purpose of realizing the health assessment of the panel, the first six IMF components are selected to perform the HHT process, after that, the correspond power values are calculated and used as the feature vector for the SOM-based health assessment. The EMD-based Power feature extracted process is shown in Fig. 7.
Fig. 6a) HHT spectum of the normal state and b) damaged state panel
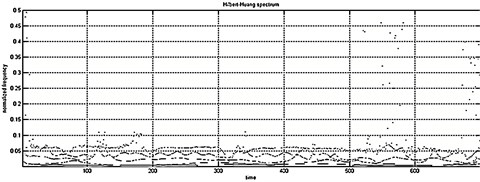
a)
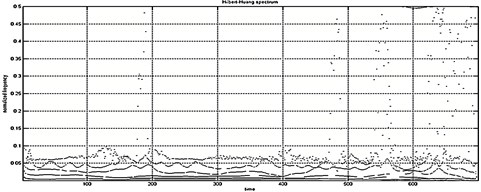
b)
Fig. 7EMD-based Power feature extracted process
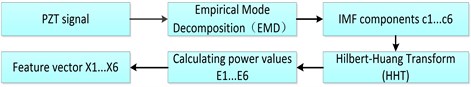
Fig. 8Structure of SOM network
4. Structural health assessment based on SOM
There have been some techniques that are often used in healing systems, such as the distance function distinction, the artificial neural network, the support vector machine, the multi-agent technology, etc.
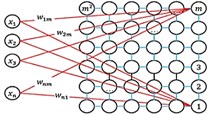
Self-organizing map (SOM) network is a kind of competitive artificial neural network that is suitable for data clustering [5]. The SOM network combines an input layer with a competitive layer of processing neurons, which typically organized as a two-dimensional grid. The structure of the SOM network is shown in Fig. 8. As shown in Fig. 8, the SOM network is an array of processing neurons, which maps high dimensional input vectors onto a two-dimensional surface, in which each neuron is represented by one-dimensional weight vector. Neurons of the map are connected to adjacent neurons by a neighborhood relation, which indicates the topology of the map.
The weight vector is enhanced during training procedure by the learning rule:
where is the weight vector, , the learning rate of SOM network, , the neighborhood function determined by the distance between the Best Matching Unit (BMU) and the neighbor neurons.
All the neurons are grouped in clusters by their distances through the training process, which form a new kind of topology structure. After that, each group of test data inputted to the well-trained SOM can match with a BMU. Finally, the Minimum Quantization Error (MQE) can be obtained by calculating the Euclidean distance between the BMU and the real-time measurement data.
According to the principles of SOM, the normal signals with similar features as the training dataset will gather around the normal cluster, which should have a minimum value of MQE. Along with the structural health state degradation of a panel area, its features from the vibration signal turn to be more and more different from those of the normal condition. Accordingly, the values of MQEs will have an increasing trend over time as the structural health state of a panel deteriorates.
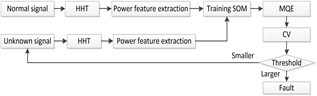
Above all, the Power feature extraction and health assessment process based on SOM neural network can be visualized as Fig. 9.
Fig. 9The process of health assessment based on SOM
In this study, the confidence value (CV), which can be formulated as below, is used to represent the structural health state of a panel area:
where, is a scale parameter determined by the averaged MQE under normal conditions and the corresponding CV, and the MQE is generated by using the online input measurement data, which will be normalized into the CV ranging from 0 to 1. It can be clearly seen that the CV is inverse proportional to the MQE, meaning that worse structural health state generates a higher MQE and a lower CV.
As discussed, in instead of failing suddenly, most mechanical system components usually undergo gradual degradation processes up until the time they fail, or scheduled to be replaced. If a component’s degrading state is continuously examined, a structural performance state indicator (CV) curve can be obtained as shown in Fig. 10.
Fig. 10Different structural performance states during the life cycle
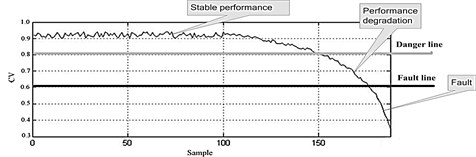
The CV ranges between 0 (unacceptable) and 1 (normal). Incremental changes in the CV are indicative of a gradual degradation process. No matter what type of degradation pattern the component goes through before it fails, the CV is always initially stable (in the range of 0.9 to 1.0). When an incipient fault occurs, the CV will show a decreasing trend. After the initial fault propagates to a severe level, and the component is close to failure, the decrease in the CV becomes more obvious and quickly drops to 0. Once the CV drops below the predetermined threshold, we can judge that certain fault occurs.
The SOM-based health assessment method can realize an online health assessment for the panel, using only the dataset under normal condition. The proposed method has no requirements on the full life cycle of structural performance degradation dataset.
5. Experimental verification
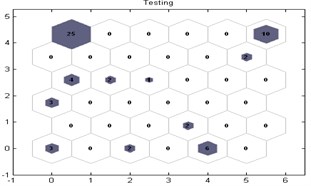
In this experiment, the power feature vectors of 60 groups of normal data were used to train a SOM for establishing the health assessment model. For model verification, 30 groups of normal data and 30 groups of faulty data were taken and sequentially imported into the trained SOM-based health assessment model. The SOM topology graph of the model training process is shown in Fig. 11, as well as the model testing one shown in Fig. 12. And then, the panel structural health assessment result is shown in Fig. 13.
Fig. 11SOM topology of model training process
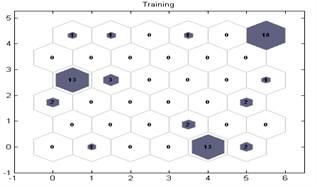
Fig. 12SOM topology of model testing process
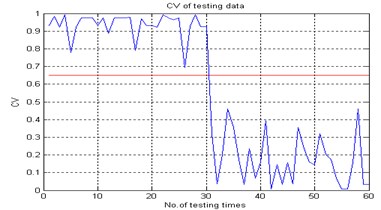
The structural performance degradation is clearly shown. An appropriate threshold should be pre-determined to indicate the degradation of structural health state, and it is set as 0.65 according to previous experience. The CVs of the first 30 samples, collected from the normal data, are highly above the predetermined failure threshold, which shows a stable health state. However, the other CVs from the faulty data are below the threshold. Thus, it is distinctly proved that the health assessment can be achieved based on SOM algorithm by using CV.
Fig. 13The health assessment result by CV of the test model
In summary, it has been seen that the corresponding power features extracted from the panel PZT data are available for health monitoring. Moreover, the proposed SOM-based health assessment method has no dependencies on failure samples or structural performance degradation data for its model establishment, and could be more pragmatic for practical applications.
6. Conclusions
This paper proposed an aircraft structural health assessment scheme based on power characteristics of PZT signals. The HHT algorithm is employed to calculate the power characteristic vector, after that, the SOM is used to map the corresponding characteristics into a confidence value (CV) which represents the health state of the monitored structure. The experiment results demonstrate that the proposed method is reliable.
The SHM technique, as a new concept that concerns the safety running of the aircraft, has been adopted by more and more research institutes. Although it is on the way of developing from a conceptual model to a prototype system, but the current situation is still far from practicability. Thus, further reach must be carried out on the theory of SHM, as well as the technique development and the project application.
References
-
Zetao Xiong, Lei Qiu, Bin Liu The prognostic and health management of aircraft structure and its key technologies. Measurement and Control Technology, Vol. 31, 2012, p. 198-201.
-
Lei Qiu, Shenfang Yuan, Qiang Wang Research and application of an integrated health monitoring scanning system based on PZT sensor array. Measurement and Control Technology, Vol. 27, 2008, p. 218-222.
-
Dejie Yu, Junsheng Cheng, Yu Yang Hilbert-Huang Transform Method for Machinery Fault Diagnosis. Beijing, Science Press, 2006.
-
Cheng J. S., Yu D. J., Tang J. S., Yang Y. Application of SVM and SVD technique based on EMD to the fault diagnosis of the rotating machinery. Shock and Vibration, Vol. 16, 2009, p. 89-98.
-
Kumar K. P., Rao K. V. N. S., Krishna K. R., Theja B. Neural network based vibration analysis with novelty in data detection for a large steam turbine. Shock and Vibration, Vol. 19, 2012, p. 25-35.
About this article

