Abstract
Long wavelength track irregularities are the key factors which influence vehicle stability and comfort. An on-line monitoring method is proposed to detect the vertical long wavelength track irregularities based on bogie pitch rate. Firstly, the principle of on-line monitoring method based on bogie pitch rate was presented. Secondly, to process bogie pitch rate, a mix-filtering approach which contains double integration, baseline correction and RLS (Recursive Least Squares) adaptive compensation filter was proposed. Thirdly, a coupling dynamics model of vertical vehicle-track interactions was developed to obtain bogie pitch rate. The obtained bogie pitch rate was then filtered with the mix-filtering approach. When the processed result compares with the actual irregularities, the Standard Deviation is 0.327 mm and the Normalized Mean Square Error is –9.1495. The experimental result shows that the proposed on-line monitoring method based on bogie pitch rate and signal processing approach are capable of monitoring the long wavelength track irregularities accurately and effectively.
1. Introduction
Track irregularities are track defects in geometry which caused by continuous wheel rail contact force and the deterioration of rail or sleeper. It will influence the stability, comfort, wheel rail service life and even operational safety of rail transit [1]. Track irregularities can be divided into long wavelength irregularities and short wavelength irregularities in terms of wavelength, and the long wavelength track irregularities are the key factors which influence vehicle stability and comfort. Effective detection of the long wavelength track irregularities has great significance to railway operation.
Track irregularities are usually measured in displacement by a trolley measurement system that uses acceleration sensors with contact probes during maintenance work [2]. The contact probes have a speed limit during the measurement, so that this method can hardly be used to measure the long wavelength irregularities. Another method is adding testing equipment on the bottom of track inspection vehicle to record track irregularities after track inspection vehicle running through [3]. The purchase and maintenance costs of track inspection car are high, and due to the needing for specialized schedule, it cannot realize monitoring the track condition in time. On-line monitoring track irregularities from an in-service vehicle allows for continual track monitoring so that both sudden and longer-term changes in track geometry can be detected [4-7]. This provides the possibility of timely maintenance intervention, avoiding the need for more extensive maintenance at a later date, and allows degradation to be tracked.
This article aims to propose the use of a bogie-mounted pitch-rate gyro to detect vertical long wavelength track irregularities. Using this sensor alone provides a large amount of advantages such as low cost and a good engineering applicability.
2. Principle of on-line monitoring
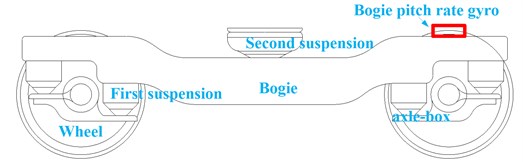
Gyroscope are widely used so that on-line monitoring of track irregularities can be realized by detecting bogie pitch rate. A bogie pitch gyroscope are mounted on an operational vehicle as shown in Fig. 1. The gyro is located above axle-box. And that mounting the sensor in the same location on the other side of bogie can constitute a whole system to monitor both left and right vertical track irregularities.
Fig. 1Mounting position of a bogie pitch gyroscope
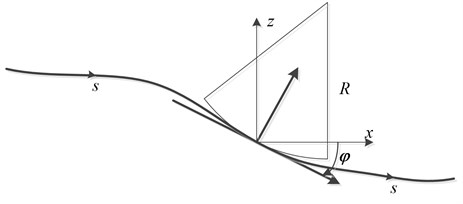
In Fig. 2, let a bogie pitch-rate gyro be oriented an angle velocity . If the pitch angle of the rate gyro is approximately equal to the pitch angle of the track, then an estimate for the corresponding vertical displacement is given by [7]:
where is displacement along the track (m), is pitch angle(rad), is vehicle speed along track (m/s), is the estimation of pitch-rate gyro-derived vertical position (m).
Fig. 2Wheelrail contact diagram
3. Mix-filtering approach for bogie mounted pitch rate
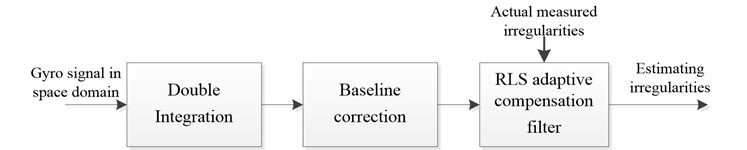
From Eq. (1) the vertical track irregularities can be estimated by double integration of the signal with respect to space domain. During the process of observation, the gyroscope output contains two types of errors which will influence irregularity estimation. One is Gaussian noise caused by environment vibration or electromagnetic radiation. The other is installation error caused by the sensitive axis of sensor not completely perpendicular to the plane of the train running line. Installation error is a constant proportion. Taking the bogie pitch observation error and the sensor signal characteristics into account, a mix-filtering approach for processing gyro signal is proposed to estimate track irregularities as shown in Fig. 3. This mix-filtering approach use bogie pitch gyro signal in space domain as input. Gyro signal in space domain can be obtained by gyro signal in time domain divided by vehicle speed. It contains 3 steps including double integration, baseline correction and RLS adaptive compensation filter.
Step 1. Double integration filter.
There are methods, such as immediate integration, frequency conversion method and filter method etc., to realize signal integration. the filter method can realize continuous calculatio so that, the filter method is chosen. Transfer function of double integral filter derived by the rectangular integration as below:
where and are spatial interval of th, th and th sampling points, respectively.
Fig. 3Mix-filtering approach
Step 2. Baseline correction.
Although integration filter process seems to be straightforward, some difficulties must be corrected to avoid results distortion. These difficulties are a reduction of high-frequency contents of the waveform, an amplification of low frequencies and a signal phase shift. The signal of pitch rate gyro contains observation noise σ, so that the numerical integration will produce a constant term (zero frequency term) and a linear term (second integration time), these trends items must be eliminated.
There are different methods used to improve velocity and displacement calculated diagrams such as high-pass filter method and wavelet transform method. A widely used technique is the so-called ‘baseline correction’ [5]. This procedure consists of defining a baseline function that fits the data of the diagram by least squares method. Initial condition zero velocity at initial instant must be satisfied. Chosen baseline function is a sixth degree polynomial. The recursive computation can be found in literature [5].
Step 3. RLS adaptive compensation filter.
It is well known that the relationship between bogie pitch rate and vertical track irregularities is dependent on the sensor installation error, rail elasticity change, wheel-rail contact relationship and suspension characteristics. In addition, a signal takes a certain amount of time to pass through a filter, which leads to a change in the transmission phase angle with respect to the frequency, called the phase delay. A compensation filter that uses a FIR (Finite Impulse Response) filter with M adjustable parameters is proposed. It is described as follows:
where is the transfer function of the compensation filter.
It is very difficult to identify these parameters by analytical methods because several different kinds of mechanisms are simultaneously involved. Instead of using analytic methods, an adaptive filtering method based on an RLS algorithm with the measured data is proposed. The recursive computation of the filter parameters can be found in literature [8].
4. Numerical simulation model
A coupling dynamics model [9] of vertical vehicle-track interactions is developed to obtain simulation data of bogie pitch rate. The model uses the actual measured long wavelength irregularities as excitation.
Fig. 4Coupling dynamics model of vertical vehicle-track interactions
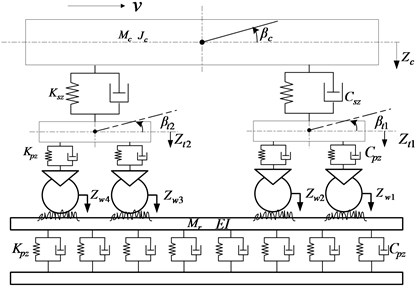
Fig. 5Actual measured long wavelength track irregularities: (a) space waveform; (b) power spectrum compared with high interference Germany track spectrum
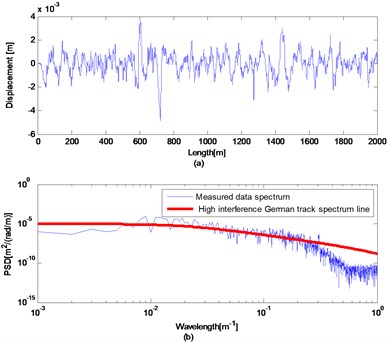
Fig. 4 illustrates the various components of the vehicle-track model in which subsystems describing the vehicle and the track are spatially coupled by the wheel-rail interface. By using the system of coordinates moving along the track with vehicle speed, the equations of motion of the vehicle subsystem can be derived according to D’Alembert’s principle, which can be described in the form of second-order differential equations in the time domain:
where is the mass matrix; and are the damping and the stiffness matrices which can depend on the current state to describe nonlinearities within the suspension; , and are the vectors of accelerations, velocities and displacements, respectively; is the system load vector representing the non-linear wheel-rail contact forces determined by the wheel–rail coupling model. The specific parameters see literature [9].
5. Experiment
In this section, the coupling dynamics model is excited by a segment of actual measured irregularities from high-speed rail in china. The obtained bogie pitch rate was filtered with mix-filtering approach and the result has been compared with the actual measured irregularities.
5.1. Data preparation
The track irregularities data is measured as a discrete sample sequence with 0.5 m intervals and the length of the data is 2 km. Fig. 5 plots the space waveform (a) and power spectra (b) of the measured data. The space waveform shows the amplitude of this segment irregularity data is less than 5 mm. Fig. 5(b) also plots the high interference German track spectrum line. By comparing with each other, this segment data contains irregularities of 6-300 m wavelength.
Coupling dynamics model has been numerically solved to obtain bogie pitch rate response by using actual measured long wavelength track irregularities as model excitation. Since the actual measured irregularities are discrete sample sequence with 0.5 m intervals, cubic spline interpolation has used for the data to obtain data with space step 0.001 m. During the process of simulation, the speed of train was set in 20 m/s, the size of space step 0.001 m, the iteration time 0.05 ms.
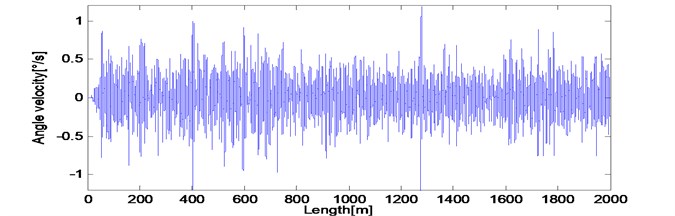
Fig. 6 shows the obtained bogie pitch rate . In this figure, bogie pitch rate responds in a range of 1 /s. Nowadays, the resolution of fiber optic gyroscope is less than 10 /h, which can up to (1-5) /h, so that it is able to meet the detecting requirements. The condition of simulation process is usually ideal, so the obtained bogie pitch rate data as shown in Fig. 6 has been multiplied by the coefficient 0.9 and added with a gauss noise sequence which variance 0.001 rad/s to simulate installation error and observation noise, respectively.
Fig. 6Bogie pitch rate βt1 response of actual measured long wavelength track irregularities
5.2. The mix-filtering of bogie pitch rate
Firstly, to convert into spatial domain, bogie pitch angular velocity was divided by the vehicle speed 20 m/s. Secondly, double integration filter was applied to obtain vertical track displacement. Then six degree of polynomial baseline correction iteration was applied to eliminate trends. In the processing of baseline correction, the number of calculating data 1000.
Results after the double integration filter and trends extracted by 6 degree polynomial correction are shown in Fig. 7(a). As we can see, polynomial baseline correction method eliminates most of the trends. Results after trends eliminated and the actual measured irregularities are shown in Fig. 7(b). To numerically evaluate the closeness of estimation between the filtered result and the actual displacement, we calculate SD (Standard Deviation) and NMSE (Normalized Mean Square Error). After double integration filter and six degree polynomial baseline correction, the SD = 0.856 mm, the NMSE = –0.8013. The filtered result has been close to the actual waveform, but still need compensated by compensation filter processing.
Fig. 7a) Results after double integral filter and trends extracted by 6 degree polynomial correction; b) The spatial irregularity waveform after six degree polynomial baseline correction compared with actual measured irregularities waveform
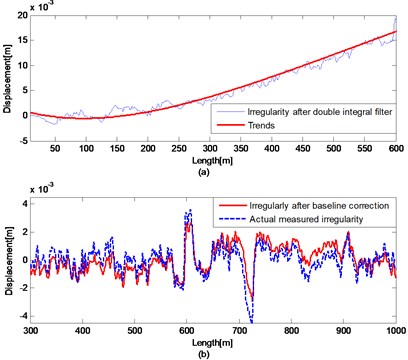
Fig. 8Results compared with actual measured irregularities a) Front 1 km during the iterative process; b) Last 1 km after compensation filter
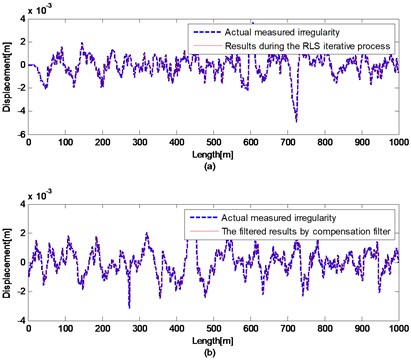
Spatial step of track irregularity data is 0.001 m and the actual effective wavelengths are longer than 3 m. Therefore, the built compensation filter has low-pass characteristic. In the processing of compensation, due to the filter length will affect the calculation speed of RLS adaptive algorithm, the number of adjustable parameters of the FIR filter model is set at 40. The parameter values are determined via recursive computation. The parameters are obtained from the RLS algorithm at the end of the front 1 km iteration and validated using last 1 km irregularity.
Results of the front 1 km during the iterative process and the actual waveform are shown in Fig. 8(a). The filtered results of last 1km by compensation filter and the actual waveform are shown in Fig. 8(b). After compensation filter, the SD = 0.327 mm, the NMSE = –9.1495. The filtered waveform in spatial domain is perfectly close to the actual waveform. The error between irregularity after baseline correction and the actual measured irregularities has been improved. Therefore, the irregularity obtained by filtering bogie pitch angular velocity with the mix-filtering approach reproduces the actual measured long wavelength track irregularities accurately and effectively.
In summary, after mix-filtering approach for bogie mounted pitch rate, the estimated track irregularities reproduce the long wavelength track irregularities accurately and effectively.
6. Conclusions
The use of a bogie-mounted pitch-rate gyro for detecting vertical long wavelength track irregularities was proposed. Using this sensor alone provides a large amount of advantages such as low cost and a good engineering applicability. A mix-filtering approach for bogie pitch rate was proposed. Coupling dynamics model of vertical vehicle-track interactions was developed to obtain simulation data of bogie pitch rate. The model uses actual measured irregularities as excitation. The obtained bogie pitch rate was filtered with mix-filtering approach. By comparing with the actual irregularities, the result shows the proposed bogie pitch rate based method and mix-filtering approach are capable of monitoring long wavelength track irregularities accurately and effectively. This method and mix-filtering approach are worth popularizing in engineering.
References
-
Shi Hongmei Research on intelligent sensing algorithm of track irregularity based on vehicle dynamic rsesponses. Beijing, Jiaotong University, 2012, (in Chinese).
-
Deshui Zhang Measurement of railway irregularities and signal processing. Shanghai Jiao Tong University, 2012, (in Chinese).
-
Molina L. F., Resendiz E., Edwards J. R., et al. Condition monitoring of railway turnouts and other track components using machine vision. Transportation Research Board 90th Annual Meeting, 2011.
-
Gilbert D., Wesley P. D. Track monitoring equipment. EU pat. EP1180175, 2002.
-
Real J., Salvador P., Montalbán L., Bueno M. Determination of rail vertical profile through inertial methods. Proceedings of the Institution of Mechanical Engineers, Part F: Journal of Rail and Rapid Transit, 2010, p. 14-23.
-
Lee J. S., Choi S., Kim S. S., et al. A mixed filtering approach for track condition monitoring using accelerometers on the axle box and bogie. IEEE Transactions on Instrumentation and Measurement, Vol. 61, Issue 3, 2012, p. 749-758.
-
Weston P. F. Monitoring vertical track irregularity from in-service railway vehicles. Journal of Rail and Rapid Transit, Vol. 221, Issue 1 2007, p. 75-88.
-
Zhang Linghua, Zheng Bayou Random Signal Processing. Beijing, Tsinghua University press, 2003, (in Chinese).
-
Zhai W., Wang K., Cai C. Fundamentals of vehicle–track coupled dynamics. Vehicle System Dynamics, Vol. 47, Issue 11, 2009.
About this article

