Abstract
This paper firstly introduces a locally stationary model to analyze non-stationary environmental vibrations during a rocket launch. Then based on this model, a novel method is proposed to estimate the upper tolerance limit of expected non-stationary environmental vibrations, which can be used to evaluate whether equipments on rocket can experience environmental vibrations in safe. Compared with available method, the proposed method can characterize non-stationary vibration better.
1. Introduction
Vibration has very important impact on rockets. It may cause fatigue and wear of structures, assemblies or parts. Therefore environment vibration simulation and test are conducted in the lab to investigate its impact. For stationary random vibrations, data processing and test methods are well defined in relevant standards [1, 2]. However, for non-stationary random vibration, there is no such relevant norm. It has been shown that vibration simulations which do not take into account non-stationary vibrations, fail to expose the product under test to appropriate vibration levels that may occurred on the field [3]. A rocket during lift-off often suffers non-stationary random vibration, whose magnitude is double or triples of that in other stages. Recently more attentions have been attracted to non-stationary vibration processes, and various methods have been proposed to test or simulate them well [3-6]. Allan G. Piersol uses maximax spectrum to characterize non-stationary random vibration signals, which is the peak value across each frequency resolution during the non-stationary event [2, 7]. However using this power spectrum density method cannot characterize non-stationary random processes sufficiently, as this method basically comes from counterpart for stationary random processes. Similar problem occurs with Huang’s work, as power spectrum density used was originally targeted to stationary random signals [8]. More details about constraints of power spectrum density methods (backed by Fourier transform) can be found in [9].
Upper tolerance limit of vibration is of special importance, as it provides a conservative margin to design and test. A popular method used to estimate this metric is the “enveloping scheme” [10], but this procedure depends on the subjective judgment of engineers.
To overcome above constraints, this paper proposes a wavelet analysis method, which can separate non-stationary deterministic signal and stationary random noise from a vibration signal. Following wavelet analysis, a novel method is proposed to estimate upper tolerance limit with specific confidence and probability. This upper tolerance limit can be used as a marginal allowance for vibrations a rocket can endure in safe.
This paper is organized as the following: Section 1 gives a brief introduction. Section 2 proposes a “locally stationary” model to analyze non-stationary random vibrations for a rocket during lift-off, where wavelet analysis is used to separate the non-stationary vibration signal into two portions: the deterministic potion and the random portion. Section 3 introduces a novel method to estimate upper tolerance limit. Section 4 validates the effectiveness of the proposed approach. Section 5 concludes this paper.
2. Locally stationary model for non-stationary vibration analysis
A typical vibration history during a rocket launch is recorded as in Fig. 1. It can be observed that it has large vibration magnitude, short duration and no much number of samples. These characters make it difficult to analyze its dynamic characteristics.
Fig. 1Typical acceleration time history of a rocket during launch stage
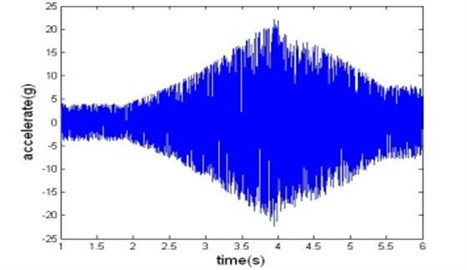
To overcome this difficulty, a “locally stationary” model is adopted for analysis of non-stationary launch rocket vibration data, which allows the computation of a time-varying spectrum to be decomposed into two separate portions, one defining the time-varying mean square value of the signal, and the other defining the spectrum of the signal. Assuming is the sample function of non-stationary launch rocket vibration data, it can be written as [1]:
In the above formulation, represents the stationary portion or the random noise vibration, and represents the non-stationary portion or the time-varying deterministic envelope function. Frequency of is far below that of .
The power spectral density function of can be formulated as [13]:
where is the auto-correlation of .
A typical vibration data sequence acquired during a rocket launch is shown in Fig. 1. Applying wavelet analysis, deterministic vibration portion and random vibration portion can be separated; the procedure used is composed of the following steps:
1) Formulate measured data as Eq. (1).
2) Apply logarithm operation on :
3) Apply Daubechie wavelet db3 analysis on . Totally six-level decompositions are conducted. At each level, the low frequency portion of the previous level is decomposed into low frequency portion and high frequency portion of current level. As the level increases, time resolution is halved (only half number of samples resulted), and frequency resolution is doubled (the spanned frequency band halved). Decomposition results are shown in Fig. 2.
4) Reconstruct the low frequency portion , and then apply inverse logarithm transform, deterministic signal can be obtained as shown in Fig. 3.
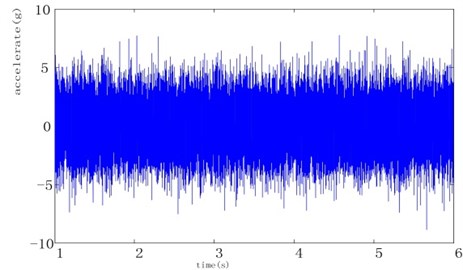
5) Similarly the signal’s random portion can be reconstructed as shown in Fig. 4.
Fig. 2Wavelet analysis of the vibration accelerations
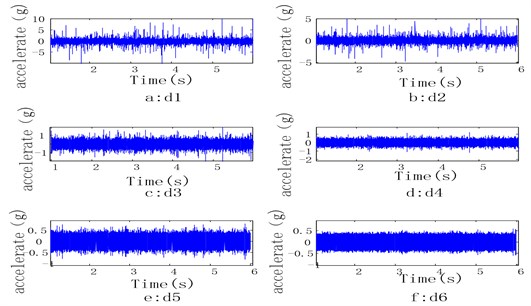
Fig. 3Deterministic signal separated
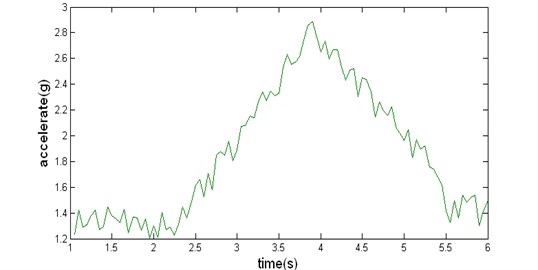
Fig. 4Random noise synthesized
3. Upper tolerance limit for any normal random variable
As measured vibration data for one rocket launch, do not reflect the potential fight-to-fight variations that occur in service use, it is necessary to conduct statistical analysis. Among multi possible statistical metrics, one-side upper tolerance limit is of special importance, because it sets the marginal allowance for vibrations a rocket can endure.
Assuming any random variable , its upper tolerance limit () with given probability can be written as:
where is the fractile of the normal distribution, i.e., . As and are unknown, the upper limit of the random variable with a given probability cannot be obtained easily.
Assuming measurements are available, estimation for can be given by:
And the unbiased estimation for the true standard deviation can be given by:
If the upper limit of random variable with a certain probability can be derived by and of the samples, then the tolerance upper limit of the random variable has form like . The upper limit of random variable with probability has a confidence can be interpreted as:
where is the upper tolerance limit coefficient. This equation will be applied to both and of , as both of them conform normal distributions [1].
The one-sided upper tolerance limit coefficients are summarized in Table 1 for different , and combination [1].
Table 1Tolerance coefficient K for upper tolerance limit
0.90 and 0.5 | 0.99 and 0.9 | |
3 | 1.50 | 7.34 |
4 | 1.42 | 5.44 |
5 | 1.38 | 4.67 |
6 | 1.36 | 4.24 |
10 | 1.32 | 3.53 |
20 | 1.3 | 3.05 |
50 | 1.29 | 2.74 |
∞ | 1.28 | 2.33 |
4. Experiment results and analysis
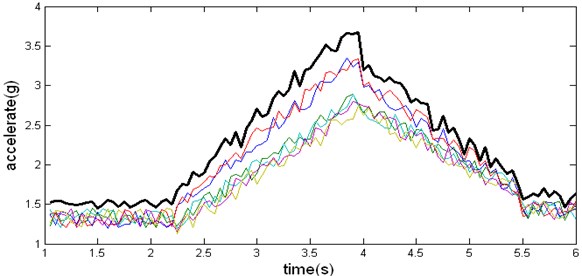
In this section, vibration data of six rockets during launch stage are collected. Applying wavelet method described in Section 2 on each launch data, deterministic portion and stationary portion can be separated. Fourier transform are then applied on (the auto-correlation of ), and then the power spectrum density can be calculated using Eq. (2), with each power spectrum density chart marked with a specific color as shown in Fig. 5. Taking 4.24 from Table 1 (a combination of 4.24, 0.99 and 0.9), and using Eq. (7), the upper tolerance limit at each frequency resolution point can be calculated. Therefore an upper tolerance chart can be gotten, and marked in bold in Fig. 5. Using similar method, but directly to deterministic portion at each sampling point, corresponding upper tolerance limit can be calculated, and marked in bold in Fig. 6.
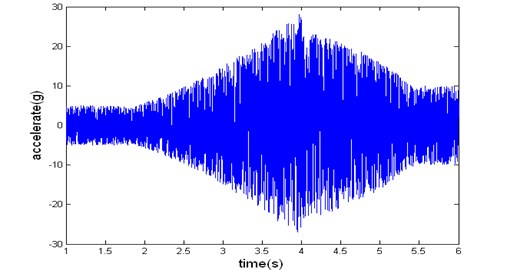
Taking the bold chart from Fig. 5 and Fig. 6 respectively and using Eq. (2), upper tolerance limit for time-varying power spectrum density during launch stage can be calculated. To reconstruct vibration corresponding to this upper tolerance limit, two steps are needed:
1) Apply inverse Fourier transform on the square root of the upper limit chart in Fig. 5, then its corresponding stationary random vibration can be obtained.
2) The non-stationary vibration history can be obtained using Eq. (1), and the result is shown in Fig. 7.
Fig. 5Power spectrums density of u(t) and their upper tolerance limit
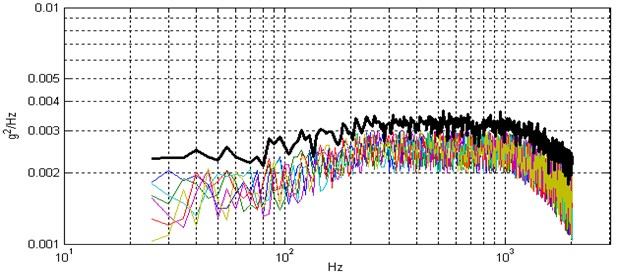
Fig. 6x(t) and their upper tolerance limit
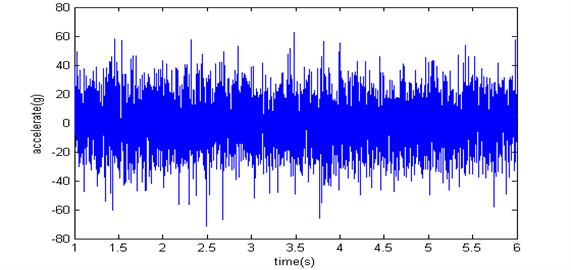
As a comparison to the popular method described in literature [2], the maximax spectrum corresponding to the six launches can be calculated. Choosing the maximum one as the upper tolerance limit of vibration, the resulting vibration waveform is shown in Fig. 8. It can be seen that the shape of waveform in Fig. 7 conforms that of a typical non-stationary vibration as shown in Fig. 1; while the waveform in Fig. 8 does not. Therefore the effectiveness of our approach is validated.
Fig. 7Vibration synthesized using our method
Data corresponding to Fig. 7 or Fig. 8, can be fed into the SUPER Vibration Controller, therefore vibrations can be replicated in the lab.
Fig. 8Vibration synthesized using maximax spectrum
5. Conclusions
In this paper, a “locally stationary” model is used to analysis non-stationary random vibration during a rocket launch. Wavelet analysis technique is used to decompose the non-stationary vibration signal into stationary portion and deterministic portion. A novel method is proposed to estimate the upper tolerance limit of expected environmental vibrations. Effectiveness of the proposed method is validated.
References
-
MIL-STD-810F.Test method standard for environmental engineering considerations and laboratory tests.
-
Harry Himelblau,Allan G. Piersol Handbook for Dynamic Data Acquisition and Analysis. Institute of Environmental Sciences, 1993, p. 291.
-
Sek M. A. A modern technique of transportation simulation for package performance testing. Packaging Technology and Science November/December, Vol. 9, Issue 6, 1996, p. 327-343.
-
Rouillard V.,Sek M. A. Synthesizing non-Stationary, non-Gaussian Random Vibrations. Packaging Technology and Science December, Vol. 23, Issue 8, 2010, p. 423-439.
-
Van Baren P. The missing knob on your random vibration controller. Sound and Vibration, 2005, p. 2-7.
-
Smallwood D. O. Generating non-Gaussian vibration for testing purposes. Sound and Vibration, 2005, p. 18-24.
-
Allan G. Piersol Optimum data analysis procedures for TITAN IV and space shuttle payload acoustic measurements during lift-off. NASA-CR-190479, Pasadena, CA, Piersol Engineering Company, 1991.
-
Huang Huaide The Vibration Engineering. Beijing, China Astronautics Press, 1993, p. 152-153, (in Chinese).
-
Steinwolf A., Connon W. H. Limitations of the Fourier transform for describing test course profiles. Sound and Vibration, 2005, p. 12-17.
-
HB/Z87-84. The inductive methods for environmental measured data of aircraft during flight.
-
Robert X. Gao,Ruqiang Yan Wavelets: Theory and Applications for Manufacturing. Springer, 2011.
-
Hine M. J. Controlling Conservatism in Transient Vibration Testing. 15th Aerospace Testing Sem., 1995, p. 231-237.
-
Newland D. E. An Introduction to Random Vibrations and Spectral Analysis. Longman, 1975.
About this article

