Abstract
Despite a multitude of diagnostic methods, the industry standard RMS is still widely used. Paper presents work toward algorithmic implementation of velocity RMS measurement according to ISO 10816-3 standard. Different approaches are discussed, including those based on frequency spectra of raw vibration data. Considerations connected with problems specific to digital signals processing and implementation in embedded online monitoring systems are discussed. Case study shows performance of discussed algorithms on data collected during test of heavy duty gearbox. After comparison of algorithms results and their computational complexity, preferred algorithm to implement in real vibration monitoring system was chosen.
1. Introduction
Nowadays significant progress in vibration signal analysis techniques used for condition monitoring is observed. There are several important research works in the area [1-3]. Important field are heavy machinery in mining industry [4]. Recently, strong focus is on monitoring machinery in varying operational conditions [5, 6]. For this reason, new methods are being developed for load modelling, e.g in the wind power field [7, 8]. Despite the fact, that advanced algorithms are more and more often implemented in condition monitoring solutions, still the most robust and popular method of evaluation of machine condition is trending of vibration velocity root mean square (VRMS). In industrial applications mentioned measurement is often performed according to international standard requirements [9, 10].
VRMS calculation algorithms are implemented on digital signals collected by complex online monitoring systems, very often installed on the machines that where tested by hand-held units during the quality control stage. This generates the need of reasonable comparison of those VRMS values measured by different systems [11]. Such a simple method has the advantage of being independent from the rotational speed measurement and thus, additional sensor. In most systems it is not an important issue, but becomes so in harsh conditions. It can be overcome by an algorithmic method [12], but requires additional computing power.
One of the solutions may be implementing an additional analog measurement path dedicated to this task, but it is economically unreasonable to install duplicate analog path dedicated to VRMS calculation in modern data collecting units which are dedicated to acquire digitalized vibration data record and store it in database. Moreover, in some cases, it is very complicated because of the technical restrictions – such as in the underground mining industry, due to the requirements of ATEX standard [13, 14].
There are a lot of approaches when it comes to calculate VRMS value from digital sampled vibration acceleration signal. Authors research shown that their results are not always comparable. Purpose of research outlined in this paper was to develop an algorithm that gives results comparable with dedicated measurement units, and has reasonable computation complexity. Main focus was on algorithms based on frequency domain band selection rather than time domain filtering. Reason for such approach was fact, that algorithm should utilize spectra which are nearly always calculated in modern condition monitoring systems [15]. Investigation conducted by authors showed that it may be beneficial in terms of processing unit resources management especially for embedded systems.
2. Time signal based approach
Standard way of performing vibration velocity RMS calculation is based on time signal. It involves numerical integration of acceleration, filtering by bandpass filter and calculating of the amplitude RMS value. As in vibration based condition monitoring in vast majority of the cases RMS value in 10-1000 Hz or 3-1000 Hz are considered, filtering of the signal makes detrending after integration not necessary. This algorithm reflects the behavior of analogue signal processing units dedicated to measure vibration velocity RMS.
3. Frequency spectra based approach
According to the Perseval theorem RMS value of a time signal can also be obtained in frequency domain. Such approach has some advantages especially when considering signal processing scheme in online monitoring systems, where many calculations are based on frequency spectra. It is reasonable to use that spectra not only to calculate GMF and shaft harmonics amplitudes, but also to obtain vibration velocity RMS value. Also filtering in frequency band of 10-1000 Hz is easy as it only involves taking into account bins which are in that frequency range.
Calculation of vibration velocity RMS in given frequency band can be accomplished in many ways. Most intuitive approach is taking acceleration time domain signal, perform integration, detrend integrated signal and then use windowing and zero padding before FFT. Then calculate the RMS value in band of interest from obtained spectra.
It is also possible to omit both time domain integration and detrending and derive velocity spectra directly from acceleration spectra.
3.1. Zero padding influence
Most of the implementations of the FFT algorithm indicate significantly better performance on signals of length being a power of two [16, 17]. Some of them – like popular implementation of FFT present in Intel’s IPP library – accept only input of that length [18]. Way to ensure that processed signal has that length is zero-padding, which involves appending zeroes to the signal. Additionally zero padding in the time domain corresponds to ideal interpolation in the frequency domain [16].
When calculating RMS of zero-padded signal it is important to notice that this is not RMS value of the original input, but RMS of zero-padded samples sequence. As the number of added zeroes increases overall RMS value decreases. RMS value drop dependency of number of appended zeroes can be derived and is described by Eq. (1):
where: – number of zeros appended to original signal, – number of samples in original signal.
3.2. Windowing influence
Windowing of the signal is performed to minimalize the spectral leakage and its principle is to minimize the transition edges on truncated part of signal. For vibration analysis in most of the cases Hanning window is used which is given by Eq. (2). As windowing function modifies the amplitudes of signal samples it is obvious that it also has influence on RMS value of such processed signal. This influence can be compensated by using the energy correction factor which for Hanning window equals :
3.3. Obtaining velocity spectra
There are two main paths to obtain velocity spectra from acceleration signal. First of them involves integration in time domain and performing FFT on integrated signal. Due to nature of numerical integration it is recommended to detrend integrated signal.
According to the theory of signal processing and properties of the Fourier transform it is possible to omit the time domain integration and detrending steps by obtaining velocity spectra from acceleration spectra directly in frequency domain using dependency form Eq. (3) [19, 20]:
From the theory of mathematical operations in time and frequency domain – integration in time domain equals division by frequency in frequency domain. For calculation of RMS value in given frequency band it can be performed only in the band of interest to save processing time.
4. Tested algorithms
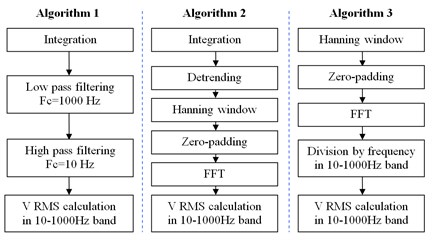
After examination of abovementioned considerations three algorithms where implemented and their performance was tested on signals collected during testing of heavy duty gearbox. Sequences of the algorithms are presented on Fig. 1. Algorithm 1 is typical time based approach with integration and filtering. Algorithm 2 uses time domain integration and filtration in frequency domain. Algorithm 3 performs all crucial operations in frequency domain – both with obtaining velocity from acceleration and filtration.
Algorithms 2 and 3 both used energy correction factor of ~1.63 to compensate influence of Hanning window and additional correction factor for zero-padding derived according to paragraph 3.1.
Justification of such configuration of tested algorithms was to compare outputs of different approaches and their computational complexity in context of incorporating algorithms in embedded vibration monitoring system.
Fig. 1Sequences of three tested algorithms

5. Case study on real vibration data
Algorithms assessment was conducted by calculating VRMS estimate for data collected during industrial testing of heavy duty gearbox for different operating conditions. Calculations were performed for segments of lengths of 1 [s], 5 [s] and 10 [s] on data sampled at 25600 [Hz]. All three algorithms indicated the same levels of velocity RMS with slight differences caused by nature of digital signals processing. Fig. 2 shows comparison of results for different operating conditions for one of the vibration channels.
Fig. 2Results obtained for tested algorithms for one of the collected channels. Data block length equal to 1 [s]
![Results obtained for tested algorithms for one of the collected channels. Data block length equal to 1 [s]](https://static-01.extrica.com/articles/15453/15453-img2.jpg)
As an additional test for one period of gearbox test additionally VRMS value was acquired using dedicated VRMS measurement chain of industry standard equipment – VibXpert II. Readings from VibXpert II collected near one of the measurement points of data acquisition system where compared and treated as a reference value to output of tested algorithms performed on the corresponding channel. Results of that analysis are shown on Table 1. It can be seen, that Algorithm 1 – time based approach – shows less spread of values. All algorithms did not show any disturbances connected with digital processing.
Table 1Results comparison for measurement taken by VibXpert II and output of discussed algorithms
Mean [mm/s] | Min [mm/s] | Max [mm/s] | |
VibXpert II | 3.04 | 2.96 | 3.08 |
Algorithm 1 | 3.02 | 2.94 | 3.02 |
Algorithm 2 | 3.13 | 3.01 | 3.13 |
Algorithm 3 | 3.13 | 3.01 | 3.13 |
6. Computational complexity
Essential requirement for embedded real time systems dedicated for vibration monitoring is their reliability and stability of performance independently of operating and environmental conditions. It is especially important in systems of compact design and limited possibilities of application of active cooling, for example condition monitoring system dedicated to shearer loader, where all modules are encapsulated in fire-proof enclosure. ATEX requirements present in mining industry additionally restrict the power consumed by units and generated heat.
To deal with abovementioned problems significant effort is put not only on hardware but also on software design and optimization. From vibration monitoring systems perspective it involves proper structuring of analysis blocks and optimization of their computational complexity.
As all three algorithms proved their usability, they were additionally tested in terms of computational complexity. Main purpose of this comparison was selection of algorithm to implement in condition monitoring systems dedicated to mining machinery.
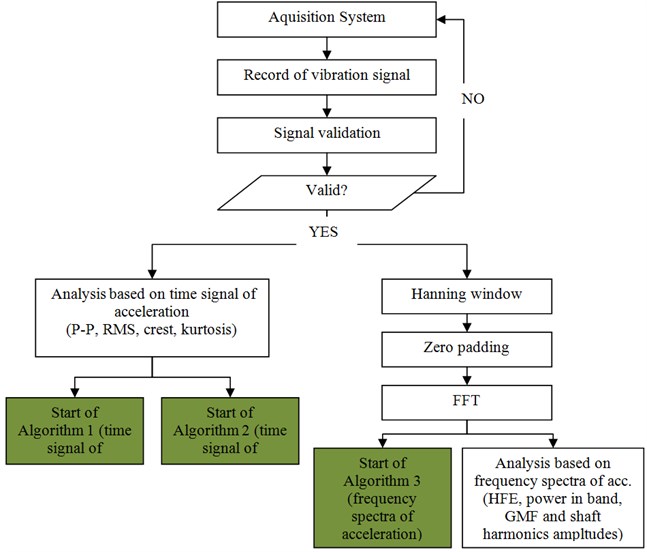
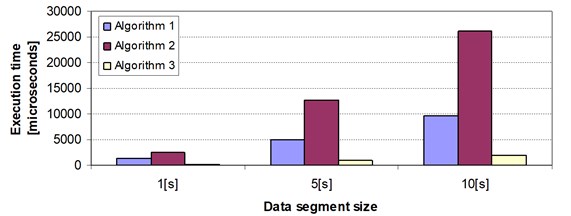
Analysis flow scheme used in the system is presented on Fig. 3 with computational complexity comparison on Fig. 4. There are two main blocks: analysis based on time signal of acceleration and analysis based on frequency spectra of acceleration. With green color there are marked places where algorithms discussed in section 4 should start. One could see that algorithm 1 and 2 are extra added and they have to be calculated based on raw time signal, and algorithm 3 is based on frequency spectra which is calculated anyway. The fact of frequency spectra reuse was taken into account with Algorithm 3 execution time calculation and only sequences placed after FFT where considered.
Fig. 3General sequence of calculation with location of discussed algorithms

Fig. 4Relative comparison of execution time of tested algorithms for different data block sizes

7. Conclusions
Despite significant progress in areas connected with advanced vibration analysis methods, trending of VRMS is still the most robust and compliant with industrial standards. This makes implementing this estimate in online monitoring systems obligatory.
For embedded systems where CPU resources are limited and additional heat generation requirements are present it is critical to use robust algorithms – like Algorithm 3 presented in this paper combined with overall analysis flow of developed monitoring system.
As velocity vibration RMS value is always displayed on visualization accessible for staff and clients it is desirable to validate the measurement and calculation method in way ensuring stable and reliable results. This may save confusion connected with RMS value drifts caused by improper structuring of algorithm.
It is recommended when using frequency domain based calculation to compensate the zero padding and windowing effects by proper coefficients. This enables to directly compare calculated RMS levels used in online monitoring system with popular analog hand-held devices.
Signal manipulation presented in best performing Algorithm 3 is a part of patented method of obtaining vibration velocity RMS for condition monitoring purposes [21].
References
-
Nembhard A. D., Sinha J. K., Elbhbah K., Pinkerton A. J. Fault diagnosis of rotating machines using vibration and bearing temperature measurements. Diagnostyka, Vol. 14, Issue 3, 2013, p. 45-52.
-
Tabaszewski M. Optimization of a nearest neighbours classifier for diagnosis of condition of rolling bearings. Diagnostyka, Vol. 15. Issue 1, 2014, p. 37-42.
-
Astolfi D., Castellani F., Terzi L. Fault prevention and diagnosis through SCADA temperature data analysis of an onshore wind farm. Diagnostyka, Vol. 15, Issue 2, 2014, p. 71-78.
-
Dybała J., Zimroz R. Empirical mode decomposition of vibration signal for detection of local disturbances in planetary gearbox used in heavy machinery system. Key Engineering Materials, Vol. 588, 2014, p. 109-116.
-
Bartelmus W., Zimroz R. A new feature for monitoring the condition of gearboxes in non-stationary operating conditions. Mechanical Systems and Signal Processing, Vol. 23, Issue 5, 2009, p. 1528-1534.
-
Wyłomańska A., Zimroz R. Signal segmentation for operational regimes detection of heavy duty mining mobile machines - A statistical approach. Diagnostyka, Vol. 15, Issue 2, 2014, p. 33-42.
-
Barszcz T., Bielecka M., Bielecki A., Wójcik M. Wind speed modelling using Weierstrass function fitted by a genetic algorithm. Journal of Wind Engineering and Industrial Aerodynamics, Vol. 109, 2012, p. 68-78.
-
Bielecki A., Barszcz T., Wójcik M. Modelling of a chaotic load of wind turbines drivetrain. Mechanical Systems and Signal Processing, in press.
-
International Standard ISO 10816-3:2009. Mechanical vibration – Evaluation of machine vibration by measurements on non-rotating parts – Part 3: Industrial machines with nominal power above 15 kW and nominal speeds between 120 r/min and 15 000 r/min when measured in situ.
-
Robichaud J. Michael Reference Standards for Vibration Monitoring and Analysis. Reference from Bretech Engineering Ltd., 2004.
-
Lee G. Taking Accurate Vibration Measurements. Maintenance Technology, Vol. 17, Vol. 6, 2004, p. 43-46.
-
Urbanek J., Barszcz T., Antoni J. A two-step procedure for estimation of instantaneous rotational speed with large fluctuations. Mechanical Systems and Signal Processing, Vol. 38, Issue 1, 2013, p. 96-102.
-
Kępski P., Barszcz T. Application of vibration monitoring for mining machinery in varying operational conditions. Condition Monitoring of Machinery in Non-Stationary Operations, 2012, p. 461-469.
-
Greń B., Kępski P., Barszcz T. Challenges in maintenance of vibration monitoring systems dedicated to underground mining machinery. Diagnostyka, 2012, p. 13-18.
-
Lim W. Q., et al. Vibration-based fault diagnostic platform for rotary machines. Proceedings of 36th Annual Conference on IEEE Industrial Electronics Society, 2010, p. 1404-1409.
-
Smith J. O. Mathematics of the Discrete Fourier Transform (DFT). W3K Publishing, 2003.
-
Shin K., Hammond J. K. Fundamentals of signal processing for sound and vibration engineers. Chichester, UK, Wiley, 2008.
-
Intel Corporation. Intel ® Integrated Performance Primitives Reference Manual, Volume 1: Signal Processing, IPP 7.1.
-
Worden K. Data processing and experiment design for the restoring force surface method, part I: integration and differentiation of measured time data. Mechanical Systems and Signal Processing, Vol. 4, Issue 4, 1990, p. 295-319.
-
McClellan J. H., Schafer R. H., Yoder M. A. Signal Processing First. Pearson International Edition, 2003.
-
Polish Patent Office Bulletin, No. 5 (1048), 2014.
