Abstract
In order to explore the prediction of the operation vibration state of coal mine mechatronics equipment, the author proposes a method based on data mining in response to the problems of large amount of data in the operating state of coal mine electromechanical equipment, low data utilization, and slow speed of single-machine massive data mining, using Map Reduce technology, a dual Map Reduce mining prediction framework is proposed, establish a data mining prediction model for the running state of dual Map Reduce, using MapReduce1 to extract features of monitoring data, use MapReduce2 to predict and analyze feature data. Finally, by building the Hadoop platform, reveal the relationship between Hadoop cluster nodes and parallel processing speed, the efficiency of the data mining prediction framework is verified: Perform an experimental comparative analysis of the single prediction model and the proposed AGB combined prediction model, the prediction accuracy of the AGB combined prediction model is verified.
Highlights
- Automatic extraction of knowledge and rules for generating the real time monitoring data which estimates the prediction of upcoming process.
- A method based on data mining in response to the problems of large amount of data in the operating state of coal mine electromechanical equipment, low data utilization, and slow speed of single-machine massive data mining, using Map Reduce technology.
- It establish a data mining prediction model for the running state of dual Map Reduce, using MapReduce1 to extract features of monitoring data, use MapReduce to predict and analyze feature data.
- Built a Hadoop platform, reveal the relationship between Hadoop cluster nodes and parallel processing speed, the efficiency of the data mining prediction framework is verified.
1. Introduction
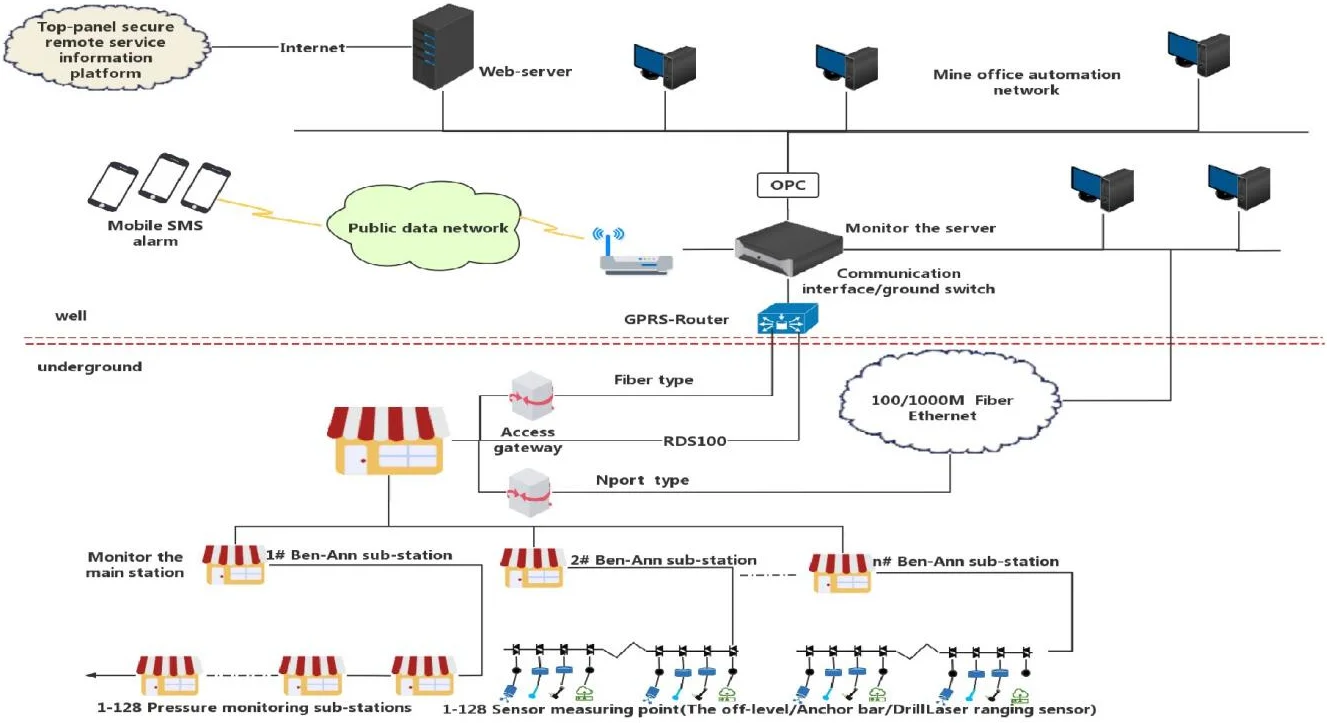
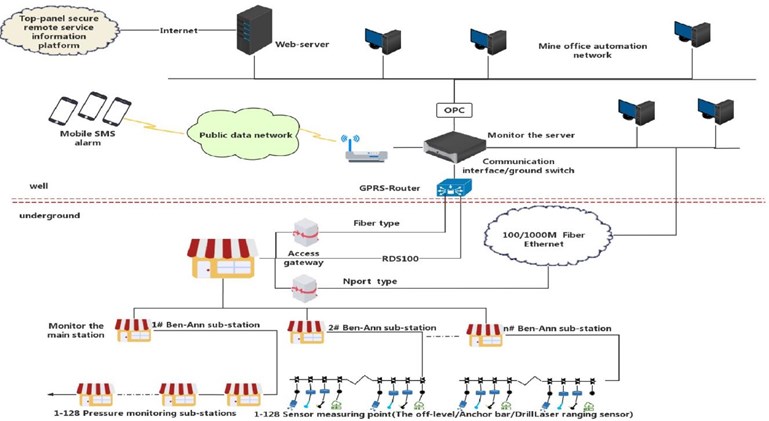
Since the mid-1980s, various types of coal mine monitoring systems have been installed in various large and medium-sized mines in China, in this way, the concentration of methane (gas) and CO, wind speed, environmental parameters such as air volume and dust, as well as voltage, current, the operating conditions such as the opening and closing of the air door and the opening and stopping of important equipment are monitored and simply controlled [1]. With the development of information technology and computer network technology, use the existing coal mine monitoring system and the company’s internal information network, realize the real-time transmission of monitoring information on INTRANET/INTERNET, and use database and data warehouse technology to save effective data on the local server, so in addition to the dispatching rooms of the bureau, mine, and well, provide real-time relevant underground dynamic working condition information for authorized institutions at all levels, and send the information to the remote service center through INTERNET, information is processed by different tools, in order to provide good decision support information. However, the production process control of the coal mine industry is a very special field, there are hundreds of monitoring points arranged by various coal mining enterprises, there are a lot of data collected and accumulated by each monitoring point year after year, it is generally difficult for humans to understand these data and their relationships, not to mention the timely summary and prediction [2]. As shown in Fig. 1, if the computer can automatically extract knowledge or rules from the generated data in real-time, and use the acquired knowledge to estimate and predict the upcoming process, or based on the acquired knowledge to correct the deviation process in real-time, this is a subject waiting to be resolved, it is difficult to solve such problems with traditional monitoring system alone [3]. Now the whole society in the big era has been fully covered by the concept of big data, as the pillar of China’s basic economic strength, the coal production industry, is also inseparable from the profound influence of the Internet and informatization, it is changing from traditional operation mode to modern technology construction.
Fig. 1Operation of mechatronics equipment
This article contributes in automatic extraction of knowledge and rules for generating the real time monitoring data which estimates the prediction of upcoming process. Many hardware and software in the coal mine industry are constantly being updated in the direction of intelligence and automation, and ecological development of the entire coal production industry, it is also constantly changing under the many innovative applications and service models spawned by big data. In the coal industry, big data is increasingly becoming a key basis for safe production and business decision-making. The information and data resources in the self-provided system of coal mining enterprises are shared by mining technology, and collect and process various hidden danger data in the production process of coal mines. It is predicted from several studies that due to the emergence of big data technology, there will be greater flexibility and lower costs to deal with enterprise security management [4].
The rest of this article is organized as Section 2 discussing the literature review. Overview of map reduce is provided in Section 3 followed by experimental results and analysis in Section 4. Section 5 presents the conclusion of this article.
2. Literature review
Xia et al. [5], proposed a random process and estimation theory based on probability, the research done by these pioneers provides ideas and directions for the future development of prediction technology, laid the theoretical foundation. According to the characteristics of the wind speed sequence in the wind farm, a wind speed prediction model for wind farms based on time series analysis is proposed [6]. In the study of earthquake prediction by Novoselov and Gufeld [7], using principal component analysis, to simplify the forecasting parameters, proved its good application prospects in earthquake prediction. Gholizadeh et al. [8], established three prediction models based on fuzzy theory in the research process: Fuzzy exponential smoothing method, fuzzy linear regression method and fuzzy cluster forecasting method, predict the medium and long-term load in the power system, the results show that the three models have better prediction effects than traditional methods. Burgess-Limerick et al. established a model using gray theory, and use this model in the detection of the input signal of the integrator of the voltage-controlled oscillator circuit of a certain type of transmission control equipment, it is proved that the gray theory is feasible for predicting the health status of electronic systems [9]; Grishchenko et al. [10] proposed an adaptive GM(1, 1) model based on gray theory, it is used to solve the problem of excessive interval in the prediction of wind speed and wind turbine output power by the traditional GM(1, 1) model; Yilmaz [11] used the neural network method to better reflect the relationship between the development trend of the actual working status and the status signal, for multi-parameter, multi-step prediction, strong dynamic adaptability, suitable for nonlinear complex systems and other characteristics, in wind speed prediction, power consumption prediction, power station boiler operation performance prediction, neural network theory is used in the short-term prediction of heating network heating. Seera et al. [12], using expert systems, considering more factors, makes the prediction accuracy of the power system load higher, it is more suitable for actual production needs. Wang et al. [13], uses a genetic algorithm-based forecasting model to predict the financial crisis of listed companies, and through examples, it is proved that the prediction accuracy of this algorithm is higher than that of Logistic and BP neural network models. Faradonbeh et al. [14], are based on agent prediction technology, proposed a brand-new use of multi-agent system to predict stocks. Thakur and Saini [15], described transmitting waveform for the optimization of bandwidth on the basis of Legendre orthogonal polynomial. The authors have achieved better results in terms of side-lobe reduction. Thakur and Saini [16], investigated two constraints for reducing the effect of non-linear amplifiers and reducing the interference in transmitting sequence. Their experimental results suppress side-lobe levels and present better performance. Shabaz et al. [17], presents a study on multimedia-based emerging technologies and data analysis of neuroscience as a service. Zhang et al. [18], discussed the application of data mining in creating an information management system for colleges and universities. The result analysis illustrates that their proposed methodology greatly upsurge the data analysis capability. Wang et al. [19], proposed a data processing system based on Artificial Intelligence. The experimental analysis reveals that the Fuzzy PC presents better stopping accuracy and displacement tracking.
Based on this, the author proposed a large amount of data for the operation status of coal mine electromechanical equipment, and the problem of low data quality, a data mining framework is proposed, establish a data mining model for the operating status of electromechanical equipment based on dual MapReduce; Aiming at the problems of low maintenance efficiency and high maintenance cost of traditional equipment shutdown, a combined forecasting model based on AGB is proposed to control the future operation status of equipment.
3. Data mining predictive modeling based on dual Map Reduce
With the increase in the amount of data on the operation status of coal mine electromechanical equipment, in the stand-alone mode, the speed and efficiency of data mining, analysis and prediction are relatively low, cannot meet the big data processing and analysis of multiple working face and multiple equipment. In view of the low efficiency of massive data mining and the slow running speed of a single machine, the author realizes through clustering algorithm and AGB combined forecasting model, establish a mining and predictive model of coal mine electromechanical equipment operating status based on dual Map Reduce, through the parallel design of the model, in order to improve the efficiency of data mining and forecasting, lay the foundation for the next step of evaluating the health status of coal mine electromechanical equipment [20].
3.1. Overview of map reduce
Map Reduce is one of the cores of Hadoop, its function is mainly to frame the parallel computing model of massive data, it has the characteristics of low cost, convenient deployment, fast calculation speed, and high reliability. Generally, it can be completed with more than two PCs, and the configuration requirements of the PC are low. Easy to deploy, after the master node is successfully deployed, it can be directly mirrored and sent to each sub-node. Therefore, it is very suitable for the prediction of massive data mining. The core of Map Reduce is divided into two stages, Map (mapping) phase and Reduce (reduce) phase. In the Map phase, the input data is converted into key-value pairs (key, value) for transmission; In the Reduce phase, the results calculated in the Map phase are combined and output. Through the built Map Reduce data mining framework, first, the data is sliced and distributed to each node, reasonably schedule each node to process the corresponding data block, combine the key-value pairs generated after execution through Combiner, after the merge is completed, it is used as the input of the Reduce stage, and the merged output result is performed [21].
3.2. MapReduce workflow
1) Read data files and data sets from HDFS or Hbase, divide the input data into n data blocks with a size of 32 MB or 64 MB through the splitting function, each data block is handed over to a node for processing. Usually there is a Master node in the Map Reduce program, mainly responsible for task distribution to each slave node and receiving processing results. Subsequently, the Master node distributes the tasks of each node and starts the copy program on the Master node. The divided n data blocks can be processed in parallel, each piece is processed by a map thread [22].
2) The Mapping phase mainly analyzes and processes the data block according to the map function in the copy program, store the key value generated after processing in the memory.
3) The output generated by each map thread goes through the shuffling stage, in fact, the data with the same key value is placed in a shuffle.
4) The Reducing stage receives the output key value of the shuffling stage, combine shuffles with the same key, and calculate its value, write to the output file of this node, finally, the output files of each slave node are sent to the Master.
5) Finally, output the output file of the Master node to the user [23].
3.3. Modeling of the operation status of coal mine electromechanical equipment based on the AGB combined forecasting model
3.3.1. Mean weight method
The simplest and direct method to obtain the predicted value of the AGB combined model, it is to calculate the arithmetic mean of the predicted values of prediction models:
where: is the predicted value of the AGB combined model, , is the predicted value of the th model.
3.3.2. Variance-covariance weighting method
Let be the predicted value of the ARIMA model, is the predicted value of the GM(1, 1) model, is the predicted value of BP neural network, is the predicted value of the weighted combination model. The average errors corresponding to the corresponding three models are , , , the weight coefficients corresponding to each model are , , then there is:
where: from the unbiasedness of , its variance is is the smallest, then there is:
If , , , it shows that the AGB combined forecasting model consists of a single model [24].
3.4. Optimal matrix method
Suppose there are single models, the model prediction results are formed into an optimal matrix. Replace the th model with , relative to the number of accurate predictions of the thmodel, it can be concluded that the prediction weight of the th model is:
where: , .
3.5. AGB combined forecasting modeling
The author considers that the reliability of the average weight method is relatively low, it will appear that models with low prediction accuracy have the same contribution rate to the combined model as models with high prediction accuracy as a result, the prediction accuracy of the combined model is reduced, therefore, it is not used. The essence of the optimal matrix method is to determine the weight by the number of times the statistical model predicts the accuracy, if the prediction results of the two models differ very little, as a result, the prediction accuracy of the combined model is reduced, and the variance-covariance weighting method, then use the proportion of the average error of the predicted value to solve the weight problem [25].
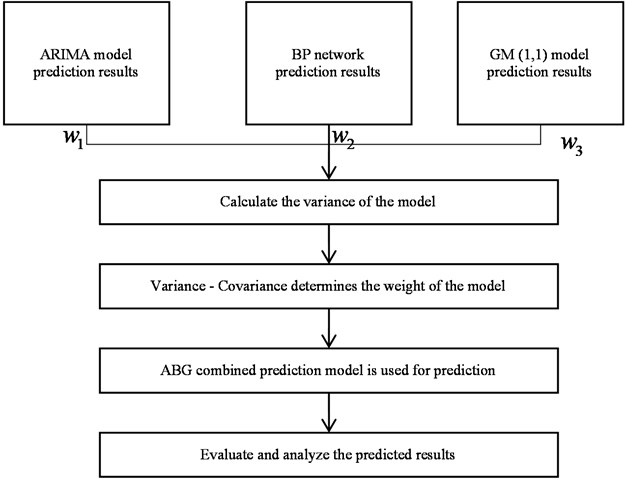
The modeling process of the AGB combined model is show in Fig. 2.
The author separately introduced the model process of ARIMA model, GM(1, 1) model and BP neural network in detail, the author will not repeat it. Fig. 2 is the flow chart of the AGB combined forecasting model:
1) Input the prediction results of ARIMA model, GM(1, 1) model and BP neural network model.
2) The author solves the prediction variance of each single model separately, which is expressed as , , [26].
3) The weights corresponding to the ARIMA model, GM(1, 1) model, and BP neural network model are , then the predicted value of the AGB combination model is:
where: , , is the predicted value of each single model.
4) Calculate the weight of , , according to the formula.
5) Import the data into the AGB combined model for prediction, and get the prediction sequence.
6) Carry out error test and evaluate its prediction results [27].
Fig. 2Flow chart of AGB combined model
4. Experimental results and analysis
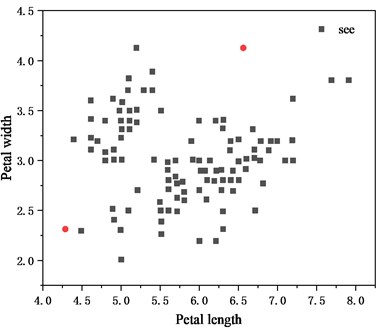
The author uses some data of the cooling water pressure of the pump at the height-adjusting part of a coal mining machine shearer, in order to verify the accuracy of the MapReduce mining prediction model. Use pycharm to write code, by importing matplotlib. pyplot module, numpy module, sklearn module, calibration of the original data and cluster analysis [28].
The results after clustering are shown in Fig. 3, and the categories are divided, and extract the data whose cluster center radius is , and finally return the characteristic data in time series.
Fig. 3Shows the clustering results
The author imported the extracted feature data into ARIMA model, GM(1, 1) model, BP neural network model, the prediction results are shown in the following figures. First calculate the value of , , as 0.05, 0.07, 0.08, secondly, according to Eqs. (3), (4), and (5), the values of , , are calculated as 0.26, 0.35, and 0.39, respectively,finally, the data is predicted according to the AGB combined forecasting model, the result is shown in Fig. 4. Fig. 4 also shows the residual variance and average relative error of various models [29].
Fig. 4Predicted results of each model (MPa)
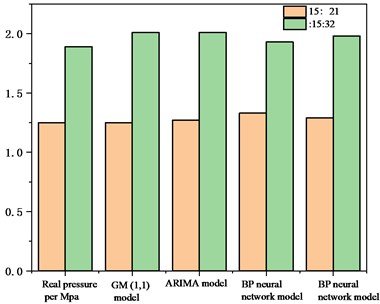
Fig. 5 is a comparison diagram of the prediction results of a single model and a combined model.
As can be seen from Fig. 5, the prediction results of the AGB combination model are closer to the original data than the single prediction model, the author further solved the residual distribution of each prediction model, Fig. 6 shows the residual distribution of each model [30].
Fig. 5Comparison of prediction results of various models
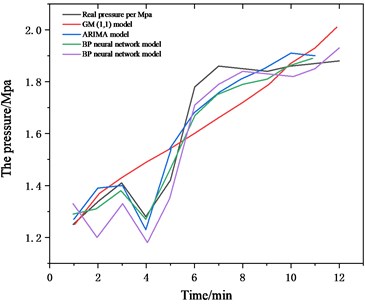
Fig. 6Comparison of residual results of each model
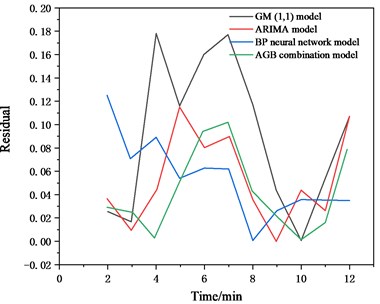
As can be seen from the above results, the AGB combined forecasting model proposed by the author can predict the operation status of the shearer well, the residual variance between the predicted value and the true value is 0.0013, the average relative error is 2.81 %, and the accuracy and residual variance are both lower than the single model [31].
The author first used a 4-node cluster to mine the measured data of equipment operating status with a data scale of 4, 8, 12, 16, and 200,000, record the required time, and then reduce the number of worker nodes in turn, and record the corresponding completion time. The final result is shown in Fig. 7.
It can be seen from Fig. 7 that when the amount of data is small, it takes less time for a single node to perform data mining predictions, when the amount of data is about 65,000, it is more advantageous to use a single node for data mining prediction, but with the increase in the amount of data, the time required for data mining prediction using a single node is significantly increased, and is higher than the time spent by multiple nodes. The growth rate of the time required for data mining prediction using multiple nodes is relatively slow. Analyze the above phenomenon, when the amount of data is small, the main reason is that multiple nodes are in distributed execution, spend a lot of time on data sharding, node startup, and system initialization, with the increase of the amount of data and the number of nodes, the advantages of parallel computing can be reflected [32-33].
The trend of the parallel acceleration ratio of the cluster at different nodes over time is shown in Fig. 8.
Fig. 7Comparison of monitoring data mining time
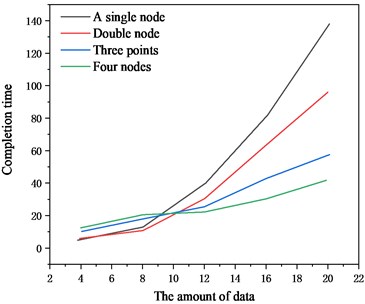
Fig. 8Variation trend of parallel speedup with data volume
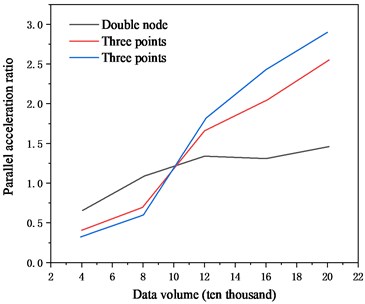
It can be seen from Fig. 8 that when the amount of data is less than 100,000, the more nodes there are, the lower the parallel speedup will be the author’s analysis may be due to the introduction of external loops in the parallel computing program when performing analysis and calculations, as a result, some programs cannot be executed in parallel, which reduces the parallel speedup. As the amount of data increases, the parallel speedup ratio has risen significantly, and the more nodes, the greater the parallel speedup. It can be concluded that when the amount of data is large enough, the parallel speedup increases as the number of nodes increases, the data mining prediction can be completed more efficiently, but the actual speedup is lower than the ideal speedup, mainly because the outer layer of the data mining prediction algorithm contains parts that cannot be executed in parallel.
5. Conclusions
Build a Hadoop cluster through server virtualization technology, the author has verified the mining prediction model on a multi-node cluster, verifies the dual Map Reduce mining prediction model, by comparing and analyzing a single predictive model, the average relative error between the predicted value and the true value of the combined forecasting model based on AGB is 2.81 %, lower than the individual prediction models, has a good forecasting effect. The author analyzes and studies the impact of cluster nodes and the time spent on data mining predictions, when the amount of data is small, the main reason is that multiple nodes spend a lot of time on data sharding, node startup, and system initialization during distributed execution, with the increase of the amount of data and the number of nodes, the advantages of parallel computing can be realized.
References
-
W. Dai, J. Sun, T. Huang, Z. Lu, and L. Zhu, “Precision retaining time prediction of machining equipment based on operating vibration information,” IEEE Access, Vol. 8, pp. 144156–144166, 2020, https://doi.org/10.1109/access.2020.3014334
-
T. Hong, C. Ji, J. Park, S.-B. Leigh, and D.-Y. Seo, “Prediction of environmental costs of construction noise and vibration at the preconstruction phase,” Journal of Management in Engineering, Vol. 31, No. 5, p. 04014079, Sep. 2015, https://doi.org/10.1061/(asce)me.1943-5479.0000313
-
A. Ragab, M.-S. Ouali, S. Yacout, and H. Osman, “Remaining useful life prediction using prognostic methodology based on logical analysis of data and Kaplan-Meier estimation,” Journal of Intelligent Manufacturing, Vol. 27, No. 5, pp. 943–958, Oct. 2016, https://doi.org/10.1007/s10845-014-0926-3
-
J. Duan, J. Zhou, Y. You, and X. Wang, “Time-domain analysis of vortex-induced vibration of a flexible mining riser transporting flow with various velocities and densities,” Ocean Engineering, Vol. 220, p. 108427, Jan. 2021, https://doi.org/10.1016/j.oceaneng.2020.108427
-
S. Xia, G. Wang, H. Yu, Q. Liu, and J. Wang, “Vibration-based outlier detection on high dimensional data,” International Journal on Artificial Intelligence Tools, Vol. 25, No. 3, p. 1650013, Jun. 2016, https://doi.org/10.1142/s0218213016500135
-
B. He and L. Yin, “Prediction modelling of cold chain logistics demand based on data mining algorithm,” Mathematical Problems in Engineering, Vol. 2021, No. 3, pp. 1–9, Feb. 2021, https://doi.org/10.1155/2021/3421478
-
O. N. Novoselov and I. L. Gufeld, “Prediction of the state of dynamic systems based on measurement data,” Measurement Techniques, Vol. 58, No. 10, pp. 1095–1101, Jan. 2016, https://doi.org/10.1007/s11018-015-0848-2
-
A. Gholizadeh, L. Borůvka, M. Saberioon, and R. Vašát, “A memory-based learning approach as compared to other data mining algorithms for the prediction of soil texture using diffuse reflectance spectra,” Remote Sensing, Vol. 8, No. 4, p. 341, Apr. 2016, https://doi.org/10.3390/rs8040341
-
R. Burgess-Limerick, “Measuring and managing workplace whole-body vibration exposures,” Acoustics Australia, Vol. 44, No. 1, pp. 129–135, Apr. 2016, https://doi.org/10.1007/s40857-015-0032-5
-
A. V. Grishchenko, V. A. Kruchek, D. N. Kurilkin, and O. R. Khamidov, “Diagnostics of the technical condition of rolling bearings of asynchronous traction motors of locomotives based on data mining,” Russian Electrical Engineering, Vol. 91, No. 10, pp. 593–596, Oct. 2020, https://doi.org/10.3103/s1068371220100041
-
O. Yilmaz, “The comparison of most widely used ground vibration predictor equations and suggestions for the new attenuation formulas,” Environmental Earth Sciences, Vol. 75, No. 3, pp. 1–11, Feb. 2016, https://doi.org/10.1007/s12665-015-5011-5
-
M. Seera, C. P. Lim, and C. K. Loo, “Motor fault detection and diagnosis using a hybrid FMM-CART model with online learning,” Journal of Intelligent Manufacturing, Vol. 27, No. 6, pp. 1273–1285, Dec. 2016, https://doi.org/10.1007/s10845-014-0950-3
-
Y. Wang, B. Tang, L. Meng, and B. Hou, “Adaptive estimation of instantaneous angular speed for wind turbine planetary gearbox fault detection,” IEEE Access, Vol. 7, pp. 49974–49984, 2019, https://doi.org/10.1109/access.2019.2908192
-
R. Shirani Faradonbeh, M. Monjezi, and D. Jahed Armaghani, “Genetic programing and non-linear multiple regression techniques to predict backbreak in blasting operation,” Engineering with Computers, Vol. 32, No. 1, pp. 123–133, Jan. 2016, https://doi.org/10.1007/s00366-015-0404-3
-
A. Thakur and D. S. Saini, “Bandwidth optimization and side-lobe levels reduction in PC radar using Legendre orthogonal polynomials,” Digital Signal Processing, Vol. 101, p. 102705, Jun. 2020, https://doi.org/10.1016/j.dsp.2020.102705
-
A. Thakur and D. S. Saini, “MIMO radar sequence design with constant envelope and low correlation side-lobe levels,” AEU – International Journal of Electronics and Communications, Vol. 136, p. 153769, Jul. 2021, https://doi.org/10.1016/j.aeue.2021.153769
-
M. Shabaz, A. Sharma, S. A. Ajrawi, and V. V. Estrela, “Multimedia-based emerging technologies and data analytics for Neuroscience as a Service (NaaS),” Neuroscience Informatics, Vol. 2, No. 3, p. 100067, Sep. 2022, https://doi.org/10.1016/j.neuri.2022.100067
-
M. Zhang, J. Fan, A. Sharma, and A. Kukkar, “Data mining applications in university information management system development,” Journal of Intelligent Systems, Vol. 31, No. 1, pp. 207–220, Jan. 2022, https://doi.org/10.1515/jisys-2022-0006
-
H. Wang, L. Hao, A. Sharma, and A. Kukkar, “Automatic control of computer application data processing system based on artificial intelligence,” Journal of Intelligent Systems, Vol. 31, No. 1, pp. 177–192, Jan. 2022, https://doi.org/10.1515/jisys-2022-0007
-
X. Li, W. Yu, and S. Villegas, “Structural health monitoring of building structures with online data mining methods,” IEEE Systems Journal, Vol. 10, No. 3, pp. 1291–1300, Sep. 2016, https://doi.org/10.1109/jsyst.2015.2481380
-
M. Elgargni, A. Al-Habaibeh, and A. Lotfi, “Cutting tool tracking and recognition based on infrared and visual imaging systems using principal component analysis (PCA) and discrete wavelet transform (DWT) combined with neural networks,” The International Journal of Advanced Manufacturing Technology, Vol. 77, No. 9-12, pp. 1965–1978, Apr. 2015, https://doi.org/10.1007/s00170-014-6576-y
-
R. Ziani, A. Felkaoui, and R. Zegadi, “Bearing fault diagnosis using multiclass support vector machines with binary particle swarm optimization and regularized Fisher’s criterion,” Journal of Intelligent Manufacturing, Vol. 28, No. 2, pp. 405–417, Feb. 2017, https://doi.org/10.1007/s10845-014-0987-3
-
J. Zhou, Z.-K. Shi, and Z.-S. Liu, “A novel lattice hydrodynamic model for bidirectional pedestrian flow with the consideration of pedestrian’s memory effect,” Nonlinear Dynamics, Vol. 83, No. 4, pp. 2019–2033, Mar. 2016, https://doi.org/10.1007/s11071-015-2462-x
-
A. A. Repin, A. K. Tkachuk, V. N. Karpov, V. N. Beloborodov, A. G. Yaroslavtsev, and A. A. Zhikin, “Engineering and analysis of independent movable compression–vacuum percussion source of P-waves in seismic survey,” Journal of Mining Science, Vol. 52, No. 1, pp. 146–152, Jan. 2016, https://doi.org/10.1134/s1062739116010236
-
S. S. R. Moustafa, M. S. Abdalzaher, M. H. Yassien, T. Wang, M. Elwekeil, and H. E. A. Hafiez, “Development of an optimized regression model to predict blast-driven ground vibrations,” IEEE Access, Vol. 9, pp. 31826–31841, 2021, https://doi.org/10.1109/access.2021.3059018
-
H. Salehi, S. Biswas, and R. Burgueño, “Data interpretation framework integrating machine learning and pattern recognition for self-powered data-driven damage identification with harvested energy variations,” Engineering Applications of Artificial Intelligence, Vol. 86, pp. 136–153, Nov. 2019, https://doi.org/10.1016/j.engappai.2019.08.004
-
H. Salehi, S. Das, S. Biswas, and R. Burgueño, “Data mining methodology employing artificial intelligence and a probabilistic approach for energy-efficient structural health monitoring with noisy and delayed signals,” Expert Systems with Applications, Vol. 135, pp. 259–272, Nov. 2019, https://doi.org/10.1016/j.eswa.2019.05.051
-
G. Zak, A. Wylomanska, and R. Zimroz, “Local damage detection method based on distribution distances applied to time-frequency map of vibration signal,” IEEE Transactions on Industry Applications, Vol. 54, No. 5, pp. 4091–4103, Sep. 2018, https://doi.org/10.1109/tia.2018.2828787
-
Y. Yang, Y. Liu, Z. Liu, and S. Q. Shi, “Prediction of Yueqin acoustic quality based on soundboard vibration performance using support vector machine,” Journal of Wood Science, Vol. 63, No. 1, pp. 37–44, Feb. 2017, https://doi.org/10.1007/s10086-016-1598-8
-
S. L. Brunton, M. Budišić, E. Kaiser, and J. N. Kutz, “Modern Koopman theory for dynamical systems,” SIAM Review, Vol. 64, No. 2, pp. 229–340, May 2022, https://doi.org/10.1137/21m1401243
-
T. Okazaki, K. Okusa, and K. Yoshida, “Prediction of the Number of Defects in Image Sensors by VM Using Equipment QC Data,” IEEE Transactions on Semiconductor Manufacturing, Vol. 32, No. 4, pp. 434–437, Nov. 2019, https://doi.org/10.1109/tsm.2019.2941585
-
W. Liu, Z. Wu, C. Li, and L. Xu, “Prediction of ground-borne vibration induced by a moving underground train based on excitation experiments,” Journal of Sound and Vibration, Vol. 523, p. 116728, Apr. 2022, https://doi.org/10.1016/j.jsv.2021.116728
-
Z. Liu, W. Li, H. Ouyang, and D. Wang, “Eigenstructure assignment in vibrating systems based on receptances,” Archive of Applied Mechanics, Vol. 85, No. 6, pp. 713–724, Jun. 2015, https://doi.org/10.1007/s00419-015-0983-x
About this article

Doctor Innovation Fund of North China University of Water Resources and Electric Power: B2017120114.
