Abstract
Mine tunnel deformation blocks underground coal mine traffic, or even cause serious security incidents. Aiming at the problem of lack of monitoring method of tunnel deformation, this paper presents a method of tunnel deformation measurement based on laser-radar technology. The measurement method is a non-contact and on-line measurement method. The system is mainly composed of two parts, the host part is composed of computer, ZigBee module and processing software system based on Processing, the slave part is composed of four-rotor craft, STM32 microprocessor, laser radar, ZigBee wireless communication module and power supply module. The new tunnel deformation measurement method based on radar proposed in this paper has the advantage of smaller measurement data error, the data communication and processing speed is qualified and suitable for on-line monitoring.
Highlights
- Aiming at the problem of lack of monitoring method of tunnel deformation, this paper presents a method of tunnel deformation measurement based on laser-radar technology.
- The measurement method proposed in this paper is a non-contact on-line measurement method, which is suitable for the on-line monitoring of tunnel deformation.
- The measurement system adopts ZigBee module to achieve wireless communication, STM32 microprocessor control, and lidar to achieve non-contact measurement.
1. Introduction
There are a large number of tunnels in underground coal wells, such as lifelines of the staff, material transport lines and safe ventilation lines, and tunnel deformation occurs often with the tunnel development, resource extraction, geological activities, etc. Tunnel deformation will block the traffic within the tunnel, and even cause serious security incidents [1]. Therefore, the detection of mine tunnel deformation is of great significance to the safety of coal mine production. The tunnel deformation monitoring methods can be classified as contact measurement and non-contact measurement [2]. Most of the contact measurement methods rely on displacement sensors, pressure sensors and other terminal monitoring equipment, and sensors need to be placed in the appropriate interval multiple tunnels, which will cause complicated operation and improve cost of measurement system. And the contact measurement itself will cause damage to tunnels in a certain extent. Non-contact measurement composes of the mechanical, electronic technology, computer technology and other multi-disciplinary research results. The non-contact measurement method also has the advantage of fast measurement and the amount of data is more convenient to follow-up research. Commonly used non-contact measurement technologies include laser ranging sensors, digital photogrammetry, ultrasonic technology, composite image monitoring et al. A dynamic roadway deformation monitoring system based on phase laser ranging sensor was proposed by Xu et al. [3], which can monitor roof subsidence and local deformation of mine tunnel. Xu et al. [4, 5]. conducted experimental research on roadway deformation by using digital photography, and the experimental results showed that the technology was feasible and effective. Li et al. [6] used ultrasonic technology to monitor mine tunnel deformation, and verified that ultrasonic technology has certain advantages. A study on downhole deformation monitoring based on composite image monitoring technology was proposed by Zhang et al. [7]. In this paper, the proposed method does not need to do any treatment with the wall of tunnel, the laser radar mounted in the four-rotor craft (UAV), the mobile scanning of the entire tunnel sidewall data, and through wireless communication to the host computer for data processing [8], the whole system is simple, fast measurement, to overcome shortcomings of existing methods.
2. Overall program of the measurement and control system
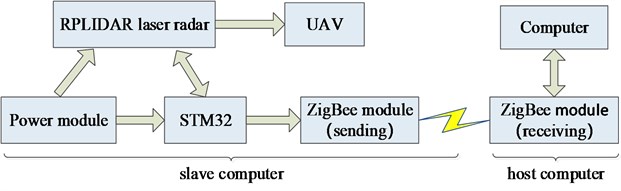
The overall program of this study can be divided into two parts: host computer part and slave computer part. The slave computer is mainly used for the collection and transmission of tunnel contour data. The host computer is mainly used for the data processing, 3D reconstruction of tunnels and deformation evaluation. The whole process involves hardware systems and software systems, and the overall block diagram is shown as Fig. 1.
Fig. 1Overall block diagram
3. Introduction of system
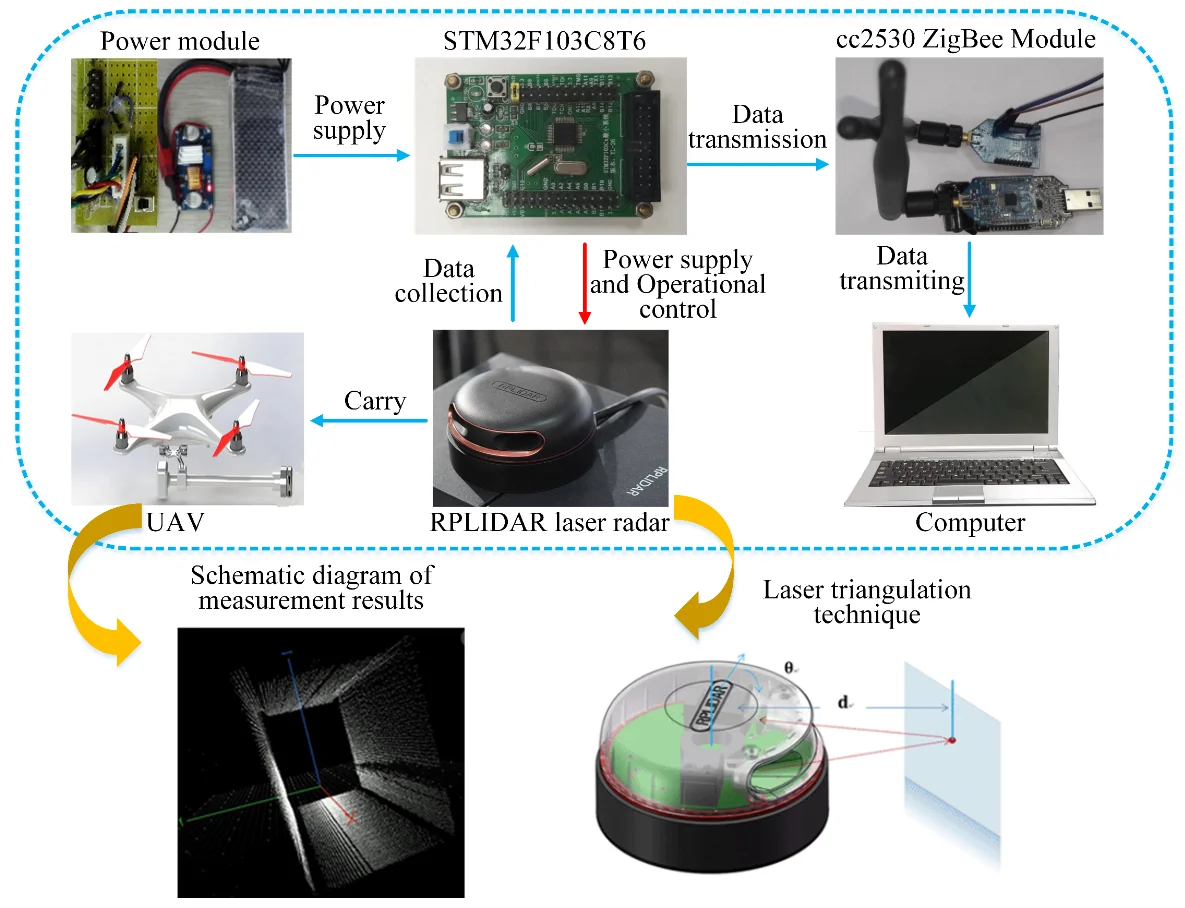
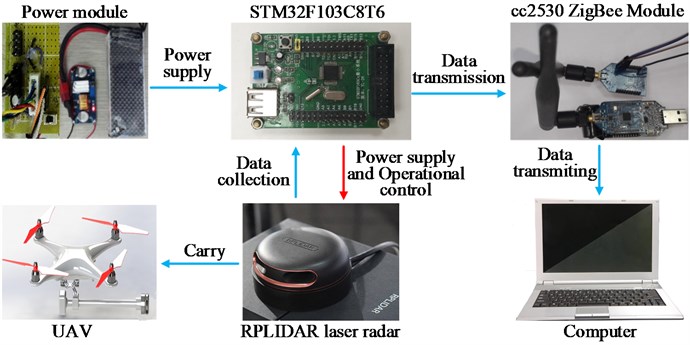
The hardware system relates to the power module, the RPLIDAR laser radar, the four-rotor craft (UAV), the STM32 single chip computer, the cc2530ZigBee sending module and the host computer's cc2530ZigBee receiving module and the computer for the host computer processing. Hardware and the function of the link between the specific is shown in Fig. 2.
Fig. 2System hardware composition diagram
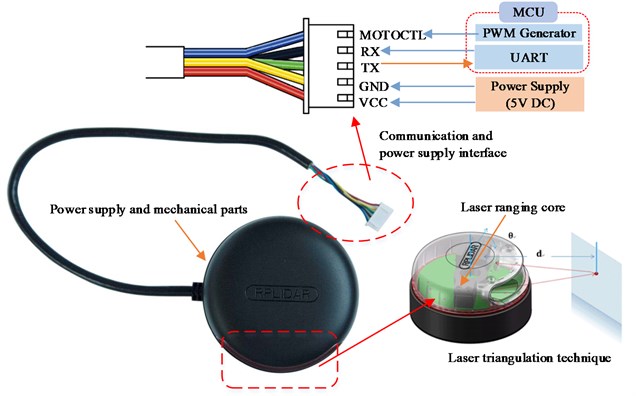
3.1. RPLIDAR laser radar
The design uses a new generation of low-cost two-dimensional laser radar RPLIDAR A2 developed by SLAMTEC Company [9, 10]. RPLIDAR mainly includes the laser ranging core and the power and mechanical parts that rotate the laser ranging core at high speed, RPLIDAR system performance parameters are shown in Table 1.
Table 1RPLIDAR lidar performance parameters table
Project | Performance |
The measured distance | White object: 16 m |
Black objects: 10 m | |
Measuring blind area | 0.2 m |
Sampling frequency | 16 kHz |
Sweep frequency | 5-15 kHz |
Angular resolution | 0.225° |
Communication interface | TTL UART |
Pitching Angle | ±1.5° |
Communication rate | 256000 bps |
Compatibility mode | Support SDK protocol |
When the RPLIDAR is working normally, the ranging core will begin rotating clockwise scanning. The user can obtain the RPLIDAR scanning and ranging data through the RPLIDAR communication interface, and control the start, stop and rotation speed of the rotary motor through PWM.
Laser triangulation ranging technology is adopted by RPLIDAR, coupled with SLAMTEC developed high-speed visual acquisition and processing institutions, it can carry out up to 16,000 ranging actions per second [11]. Every time range in the process, RPLIDAR will launch through the infrared laser modulation signal, the laser signal generated after exposure to the target object reflective will be RPLIDAR visual acquisition system receiving, then through embedded within the RPLIDAR real-time DSP processor, the exposure to the target object and RPLIDAR distance and angle of the current information from the output of the communication interface. The schematic diagram of RPLIDAR system is shown in Fig. 3.
Fig. 3Schematic diagram of the RPLIDAR system
3.2. STM32F103C8T6 microcontroller
STM32F103C8T6 Microcontroller is adopted in the system [12, 13], as shown in Fig. 4. The model single-chip crystal frequency multiplier up to 72 MHZ, running fast, low cost, strong anti-interference, applicable to the research system. The design mainly related to the following features STM32F103C8T6. 1) Timer PWM output function; 2) Serial communication; 3) Analog voltage input ADC.
LabVIEW, a graphical programming language, is adopted by this system for program design. The program is divided into two parts: 1) Main program of laser tunnel detection slave computer; 2) Host computer program for laser tunnel detection. The upper and lower computer communication adopts cc2530 ZigBee wireless communication for data transmission. The main program of the lower machine for laser tunnel detection is shown in Fig. 5, and the program of the upper machine for laser tunnel detection is shown in Fig. 6.
Fig. 4STM32F103C8T6 microcontroller
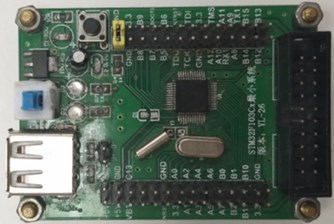
Fig. 5Main program of laser tunnel detection slave computer
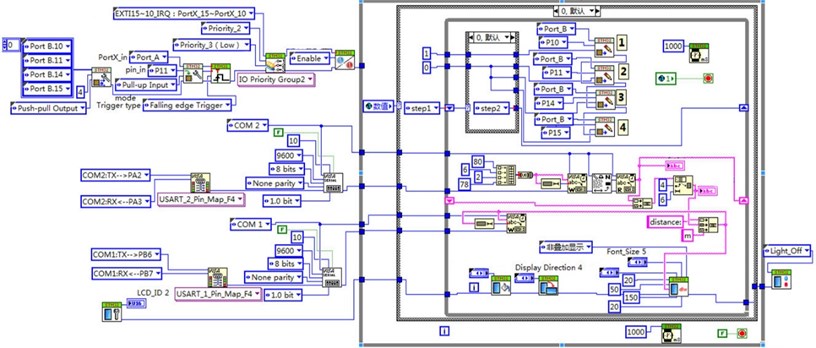
Fig. 6Host computer program for laser tunnel detection
3.3. Cc2530 ZigBee wireless communication
The system uses the cc2530 ZigBee wireless communication transceiver module for data mutual transmission, as shown in Fig. 7. ZigBee is a short distance wireless communication technology with low cost, low power consumption and ad-hoc network, which is widely used in environmental monitoring, smart home and other occasions. The ZigBee module needs to be configured before use. There are five steps in configuration, including 1) Connect the device and select serial port number; 2) Set the node type (coordinator or router); 3) Set the radio channel and PAN ID; 4) Set the node number and baud rate; 5) Set the data transmission mode.
Fig. 7Cc2530 ZigBee wireless communication transceiver module
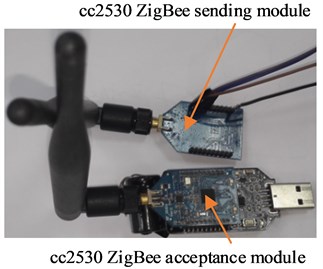
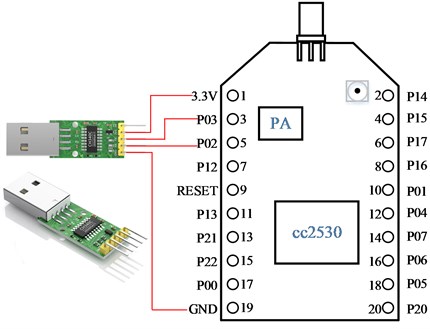
Cc2530 ZigBee wireless communication module is divided into cc2530 ZigBee sending module and cc2530 ZigBee receiving module. The cc2530 ZigBee sending module is connected to the STM32F103C8T6 single chip microcomputer to transmit the data collected by the lidar to the upper computer. The cc 2530 ZigBee receiving module is connected to the upper computer via USB for receiving data. Some ZigBee modules on the market do not have USB interfaces, so they cannot be connected to computers. For this type of module, a USB-to-TTL module (model: CH340C) is required for transfer, the connecting line of module is shown in Fig. 8.
Fig. 8Module transition wiring diagram
3.4. Power supply module
The machine hardware to be mounted on the four-rotor unmanned aerial vehicles, so the power supply using 3S lithium battery as a system power supply [14]. As the 3S lithium battery, the voltage range of 11.1-12.6V DC, and the system supply voltage should be 5V DC power supply, it is necessary to design a DC to DC power supply buck circuit [15]. In this paper, high-power DC-DC adjustable step-down module based on XL4015E buck chip is adopted.
3.5. Tunnel side wall data collection
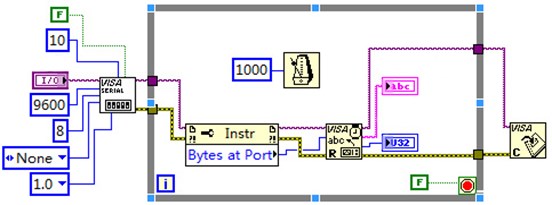
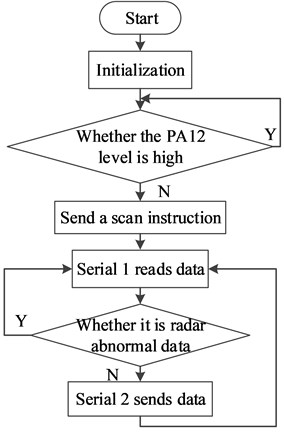
Tunnel wall data acquisition is based on the next bit machine software program to achieve. The scan request is sent to the RPLIDAR mounted on the UAV, then the RPLIDAR will return the response data. The STM32 will then read the response data in real time. After the preprocessing, the data will be sent to the host computer via the ZigBee module. Driven by the UAV, RPLIDAR will scan the entire mine tunnel, so the host computer can obtain the data of the entire mine tunnel sidewall.
The specific program flow chart and the LabVIEW For STM32 program are shown in Fig. 9.
Fig. 9Slave computer program flow chart
3.6. Tunnel side wall data collection
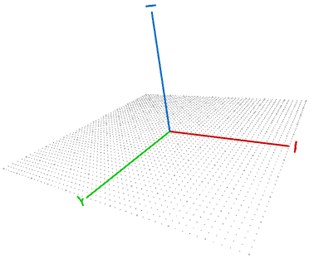
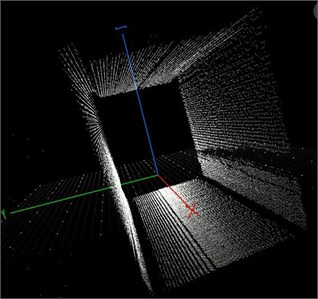
The data processing and image construction of this paper is based on Processing3.3 software. This paper mainly uses the size (width, height, renderer) function to make the processing work in 3D mode, and then declare the core class, using the Scene (parent) function to build the 3D environment [16], so that we can get a zoom in and out of the 3D scene The In this paper, the use of ControlP5 library cp5.addButton (string). Set Position (X-Position, Y-Position) is respectively, to create a Start button and Stop button, respectively, with the next machine to send and stop the command. The results of its creation are shown in Fig. 10.
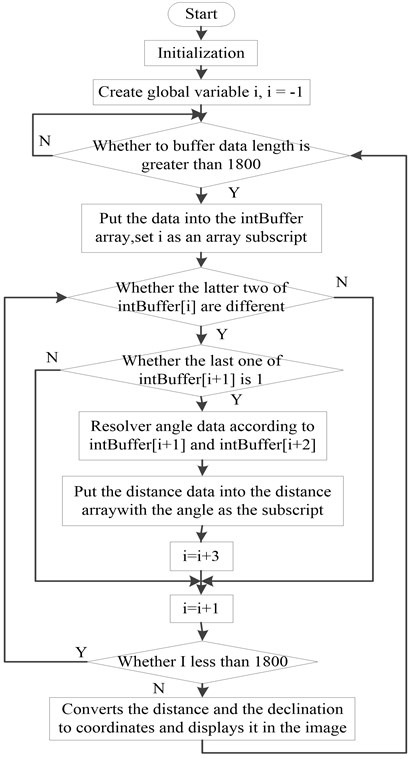
PC master software program flow chart is shown in Fig. 11.
Fig. 103D interactive scene
4. Experiment and error analysis
4.1. Tunnel simulation experiment
The system simulates the tunnel in the corridor for 3D image reconstruction. In the night corridor lights and lights off the two environments to simulate, as shown in Fig. 12.
First download the next bit machine program, connect the hardware device, as shown in Fig. 13.
Fig. 11Schematic diagram of the RPLIDAR system
Experiments show that in the corridor lights and lights under the two environments scanning the same image (as shown in Fig. 14), indicating that the system is not limited by the light inside the tunnel.
Fig. 12Two simulated environments in the corridor
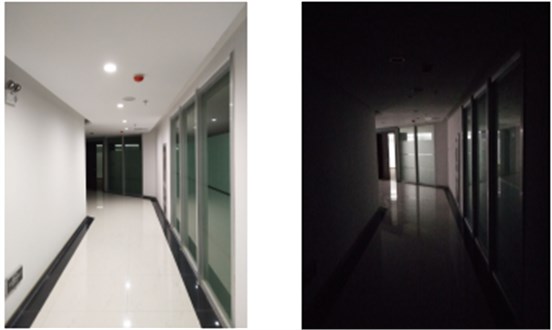
Fig. 13Experimental equipment
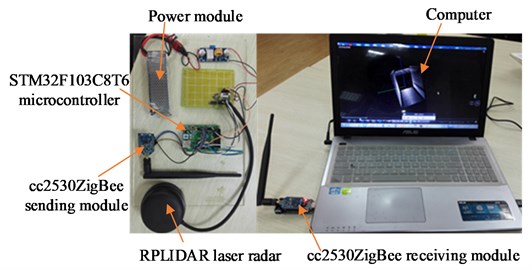
Fig. 14Two simulated environments in the corridor
4.2. Error analysis
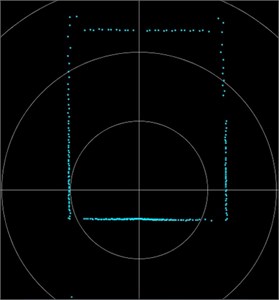
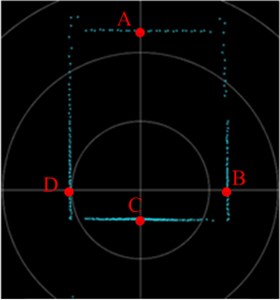
According to the experimental survey corridor contour data, respectively, take 0° and 180°, 90 ° and 270 ° corresponding to the four points (that is, laser radar up and down and left and right four points) distance values, respectively, in Fig. 15 A, C and B, D points, the size of which were, , , said.
This can be calculated by measuring the upper and lower corners of the corridor height value , with the left and right width value . Respectively:
Fig. 15Error analysis point distribution
While the actual height of the corridor is 2400 mm, the left and right width is 2000 mm. The system measured the corridor height and width of the relative error can be calculated as below:
The numerical analysis of the specific error is shown in Table 2. Respectively.
Table 2Measurement error analysis table (mm)
The number of measurements | ||||||||
1 | 2159 | 1071 | 248 | 935 | 2407 | 2006 | 0.29 % | 0.3 % |
2 | 2158 | 1070 | 250 | 936 | 2408 | 2006 | 0.33 % | 0.3 % |
3 | 2160 | 1071 | 248 | 938 | 2408 | 2009 | 0.33 % | 0.35 % |
The system error can be calculated about 0.3 %. As the side walls of the tunnel are the surrounding rock, once the deformation, the change will generally reach more than 50 mm, and the height of the tunnel is generally not less than 1800 mm, deformation caused by the height change rate of more than 5 %, much higher than the system error. The system measurement error meets the actual tunnel deformation measurement needs.
5. Conclusions
In this paper, a tunnel deformation measurement method based on radar technology is proposed, and a tunnel deformation detection system based on RPLIDAR radar is designed. Through the next bit machine control processing core STM32 microcontroller and laser sensors, ZigBee organically combined to achieve the lower computer data acquisition system. Through the data communication with the host computer, the collected data will be sent to the processing program, the program will process the data display, which realizes the simple reconfiguration of the two-dimensional plane and the 3D image, and achieves the fast and low error detection of the tunnel deformation.
References
-
Xu J. K. Experimental study on digital photogrammetry of tunnel deformation. Coal Mine Safety, Vol. 10, 2013, p. 63-65, (in Chinese).
-
Li Q., Shi W., Yang R. Deformation mechanisms in a coal mine roadway in extremely swelling soft rock. Springer Plus, Vol. 5, Issue 1, 2016, p. 1-13.
-
Xu L. N., Gao Y. C., Lei L. F., et al. Roadway deformation dynamic monitoring system based on laser sensor. Coal Technology, Vol. 37, Issue 11, 2008, p. 1-3, (in Chinese).
-
Goodbody T. R., Coops H. Assessing the status of forest regeneration using digital aerial photogrammetry and unmanned aerial systems. International Journal of Remote Sensing, Vol. 39, Issues 15-16, 2018, p. 5246-5264.
-
Xu J. K., Peng W., Wang Z. W. Experimental study on roadway deformation measuring based on digital photogrammetry. Coal Mine Safety, Vol. 44, Issue 10, 2013, p. 63-65, (in Chinese).
-
Li S., Jin X. L., Luo M. K., et al. Research and application of mine roadway deformation monitoring by ultrasonic technology. Advanced Materials Research, Vol. 962, Issue 965, 2014, p. 1070-1074.
-
Zhang W.W., Hao J.B., Zhu W.J., et al. Application of composite image monitoring technology in downhole measurement. Mechanical and electrical product development and innovation, Vol. 28, Issue 2, 2015, p. 89-91, (in Chinese).
-
Sousa A. N., Alimi I. A., Ferreira R. M., et al. Real-time dual-polarization transmission based on hybrid optical wireless communications. Optical Fiber Technology, Vol. 40, 2018, p. 114-117.
-
RPLIDAR ROS package, https://github.com/slamtec/rplidar_ros.
-
Slamtec RPLIDAR Public SDK for C++, https://github.com/slamtec/rplidar_sdk.
-
Vandapel N., Huber D. F., Kapuria A., et al. Natural terrain classification using 3-d ladder data. IEEE International Conference on Robotics and Automation, Proceedings, 2004, p. 5117-5122.
-
Kragh M., Jørgensen R. N., Pedersen H. Object detection and terrain classification in agricultural fields using 3D lidar data. International Conference on Computer Vision Systems, 2015, p. 188-197.
-
Yuxia G., Zhijie L. I. Design of a data acquisition device based on ADS1256 and STM32. Radio Engineering, 2019.
-
Chen S., Wang C., Dai H., et al. Power pylon reconstruction based on abstract template structures using airborne LiDAR data. Remote Sensing, Vol. 11, Issue 13, 2019, p. 1579.
-
Luo L. Design of 15-5V DC-DC power integrated circuits. University of Electronic Science and Technology, 2014. (in Chinese)
-
Jiang Y. J. Processing software application in auxiliary teaching. Software Guide, Vol. 15, Issue 8, 2016, p. 189-191, (in Chinese).
About this article

This work was supported by the National Natural Science Foundation Project in China (51705003 and 51979261), Anhui University Natural Science Research Project (KJ2017A081), Anhui Science and Technology Major Project (1808085QE130), Anhui University of Technology Youth Fund (12867), and Anhui Provincial Education Department Fund (11673), Graduate Innovation Fund (2019CX2030).
