Abstract
Blast-induced ground vibration (BIGV) is an undesirable environmental issue in and around mines. Usage of a high amount of explosive causes ground vibrations that are harmful to the nearby habitats and dwellings. In this paper, an attempt has been made to monitor the BIGV with low-cost wireless sensor network (WSN) and prediction of peak particle velocity (PPV) using an artificial neural network (ANN) technique at ACC Dungri limestone mine, Bargarh, Odisha, India. Eleven blasts PPV were recorded at different locations using wireless sensor network prototype system. The data has been transmitted by ZigBee (IEEE 802.15.4) protocol. The results are very promising and the recorded PPV varies from 0.191 mm/s to 8.60 mm/s. A three-layer, feed-forward back propagation neural network consists of 6 input parameters, 5 hidden neurons, and one output parameters were trained. Obtained results were compared based on correlation of determination (R2) and standard error between recorded and predicted values of PPV.
1. Introduction
Extensive research has been carried out on blasting and its adverse effects on nearby important structures. Blasting is an essential component for fragmentation of the overburden and mineral deposits. It is a more economical process for mining rock excavation. However, a fragmentation accounts for only 20-30 % of the total amount of explosive energy used and remaining large quantity of explosives energy during charging can result in undesirable scenarios like fly rocks, back breaks, over breaks, extreme noise and vibration impacts on communities [1]. Extreme levels of structural vibration triggered by ground vibration from blasting can result in damage to or failure of structures [2]. Ground vibrations are acoustic waves that propagate through the rock. They differ from the ground vibrations caused by earthquakes in terms of seismic source, the amount of available energy and traveled distances [3]. The generated seismic waves can damage the surrounding structure and livelihood thus it is essential to monitor and predict the blast-induced ground vibration in mines. Ground vibration is influenced by a number of parameters such as explosives characteristics and blast design [4]. Normally, PPV is one of the most important parameters adopted for evaluation of ground vibration and associated damage. Different researchers were proposed a number of vibration prediction equations and all these equations estimate the PPV mainly based on two parameters: maximum charge used per hole and distance between blast face [5]. If the numbers of influencing parameters are more, ANN is the most popular tool used for prediction of PPV.
The existing systems like Instantel Minimate plus, Micromate, Blastmate-II are generally used to monitor ground vibrations in mines [6]. The existing blast-induced ground vibration monitoring systems are of wire-based systems for acquiring and transferring the field data. In addition, the wire-based systems can only be applied to a limited area and the system becomes incapable if damages occur to the wires, which happens frequently [7]. The conventional vibration sensors composed as depicted in Fig. 1 is designed to simultaneously measure vibration and noise. Depending on the type, it has 1 to 8 input channels. Generally, in a surface mine, maximum one blast has been done per day. So, the problem with conventional vibration sensors is that if vibration needs to measure at several points (different positions), requires additional geophone sensors, which are expensive or if single geophone has considered, data collection was tedious and time-consuming.
Fig. 1Blast mate III (Instantel, Canada) [6]
![Blast mate III (Instantel, Canada) [6]](https://static-01.extrica.com/articles/18647/18647-img1.jpg)
To mitigate drawbacks and limits of existing monitoring systems, introduced a wireless-based monitoring system based on small vibration sensors with ZigBee (IEEE 802.15.4 standard) protocol. A tri-axis wireless MEMS capacitive sensor (ADXL 345, ±16 g range and sensitivity 32 mV/g) has considered for the experimental verification through signal processing. Novelty work of this paper describes the background of the development of the system and the way of installation at Dungri mine and investigate the response of the prototype system while blasting. The PPV has been measured with WSN and the obtained results closely match with the ANN predicted PPV.
2. Case study
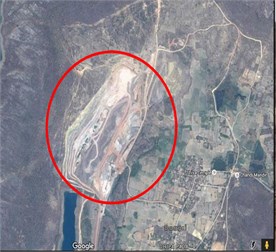
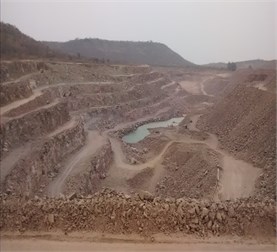
The case study was conducted at Dungri limestone mine which is situated in the Bargarh district of Odisha, India. The village Dungri is located at a distance of 850 meters from the active mine (Quarry No 6). The Dungri Limestone mine has a longitude of 83°32’57.4” and latitude of 21°41’24”. The Dungri area is situated in the rich mining belt of Bargarh. It is an entity of ACC Limited. Figs. 2 shows the location map of ACC Dungri limestone mine.
Fig. 2Map of Dungri limestone mine of ACC Ltd and nearby residential areas
a)
b)
3. Blasting practices at the mine
The Dungri limestone mine is fully mechanized mine being operated by drill and blast method for primary breakage and rock breaker for the handling of oversize fragmentation. Atlas Copco makes D50 and Sandvik make TITON 500 drill machine are being used for regular drilling and blasting operation with 9 to 10 m bench height. Burden varied between 3-3.5 m, spacing between 4-5 m and quantity of charge per hole between 40-60 kg for 115 mm hole diameter. Accordingly, the stemming column in the blast holes also varies between 2.5m-3m. Staggered pattern and the square grid pattern of holes are drilled. The blast hole depth is 10 meter including 10 % sub grade drilling. The non-electric (NONEL) system of initiation (TLDs 17/250 ms and 25/250 ms) has been used for blasting in combination with ANFO and cast booster weighing 150 gm. In the case of watery hole during the rainy season and in the lower bench, large diameter slurry explosive cartridge (Aqua dyne and super gel) is used for blasting. Each blast is monitored for ground vibration and fragmentation and necessary care has been taken based on the report obtained. In blasting, two to three rows of holes are blasted at a time and maximum 60 holes are blasted at a time with proper initiation, charging pattern and charge per delay. Ground vibration has been maintained at 3.00 mm/s within 300 meters of the blasting site. A sample initiation pattern given below depicts the basting of each hole one after another. General blasting pattern followed in the mine and charging pattern are shown in Figs. 3, respectively.
Fig. 3Charging pattern followed at Dungri mine, ACC
a)
b)
Delay is set in such a way that each hole gets the adequate free face and blasted at a time. Hence, optimum fragmentation with reduced ground vibration is achieved. The mine is equipped with two explosive magazines of 5.6 ton each and an ammonium nitrate store house of 45-ton capacity. The detonator storage capacities of the magazines are 30,000 and each one road van of 2.6-ton capacity is used for transportation of explosive.
4. Wireless sensor system for real-time monitoring blast-induced ground vibration
Over past decades, wireless sensor network (WSN) plays a key role in structural health monitoring (SHM), seismic wave monitoring and tunnel blast vibration monitoring. A WSN consisting of multiple sensor nodes that are connected wirelessly to a sink node (central node). Kim et al developed a vibrating wire WSN to monitor the tunnel construction with ZigBee protocol [8]. Induced vibrations in structures and ground are generally measured with micro electro mechanical system (MEMS) type accelerometers sensor. Each node has IEEE 802.15.4 standard ZigBee protocol module. The range of wireless transfer is limited to 100 m [9]. Kurytnik et al described the feasibility of implementing ZigBee sensor network for measuring vibration parameters [10]. Limit values for BIGV are recommended in the standard by Directorate General of Mines Safety (DGMS) circular No.7 of 1997 in India. The permissible PPV of ground vibration at sensitive structure should be below 5 mm/s [11]. If blasting is conducted at a mine site, where there are buildings or other structures nearby, the ground vibration must be monitored. Presently, it has been carried out using specialized measuring equipment. Typically, the general purpose devices are available for measuring the peak ground acceleration (PGA), PPV and FFT spectrum of ground vibration signals. The device commonly used for measurement is Instantel Minimate plus [6]. It has two geophone sensors and one microphone sensor for monitoring ground vibrations and air noise. Geophone sensors are installed on the ground surface with the help of spikes and data has been collected and stored in the memory of monitoring device. If the vibration limit exceeded, it shows afterward. Some of the high-cost devices also utilize wireless communication network for downloading vibration monitoring reports from the device or sending alerts, but the measurement data is not normally transferred in real time. Thus, to overcome the problems of existing device, a WSN prototype system has been developed for real- time monitoring of BIGV.
5. Development of prototype system
The goal of the prototype system is used as a real-time monitoring system and moreover inexpensive than the other devices currently available. The developed system consists of a sensor node and a sink node. the sensor node is based on a tri-axis MEMS accelerometer sensor (ADXL 345, ±16 g range and sensitivity 32 mV/g), an 8-bit AVR microcontroller and a 2.4 Ghz radio module with a 250 kbits/s data rate shown in Fig. 4. The Micro-electromechanical systems (MEMS) capacitive sensor (ADXL 345) having stationary fingers inside the proof mass attached to the spring of particular stiffness as shown in Fig. 5. The sensitivity and bandwidth of the sensor will decide by proof mass and the stiffness of the spring and they are inversely related to each other. The capacitance changes because of the air gap changes and results in a change in output voltage of the differential amplifier [12]. The sensitivity and the frequency [13] of the accelerometer are given by Eqs. (1), (2):
where is resonance frequency of structure and, and are the capacities of gaps then , is the stiffness of spring and is the proof of mass. The mathematical equation for the calculation of the acceleration for different values of displacement and frequency is shown in Eqs. (3) as:
where is acceleration due to gravity and is the displacement. An inexpensive MEMS accelerometer sensor (ADXL 345) with a high range (±16 g) is used for measuring the acceleration of vibrations. The signal comes out from the sensor is filtered with analog low pass filter with a 50 Hz cut-off frequency and 200 Hz sampling frequency. A 16-bit A/D converter is used to convert the analog signal into digital form.
Fig. 4Illustration of sensor node in the developed WSN system
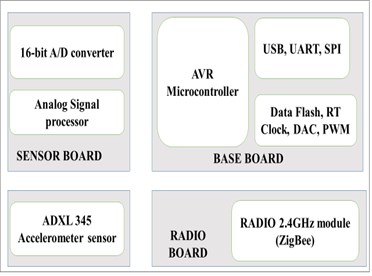
Fig. 5MEMS Capacitive type accelerometer sensor [14]
![MEMS Capacitive type accelerometer sensor [14]](https://static-01.extrica.com/articles/18647/18647-img7.jpg)
The AVR microcontroller consumes low power for measuring, data transfer and monitoring of the node function: controlling the wake-up and sleep nodes of the node. A 2.4 GHz radio module ZigBee is used with maximum 250 kbit/s transfer rates for transferring the data wirelessly from a sensor node to sink node with a range about 300 m outdoors. Sink (Receiver) node has one ZigBee module to receive information from the source node and stored in PC. Here, the ZigBee modules were configured with X-CTU software. After successful analysis of the BIGV of the sensor, it is subjected to real-time field monitoring at ACC Dungri mine.
6. Data processing of developed prototype system
To get more accurate vibration signal, the monitoring signal must be processed. The signal process includes the following.
1) Removing the direct current (DC),
2) Denoising,
3) Filtering.
6.1. Removing the DC
The DC component signal was represented by a mathematical expression when the parameter conversed, and it should be removed from the original signal. Assume the vibration signals as follows:
And the mean value obtained in the form:
Remove the mean value and, the resulting signal sequences is as follows:
where is the number of sample data points.
6.2. Denoising
the signal should be denoised to decrease the influence of interference signals and smooth vibration curve. This paper deals with the vibration signals by using the average method. The calculation formula is as follows:
where is sampling data and is the results after denoising and are the numbers of data points. is the weighted average factor. and the average factor should meet the following equation:
6.3. Digital filtering
The digital filter can filter out the noise signal or false signal and improve the signal-to-noise ratio, reduce the interference signal, and separate the frequency components. Frequency-domain the analysis is adopted in the digital filtering. The expression for the frequency-domain analysis method is:
where is the discrete Fourier transform of the input signal and are the frequency response of the filter function. as the lower limit frequency and as upper limit frequency and as the frequency resolution. The response function of the bandpass filter is:
According to Eqs. (9-10), the interference signal can be filtered by establishing a MATLAB program.
7. Installation and outcomes of prototype at mine site
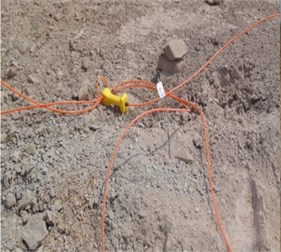
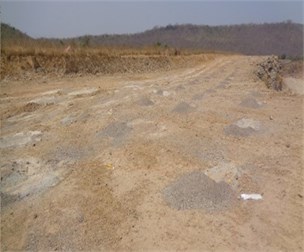
The developed prototype was installed at different monitoring points(distances) from the blast face at ACC Dungri limestone mine. The mine plan of blasting vibration measuring points (represented as numbers 1, 2, 3, 4) is shown in Fig. 6. Eleven blast peak particle velocity were recorded at each marked monitoring point with WSN prototype system along with Minimate plus device depicts in Figs. 7.
Fig. 6Representation of different locations of the blast site
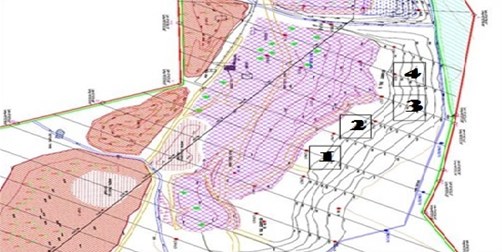
Fig. 7Installation of prototype along with Minimate plus device at different locations

a)
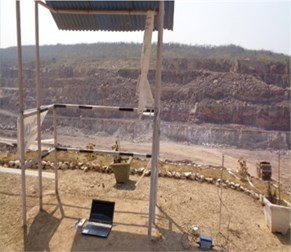
b)
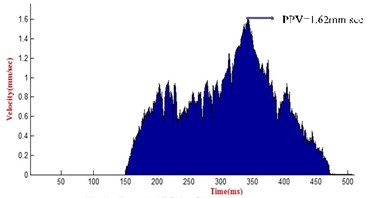
The initial blasting event’s PPV captured at a distance of 500 m from blast face with the WSN prototype system on 8th March 2016.the design blasting pattern consists of 64 holes and each hole depth of 10 m with a charge of 50 kg per hole. Spacing and the burden is 4 m and 3 m. After blasting, the particle velocities values recorded and plotted in MATLAB shown in Fig. 8(a) and the PPV observed at 1.62 mm/sec.
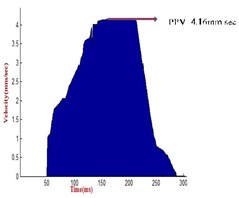
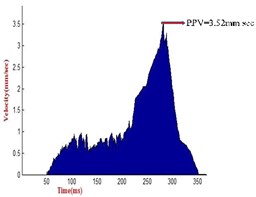
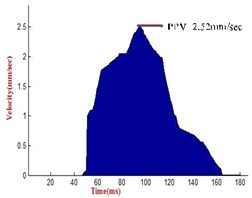
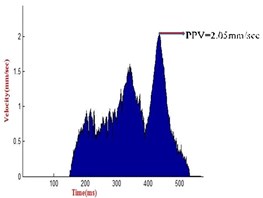
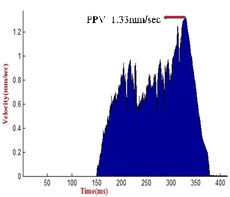
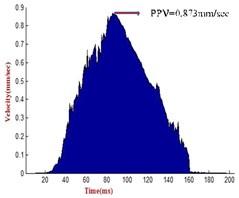
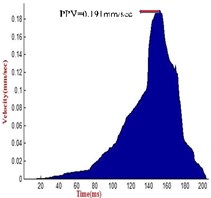
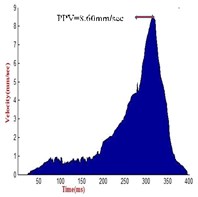
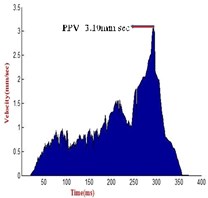
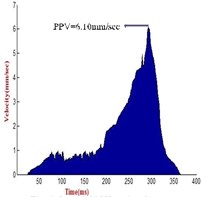
Fig. 8a) Recorded PPV at 500 m distance, b) recorded PPV at 150 m distance, c) recorded PPV at 300 m distance, d) recorded PPV at 200 m distance, e) recorded PPV at 400 m distance, f) recorded PPV at 500 m distance, g) recorded PPV at 600 m distance, h) recorded PPV at 750 m distance, i) recorded PPV at 150 m distance, j) recorded PPV at 500 m distance, k) recorded PPV at 150 m distance
a)
b)
c)
d)
e)
f)
g)
h)
i)
j)
k)
Similarly, the second blast PPV recorded at a distance of 150 m from blast face with 67 holes. Each hole depth of 10 m with a charge of 50 kg per hole on next day i.e., 9th March 2016. Spacing and the burden is 5 m and 4 m. After blasting, the recorded values are plotted in MATLAB shown in Fig. 8(b). the PPV observed at 4.16 mm/sec. the third blast PPV recorded at a distance of 300 m from blast face with 99 holes. Each hole depth of 10 m with a charge of 50 kg per hole. Spacing and the burden is 3 m and 4 m and The PPV is 3.52 mm/sec on 10th March 2016.The same process can be continued for all reaming blast events. Peak particle velocity (PPV) were recorded at different locations (monitoring points) from blast face and shown in Figs. 8(c)-8(k).
Table 1 depicts eleven recorded PPV with influenced parameters like distance, hole depth, charge per hole, spacing and burden on various days. the existing results were shown, the PPV at 150 m monitoring point was 8.60 mm/sec higher than other measuring points.
Table 1Recorded PPV at various distances
S. No | Date | Distance () in m | Hole depth (HD) in m | Charge per hole () in Kg | Burden () in m | Spacing () in m | Number of holes () | Peak particle velocity (PPV) (mm/sec) |
1 | 8/03/2016 | 500 | 10 | 50 | 3 | 4 | 64 | 1.62 |
2 | 9/03/2016 | 150 | 10 | 50 | 4 | 5 | 67 | 4.16 |
3 | 10/03/2016 | 300 | 10 | 50 | 4 | 3 | 99 | 3.52 |
4 | 11/03/2016 | 200 | 10 | 50 | 3 | 4 | 15 | 2.52 |
5 | 12/03/2016 | 400 | 9 | 55 | 3 | 5 | 80 | 2.05 |
6 | 14/03/2016 | 500 | 9.5 | 55 | 4 | 3 | 40 | 1.33 |
7 | 15/03/2016 | 600 | 10 | 30 | 3 | 4 | 96 | 0.873 |
8 | 16/03/2016 | 750 | 9.5 | 36.46 | 2.5 | 4 | 55 | 0.191 |
9 | 17/03/2016 | 150 | 9.5 | 50 | 4 | 3 | 130 | 8.60 |
10 | 18/03/2016 | 500 | 10 | 50 | 4 | 3 | 58 | 3.10 |
11 | 19/03/2016 | 150 | 9 | 34.6 | 4 | 3 | 63 | 6.10 |
8. Artificial neural network for predict ground vibration
ANNs are computational models based on the biological neural networks functioning. In ANNs process, the information flows through interconnected elements called as neurons placed in distinct layers of the network. Multilayer perceptron (MLP) is the best type of ANNs consists of minimum three layers called as an input layer, an output layer, and intermediate or hidden layers [15]. Every layer of ANNs consists of at least one node. The lines between the nodes represent the process of flow of information from one node to the next. In this paper ANNs approach aimed to compare the ground vibrations measured and predicted by the analytical program with the real data. Several predictor equations have been proposed by various researchers to predict ground vibration prior to blasting, but these are site specific and not generally applicable beyond the specific conditions. for prediction of peak particle velocity, Neural network has many approaches, one of is Back-propagation neural network.
8.1. Back-propagation neural network
A neural network must be trained before interpreting new information. Numerous algorithms are existing to train the neural network. One of the popular methods is Back-propagation. It gives effective learning process and least error. The Feed-forward back-propagation neural network (BPNN) contains two or more layers called input layer, hidden layer, and an output layer, as shown in Fig. 9. Every layer incorporates a number of processing elements(neurons) and each element is associated with the following layer through weights [5]. While train the neural network, information is processed from the input layer to output layer through the hidden layer. At the output layer, the predicted and measured values are compared and the found error sent back through the back-pass network for updating the individual weights of the connections and biases of the individual elements. The procedure has repeated for all train pairs to get a minimum mean-square error (MSE) and root-mean square error (RMSE) by using gradient descent algorithm [16, 17].
Fig. 9Back-propagation neural network [16]
![Back-propagation neural network [16]](https://static-01.extrica.com/articles/18647/18647-img22.jpg)
9. Network architecture
One of the objectives of the present work predicts the PPV from influence parameters such as distance, hole depth, spacing, burden and charge per hole. Here, Feed-forward network is considered as this architecture is reported to be suitable for problem-based on problem identification. A three-layer, feed-forward back propagation neural network consists of 6 input parameters, 5 hidden neurons, and one output parameters were trained. The number of input parameters taken was six for ANN and Multivariate regression analysis (MVRA). They were distance, hole depth, charge per hole, burden, spacing, and a number of holes. MVRA is a one of the well-known method used to derive the relationship between a dependent variable and one or more independent variables. MVRA model was developed based on the same input-independent variables and output-dependent variables as used in ANN model. This resulted in the following equation:
Table 2Error calculation of PPV predicted of ACC by ANN and MVRA
S. No | Recorded PPV | Predicted PPV by ANN | Standard error | Predicted PPV by MVRA | Standard error |
1 | 1.62 | 1.4166 | 0.2034 | 0.9698 | 0.6502 |
2 | 4.16 | 3.9887 | 0.1713 | 2.9968 | 1.1632 |
3 | 3.52 | 3.8264 | 0.3064 | 5.0004 | 1.4804 |
4 | 2.52 | 2.2262 | 0.2938 | 3.9994 | 1.4794 |
5 | 2.05 | 2.4248 | 0.3748 | 0.9898 | 1.0602 |
6 | 1.33 | 1.4988 | 0.1688 | 2.9854 | 1.6554 |
7 | 0.873 | 0.4962 | 0.3768 | 1.9684 | 1.0954 |
8 | 0.191 | 0.4122 | 0.2212 | 2.0012 | 1.8102 |
9 | 8.60 | 8.0008 | 0.5992 | 6.1288 | 2.4712 |
10 | 3.10 | 3.6254 | 0.5254 | 4.9866 | 1.8866 |
11 | 6.10 | 6.6888 | 0.5888 | 4.1212 | 1.9788 |
Table 2 shows the error calculation of PPV predicted by both ANN and MVRA. It shows that the error generated from a prediction in ANN is lesser than the statistical analysis. The maximum and minimum error generated by ANN was 0.5992 and 0.1688 respectively whereas the maximum and minimum error generated by MVRA was 2.4712 and 0.6502 respectively. Figs. 10-11 show the regression analysis of ANN and MVRA. The coefficient of determination () determined by ANN & MVRA was 0.9763 and 0.5246 respectively. Figs. 12-13 show the line graph comparison between the recorded and predicted PPV by ANN and MVRA and Figs. 14-15 depict the line and bar graph comparison between the recorded and predicted PPV by ANN and MVRA.
Fig. 10Regression analysis between recorded and ANN predicted PPV
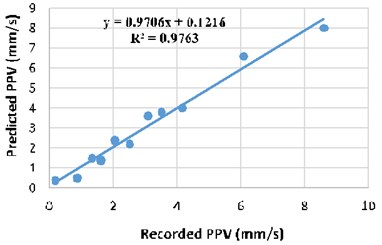
Fig. 11Regression analysis between recorded and MVRA predicted PPV
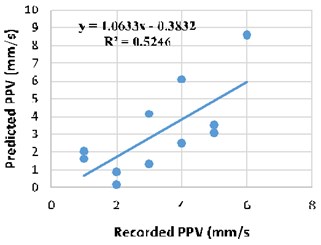
Fig. 12Recorded vs. ANN predicted PPV
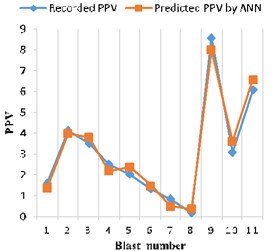
Fig. 13Recorded vs. MVRA predicted PPV
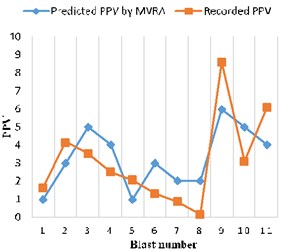
Fig. 14Comparison of PPV predictor models
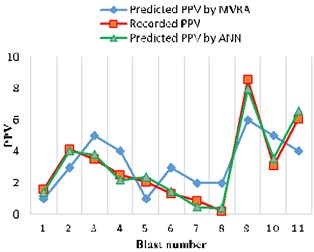
Fig. 15Comparison of PPV
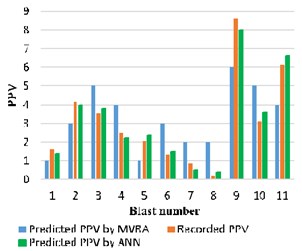
Table 3Predicted PPV at various distances from the source of blasting for different weights of explosive charge per blast
Total charge per blast (kg) | Predicted PPV (mm/sec) at different distances (m) | ||||||
At 100 m | At 200 m | At 400 m | At 600 m | At 800 m | At 1000 m | At 2000 m | |
750 | 3.53 | 3.01 | 2.55 | 1.67 | 1.24 | 1.02 | 0.56 |
1500 | 4.02 | 3.22 | 2.64 | 1.73 | 1.27 | 1.08 | 0.59 |
2000 | 4.11 | 3.41 | 2.68 | 1.78 | 1.33 | 1.12 | 0.61 |
3000 | 4.20 | 3.63 | 2.72 | 1.84 | 1.36 | 1.18 | 0.64 |
4000 | 4.44 | 3.73 | 2.78 | 1.88 | 1.42 | 1.23 | 0.67 |
5000 | 4.62 | 3.81 | 2.85 | 1.92 | 1.50 | 1.29 | 0.73 |
6000 | 4.86 | 3.89 | 2.91 | 1.95 | 1.60 | 1.33 | 0.77 |
7000 | 4.93 | 4.02 | 2.96 | 1.99 | 1.72 | 1.37 | 0.79 |
8000 | 6.21 | 5.11 | 4.01 | 3.04 | 2.82 | 1.42 | 0.81 |
10. Results and discussion
Back propagation ANN model with Levenberg-Marquardt training algorithm was considered and concluded that ANN model is more appropriate for prediction of PPV to protect surrounding environment and structure in the limestone mines. The parameters such as explosive and distance as input and PPV as output were considered in cases of ANN and predictor models. All the empirical equation shows less correlation value than that by ANN approach. Hence it is concluded that the ANN approach has strong potential to predict the PPV. The predicted PPV at different monitoring points around the mine are predicted shown in Table 3.
11. Conclusions
The final developed prototype system is a MEMS-based accelerometer sensor that can be installed in the mines as a wireless sensor network to monitor PPV of a blast-induced ground vibration. Eleven blast PPV values are captured at different distances from blast face. The real time data has been transmitted and monitored at the office. The PPV at 150 m monitoring point was recorded higher than other measuring points. ANN predicted PPV closely matches with the results of measured data. The results obtained by ANN are highly encouraging and satisfactory.
References
-
Singh T. N., Singh V. An intelligent approach to prediction and control ground vibration in mines. Geotechnical and Geological Engineering, Vol. 23, Issue 3, 2005, p. 249-262.
-
Afeni Thomas B., Osasan Stephne K. Assessment of noise and ground vibration induced during blasting operations in an open pit mine – a case study on Ewekoro limestone quarry, Nigeria. Mining Science and Technology (China), Vol. 19, Issue 4, 2009, p. 420-424.
-
Siskind D. Vibrations from blasting. International Society of Explosives Engineers Publisher, Vol. 10, Issue 3, 2000, p. 120.
-
Wiss J. F., Linehan P. W. Control of Vibration and Air Noise from Surface Coal Mines-III. US Bureau of Mines Report OFR, 1978, p. 623.
-
Khandelwal M., Singh T. N. Prediction of blast-induced ground vibration using artificial neural network. International Journal of Rock Mechanics and Mining Sciences, Vol. 46, Issue 7, 2009, p. 1214-1222.
-
Instantel Minimate Plus User Manual. Instantel Vibration Monitors. USA, 2010.
-
Kwon S. W., Kim J. Y., Yoo H. S., Cho M. Y. Wireless vibration sensor for tunnel construction. Proceeding of the 23rd International Symposium on Automation and Robotics in Construction, 2006.
-
Kim J. Y., Kwon S. W., Cho M. Y. Development of Wireless module for tunnel vibrating wire type sensor. Proceeding of the 24th International Symposium on Automation and Robotics in Construction Automation Group, 2007.
-
ZigBee User Manual. Digi, USA.
-
Kurytnik I., Borowik B., Karpinski M. Deploying ZigBee sensor network for vibration measurement. Proceeding of 10th International Conference-The Experience of Designing and Application of InCAD Systems in Microelectronics, 2009, p. 192-196.
-
DGMS Circulars, Directorate General of Mines Safety, India.
-
ADXL 345 User Manual, Analog Devices. Norwood, USA.
-
Sethuramalingam T. K., Vimalajuliet A. Design of MEMS based capacitive accelerometer. 2nd International Conference on Mechanical and Electrical Technology 2010, p. 565-568.
-
Sinha S., Shakya S., Mukhiya R., Gopal R., Pant B. D. Design and simulation of MEMS differential capacitive accelerometer. Proceeding of ISSS International Conference on Smart Materials, Structures and Systems, 2014.
-
Armaghani D. J., Hajihassani M., Mohamad E. T., Marto A., Noorani S. A. Blasting-induced fly rock and ground vibration prediction through an expert artificial neural network based on particle swarm optimization. Arabian Journal of Geosciences, Vol. 7, Issue 12, 2014, p. 5383-5396.
-
Khandelwal M. Evolution and Prediction of Blast-Induced Ground Vibration and Frequency for Surface Mine – A Neural Network Approach. Doctoral Dissertation, Department of Mining Engineering, Indian Institute of Technology, Bombay, India, 2008.
-
Nimaje D. S., Tripathy D. P. Assessment of fire risk of Indian coals using artificial neural network techniques. American Journal of Mining and Metallurgy, Vol. 3, Issue 2, 2015, p. 43-53.
Cited by
About this article

The authors would like to thank Prof. Singam Jayanthu, National Institute of Technology, Rourkela and also very grateful to Mr. Pratap Kishor Tandia and staff of ACC Dungri limestone mine for their invaluable support during the field investigation.
