Abstract
The recent proliferation of wireless sensor networks (WSNs) evolution into the Internet of Things (IoT) vision enables a variety of low-cost monitoring applications which allows a seamless transfer of information via embedded computing and network devices. Ambiguous ground vibration can be induced by blasting demolition is a severe concern which grievously damages the nearby dwellings and plants. It is an indispensable prerequisite for measuring the blast-induced ground vibration (BIGV), accomplishing a topical and most active research area. Thus, proposed and developed an architecture which emphasizes the IoT realm and implements a low-power wide-area networks (LPWANs) based system. Especially, using the available Long-Range (LoRa) Correct as Radio Frequency (RF) module, construct a WSN configuration for acquisition and streaming of required data from and to an IoT gateway. The system can wirelessly deliver the information to mine management and surrounding rural peoples to aware of the intensity of BIGV level. In this article, an endeavor has been made to introduce a LoRa WAN connectivity and proved the potentiality of the integrated WSN paradigm by testing of data transmission-reception in a non-line of sight (NLOS) condition. The path loss metrics and other required parameters have been measured using the LoRa WAN technology at 2.4 GHz frequency.
1. Introduction
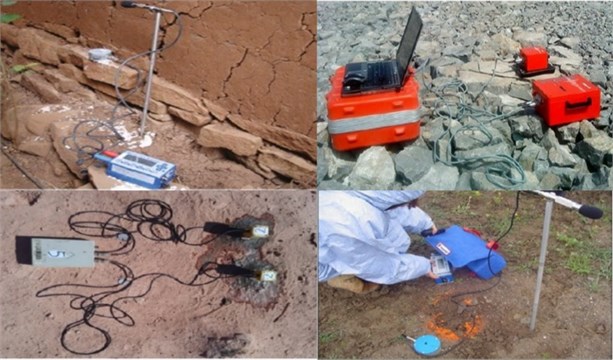
Information and Communications Technology (ICT) has been rapidly grown and shows a significant impact on ground vibration monitoring and leads to critical issues regarding the damages in the vicinity of the mining lease area. Drilling and blasting (D&B) is an inevitable method, which is the most widely-used excavation method for rock fragmentation. On the contrary, it has adverse side effects such as ground vibration, fly rock, and annoying noise, etc. The most intriguing part of blasting is that nearly 20-30 % of explosive energy has been used to fragment and displacement of rock mass, whereas the remaining 70-80 % of energy gets wasted away in the form of unwanted side effects such as ground vibrations, fly rock, noise, air noise, back break etc. [1]. In this context, monitoring of BIGV indicates a fundamental system to collect relevant information of intensity of vibration level, leads to basic knowledge and understanding. Over the past decades, multiple researchers, scientists, and academicians have been adopted by conventional monitoring systems to measure the BIGV in open cast mines. The most commonly available seismographs are Instantel Minimate Plus, Minimate Pro, UVS 1500, and MR 202-CE represents in Fig 1. However, the existing cable-based seismographs have some flaws such as: susceptible to failure due to breakage in the wire; wire impedance owing to the length of wire not possible to extend; cannot convey the retrieved data in real-time; expensive system; limited storage memory; need an expert to operate; tedious and time-consuming process [2].
To address these aforementioned flaws, we realize the necessity of design and develop an enhanced ground vibration monitoring system based on LoRa wireless technology can bring substantial success to secure the blasting mechanism. In particular, proposed and implemented WSN assisted an enhanced IoT architecture to overcome the abovementioned limitations. IoT is the conceive extension of the internet to physical objects: every “things” will be connected to the internet through cable or wireless links with a global address to create a single worldwide network of electronic devices [3]. Many authors have summarized the recent innovation of IoT with prominence on its critical challenges and future advances [4, 5]. Generally speaking, IoT envisions a capillary deployment of networked smart devices, which can serve different application domains such as biomedical, manufacturing, transportation, military, smart grids, smart retail, hazardous monitoring, agriculture and logistics [6]. The IEEE P2413 working group proposed a three-layer IoT architecture, namely, network, data communication, and sensing layer [7]. However, the primary constituent parts of any IoT system are data acquisition (DAQ), WSNs and communication, data analytics and processing, and internet [8]. Here, we concentrate on the entire WSN along with its communication section. Over the past few years, WSNs are extensively adopted in numerous applications such as healthcare, habitat monitoring, Navy service, and target tracking [9]. In particular, WSNs have been deployed in mines for different applications including safety, environmental monitoring, and miner tracking domains, which are utilized to collect and seamless transmission of data to a remote sink node efficiently [10-12]. Most of the authors widely used protocols in applications having less tight latency and reliability requirements, such as environmental monitoring, which consists of ZigBee (IEEE 802.15.4), Wi-Fi (based on IEEE 802.11), and Bluetooth (IEEE 802.15.1) WSNs which covers short range communication only. Thus, the integration of WSN architecture into IoT paradigm via a gateway is highly valuable to aware the vision of IoT and plays an important role in a variety of IoT-aided applications such as structural health, earthquake, and home appliances monitoring. In this context, adapted an IEEE 802.15.4 g protocol-aided LoRa WAN technology used for long-range communication.
Fig. 1Various seismographs deployed in mines to measure the ground vibration
A crucial survey has been conducted on the potential utilization and integration of WSN into IoT design. Few authors outline the possibility of integration of WSN and IoT paradigm in the field of environmental monitoring and healthcare system. To overcome the discussed concerns, real-time blast-induced vibration information is much needed for mining authority and the neighborhood rural people. On account of, propose a LoRa LPWAN-based IoT system to measure BIGV. The main contribution of this study includes:
– Detail study and investigation of the current state-of-the-art WSN-based IoT architecture and relevance power consumption of WSN in the area of blast-induced ground vibration monitoring and environmental applications.
– The long-range LoRa-assisted IoT architecture.
– Transmission of vibration information using long wireless coverage of LoRa devices (LPWAN).
– The evaluation and performance of LoRa transceivers within several propagation environment conditions with experimental validation.
In this context, the main aim of this study is to help mine administrations, blast experts, and nearby residing community to obtain real-time information such as BIGV data from an end user (sink node) through LoRa wireless sensor nodes. An IoT gateway such as GPRS/3G is considered at the sink node as a gateway for protocol conversion in between LoRa WAN and internet. The end users such as mine managers, experts of blasting as well as rural peoples who live in and around the mine area. Even though the current wireless sensor nodes have a long life operated battery and can function for a long time without charging, a solar-based panel is suggested to provide a long-time power source.
2. Previous works
Kwon et al. (2006) implemented a MEMS-based wireless blasting vibration sensor using Radio Frequency (RF) transmission to measure the ground displacement due to tunnel blasting. The designed sensor board equipped with an accelerometer sensor which is designed by themselves using MEMS fabrication technology, data logger, an amplifier circuit, and ZigBee chip [13]. Similarly, Kim et al. (2008) developed a low-cost Wireless and Automated Data Collection system (WADC) including an accelerometer sensor, ADC, and ZigBee module. The developed WADC sensor board especially measure for blast-induced ground vibrations for tunnel construction. The WADC was tested by installing a fifteen number of nodes over a twenty-meter long around the tunnel. The PC (i.e. receiver) along with ZigBee coordinator placed at pit-mouth of the tunnel and receives information in ten-seconds intervals [14]. In continuation to the previous results, Jung Yeol et al. (2013) have been implemented a tiny, low-cost, accurate sensor board based on TinyOS 2.0 platform embedding MCU, on 16-bit ADC, a low pass filter and a Chip Con 2420 chip for RF communication module to monitor the ground vibration due to blasting for tunnel construction. In this, every transmitter node was set up to send the data in a two-hundred-millisecond interval at 300 Hz sampling rate [15].
Lai et al. (2014) employed a WSN system to monitor the blast-induced vibration for the tunnel structure. This system equipped with UBOX-5016 vibration monitor, WLS9600 telemetry module and three-axis velocity sensor. The response of the event was analyzed by BM View software [16]. In 2014, Ooi et al. used ADXL 203CE accelerometer manufactured by Analog Devices to measure ground surface vibration during underground blasting. In their investigation, the two ADXL203 CE were validated measured at one second interval performed near the blast-radius of underground blast area at the Anderson Road Development Zone, Hong Kong [17]. Alvarado et al. (2016) designed a system to measure the Dust Particles after Blasting using SHARP GP2Y10 opto-electrical dust sensor and Dusttrak 8520 [18]. Zhong et al. (2016) proposed remote intelligent monitoring system for blasting vibration in Yangtze River Scinece Instistute, China [19]. The system conists of detector, blasting recorder, central server and terminal monitoring system at the end user. In 2018, Ragam and Nimaje have designed and developed a WSN blast-induced vibration monitoring system includes ADXL 345 accelerometer and ZigBee as RF module. The prototype was installed along with minimate plus seismograph at ACC Dungri limestone mine, India [20]. The authors [13-20] implemented a WSN system using RF modules such as ZigBee and ChipCon 2420 chip only. Moreover, the coverage range of these RF modules are low and did not discuss the IoT wireless connectivity. Therefore, we focus on the IoT-based BIGV system using LPWAN wireless connectivity named as LoRa.
3. Summary of WSNs contenders in IoT architecture
IoT is a global network architecture consists of various interconnected devices that depend on sensors, communication, network protocols, and information processing techniques [21]. Most of the monitoring applications in different areas rely on WSNs, inspired by the indisputable advantages such as lower costs instead of using cables, variable network topologies, scalability, and lower maintenance and commissioning expenses [22]. IoT can be constructed by many enabling technologies. LPWANs are emerging enabling technologies which enhance the wireless coverage area and reduce the power consumption. The main function of LPWANs provides a low-power long-distance wireless communication which wouldn’t provide by the other conventional network technology. LoRa is a physical layer remedy manufactured by Semtech, fulfill the LPWANs requirements with the help of chirp spreading spectrum modulation in the IoT environment [23]. Long Range Wide Area Network (LoRaWAN) is a standard network protocol that reduces message exchanges. LoRa device provides around 15 km wireless coverage area as well as ten years of battery life time. For this reason, LoRa and LoRaWAN can provide the best suitable network environment for battery-operated devices and most popularly used LPWAN network technologies in the present scenario [24]. In this context, a brief discussion on LoRa as an RF module compares to other IoT assisted enabling technologies. A seamless communication offered by the convergence of cloud computing with IoT provides an enormous opportunity in device interconnectivity. To enhance the connectivity for the things and end-users in the IoT environment, different kind of enabling technologies are existed and utilized. The basic cellular communication devices like GSM/CDMA/WCDMA/3G/4G can provide a long wireless coverage area and less power. Similarly, multiple types of ZigBee, Wi-Fi, Bluetooth protocols and 6LOWPAN are most widely used in the IoT architecture due to less-power consumption [25]. However, LPWAN technologies: LoRa, SigFox, and Narrowband IoT (NB-IoT) are the most prepared candidates for IoT paradigm including BIGV monitoring application owing to their wide area connectivity, scalability, long distance coverage, less power consumption, easy installation, and inexpensive. Table 1 summarized the LPWAN emerging enabling IoT technologies and the technical aspects of LoRaWAN, NB-IoT, and SigFox.
Wireless range is a prerequisite for any application to transverse longer distances. Usually, repeaters are the most widely used devices to complement coverage area extension. Nevertheless, LoRa provides a long-range coverage with help of CSS modulation. The receiver’s sensitivity must have minimum power levels where the receiver is able to capture and demodulate the wireless transmission data [27]. The sensitivity of the receiver can be expressed as:
where, is defined as signal-to-noise ratio, is the bandwidth, and is the noise floor. The LoRa receiver sensitivity is given by (at room temperature) [28]:
where, –174 represents thermal noise at 1 Hz bandwidth. The spreading factor of LoRa values as high as –138 dBm of receiver sensitivity which shows a larger coverage area over other enabling WSNs. Besides, the LoRa module decoded signals and SNR within –20 dBm only.
3.1. Performance evaluation of ZigBee RF module
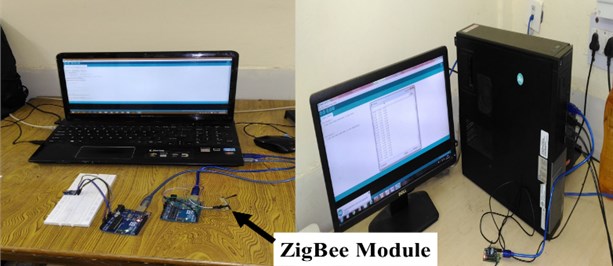
Connectivity is a fundamental building block of any IoT architecture. Multihop short-range wireless technologies, including ZigBee, Wi-Fi, Bluetooth, and EnOcean have been considered a feasible way to implement IoT devices. Moreover, these technologies are characterized by less energy consumption, which is a basic necessity for any IoT applications. In this context, an IEEE 802.15.4, well known as ZigBee (short range, low power 2.4 GHz wireless protocol) has been considered and evaluate the potential of ZigBee wireless range by range test, performed in an indoor environment. The main aim of this test is to know the coverage area of the ZigBee module. In this test, there are two kinds of nodes. One is being used as a transmitter node (TN) which is connected to the PC through RS-232 USB cable and other as a receiver node (RN), which is standalone with ZigBee mote only. Both nodes have an omnidirectional antenna operated on 2.4 GHz frequency. The configuration setup of the ZigBee module into the transmitter and the receiver node is depicted in Fig. 3. The configuration of the transmitter (TN) and receiver node (RN) are in point-to-point using X-CTU software tool. The evaluation metric of ZigBee range test is taken as received signal strength Indicator (RSSI). The RSSI is a measure that indicates the energy level during the reception of a packet. It is important to note that the RSSI is available only after a packet has been received [29].
Fig. 2Detailed floor plan of building for RSSI measurement
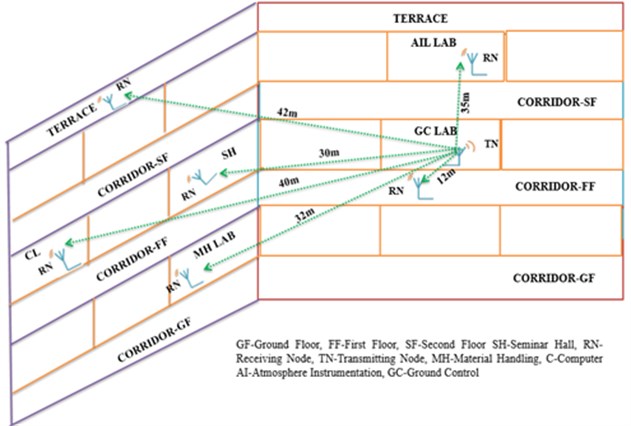
Fig. 3Configuration setup of transmitter and receiver node
An indoor based evaluation range test has been performed in the Mining Engineering department building of NIT Rourkela, India. Where the transmitter node has been fixed in the ground control (GC) lab and intended receiver node was placed at variable locations. Fig 2. represents the overview and floor plan of the department building. The performance of range tests on the department floor have been conducted over a short period of time only. If the RSSI value between the TN and the RN is higher, loss of packet data ensues, and communications cannot be established. The performance evaluation of wireless range test in terms of measurement of RSSI value and distance between the receiver and transmitter node is depicted in Table 2. it demonstrates RSSI measurement results for the indoor scenario. The RSSI values are decays at Terrace and Ground floor (MH Lab) compared to the same floor cases. Referring to Table 2, the packets are well received to the RN node (receiver locations) on the same floor over other positions. However, the data transmission was not good in the ground and top floor as can be seen from the low RSSI values –82 dBm at AI Lab, –87 dBm at the Terrace, and –85 dBm at MH Lab, respectively. Similarly, the pocket reception is not well, while the RN node has positioned in front of the Mining department building. The outcomes of a range test of the ZigBee RF module reveal that it is not helpful for long-range wireless communication due to its low RSSI and high packet loss. The long-range data transmission reliability is essentially requisite to measure the BIGV in open cast mines. Often, the distance between the blast site to the monitoring station is too long (more than 1km) and requires one or more routers (repeaters) to seamless data transmission to the destination. While process running, there may be chances of failures like limited packets are retrieved (i.e. a number of repeaters), failure of a node due to time synchronization, etc. Therefore, adopted a LoRa WAN technology over others owing to the ultra-long-range wireless communication, low power consumption, and long battery life, easy installation, and inexpensive.
Table 1Summary of LPWAN network technologies [26]
Parameter | SigFox | LoRaWAN | NB-IoT |
Modulation | BPSK | CSS | QPSK |
Frequency | Unlicensed ISM bands (868 MHz in Europe, 915 MHz in North America, and 433 MHz in Asia) | Unlicensed ISM bands (868 MHz in Europe, 915 MHz in North America, and 433 MHz in Asia) | Licensed LTE frequency Bands |
Bandwidth | 100 Hz | 250 kHz and 125 kHz | 200 kHz |
Maximum data rate | 100 bps | 50 kbps | 200 kbps |
Bidirectional | Limited / Half-duplex | Yes / Half-duplex | Yes / Half-duplex |
Maximum messages/day | 140 (UL), 4 (DL) | Unlimited | Unlimited |
Maximum payload length | 12 bytes (UL), 8 bytes (DL) | 243 bytes | 1600 bytes |
Range | 10 km (urban), 40 km (rural) | 5 km (urban), 20 km (rural) | 1 km (urban), 10 km (rural) |
Interference immunity | Very high | Very high | Low |
Adaptive data rate | No | Yes | No |
Handover | End-devices do not join a single base station | End-devices do not join a single base station | End-devices join a single base station |
Localization | Yes (RSSI) | Yes (TDOA) | No (under specification) |
Allow private network | No | Yes | No |
Standardization | Sigfox company is collaborating with ETSI on the standardization of Sigfox-based network | LoRa-Alliance | 3GPP |
Table 2Range test description
From the location of the transmitter node | |||||
S No | Position | Height (m) | Depth (m) | Point to point distance (m) | RSSI (dBm) |
1 | Model Preparation (MP) Lab | 0 | 0 | 12 | –31 |
2 | Seminar Hall (SH) | 0 | 0 | 30 | –36 |
3 | Computer Lab (CL) | 0 | 0 | 40 | –59 |
4 | Atmosphere Instrumentation (AI) Lab | 10 | 0 | 35 | –82 |
5 | Terrace | 10 | 0 | 42 | –87 |
6 | Material Handling (MH) Lab | 0 | 10 | 32 | –85 |
4. Proposed system architecture
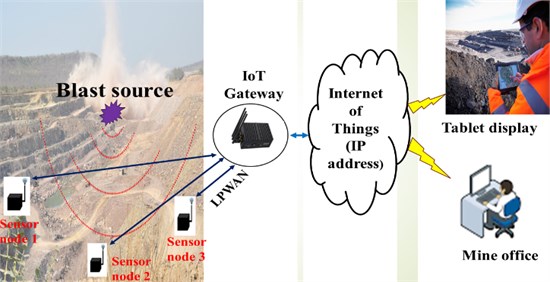
The International Telecommunication Union endorses that IoT architecture having five types of layers such as sensing, accessing, networking, middleware, and application layers [30]. Atzori et al. [31] developed a three-layered architectural model for IoT which consists of the application layer, the network layer, and the sensing layer. Sensing layer consists of a number of sensors which are sensing physical quantities. In this context, using a high sensitivity ADXL 203 accelerometer sensor to capture low amplitude ambiguous ground vibration induced by blasting operation. Data communication network layer treats as a medium between the sensing layer and end users (application layer). The majority of the authors have been employed ZigBee, Wi-Fi and Bluetooth devices for making data communication. The coverage distance between nodes in this kind of devices varied from a few meters to about 100 meters, depending on the nearby environment. Thus, we are utilizing a LoRa WAN network communications to establish a seamless data transmission between the sensing layer and the application layer. Fig. 4 represents the proposed system architecture with Lora WAN vision. Every sensor node consists of an accelerometer sensor, a microcontroller unit, and a LoRa RF module. These nodes are deployed at different vulnerable and strategic locations from blast-source. An IoT gateway (3G/GPRS) can receive the messages from the sensor nodes via the LoRa channel and transmits the ground vibration information to the network server through the standard IP protocols. The network server examines the validity of the retrieved message and conveys the information to the end users (application server). The application server uses the data to provide the application to the user. Figs. 5 and 6 depict the sensor node and receiver node hardware structure using LoRa technology, respectively.
Fig. 4Architecture of the proposed system
4.1. An overview of LoRa
LoRa is a physical layer LPWAN technology that facilitates long-range connectivity, especially for the IoT paradigm. It is designed and developed by Semtech Corporation, which also manufactures the chipsets [32]. It can modulate the signal within the sub-GHz ISM band based on a proprietary spread spectrum technique. Mostly LPWANs work in the unlicensed ISM bands such as 863-870 MHz band in Europe, 902-928 MHz band in North America, 433 MHz in Asia, and 2.4 GHz band. The bidirectional wireless communication has been established using the chirp spread spectrum (CSS) modulation. The spread technique has encoded the signal in the longer sequence of bits, thus the resulting signal has a low signal-to-noise-plus-interference ratio, enables huge interference resilience, and very tough to detect essentially at the receiver for getting correct reception. The length of the spreading code is almost equal to 2SF, where SF defines as a tunable parameter also known as the spreading factor. It can be varied in the range of 7 to 12. For this reason, it provides possible variable data rates and the trade throughput for long coverage range, robustness link, or power consumption [26]. Lora WAN technology is indeed an example for short-range devices along with cellular coverage ranges, on the order of 10-15 km in rural areas and 2-5 km in urban areas. The nominal sensitivity ranges of ZigBee and Bluetooth receivers are around –125 dBm and –90 dBm, respectively. Whereas, the typical sensitivity of a Lora WAN receiver is about –150 dBm [33]. Thus, it makes more preferable compared to other existing IoT enabling wireless protocols in the line of sight (LOS) as well as non-line of sight (NLOS) applications. In this work, we employed a Semtech SX1278 LoRa device along with evaluation boards and transceiver antenna works in the license-free frequency band of 2.4 GHz ISM band.
5. Procedure for implementation of BIGV monitoring system
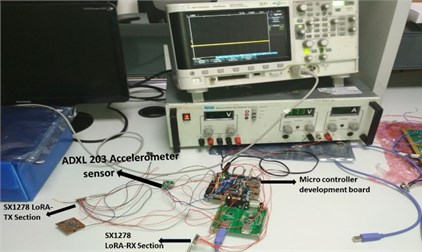
This section covers an overview of the implementation of the BIGV system in a comprehensive manner. The designed system has a feasible provision that it encourages the reprogramming of transceiver nodes in terms of unicast, multicast, or broadcast modes of communication on the basis of future need. Primarily, implemented BIGV system dissemination through GPRS gateway, transmission, and reception LoRa device. The procedure of the proposed system model is illustrated in Figs. 5 and 6. An application program interface is created between the GPRS gateway and a sensor node part. It is able to get BIGV information in terms of peak particle velocity and dispatched which displays in the mobile or PC. Fig. 7 demonstrates the implementation of BIGV monitoring system in the laboratory. The Semtech SX 1278 LoRa module adopted as an RF device and interfaced to LPC1768 MCU. Before the establishment of seamless communication, allocate the location ID to the receiver and obtain the information by sending an HTTP request via the gateway. The LoRa device can send the packet to end-users.
Fig. 5Sensor node architecture using LoRa device
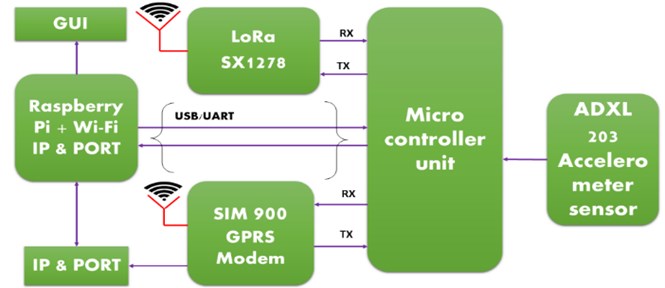
Fig. 6Receiver node architecture using LoRa device
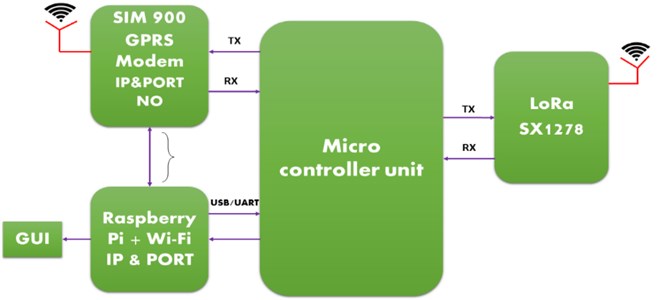
Fig. 7Experimental setup of BIGV system in Lab
6. Evaluating the performance using LoRa deployment test
In this section, an experimental observation based on a series of small-scale deployments of the LoRa system has been discussed. The experiment was conducted in various transmission ranges by considering NLOS path in between the transmitter and receiver of the SX1278 LoRa devices. In this context, to evaluate the capabilities LoRa system in terms of its coverage range and quality, two types of tests were carried out in different environments, namely, Indoor-to-Outdoor (I2O) and Outdoor-to-Outdoor (O2O) scenarios at the National Institute of Technology, Rourkela, India. The deployment area comprises of department dwellings (up to 3-4 floors), roadside trees on two sides, and intersections with single lane roads. The temperature was 30 °C, and the ambient humidity was 65 %. Meanwhile, in the evolution test, RF signals would not interfere with the same frequency band. Transmitter and receivers had been configured by giving a source, destination address, and payload. They have 8 dBi gain omnidirectional antenna working on the 2.4 GHz frequency band. The transmission power of the module was set to 20 dBm in order to limit the distance to cover before reaching low RSSIs. In each case, the measurement values are obtained in terms of RSSI and signal-to-noise ratio (SNR) for every two seconds interval in the devices. To this end, packet transmission and reception range test evaluated by the following parameters such as path loss versus logarithmic distance, receiver signal level profile, and achieved SNR.
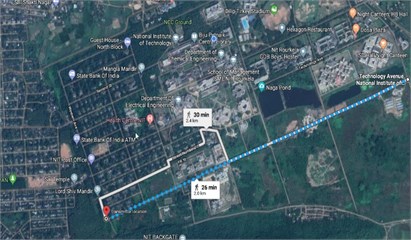
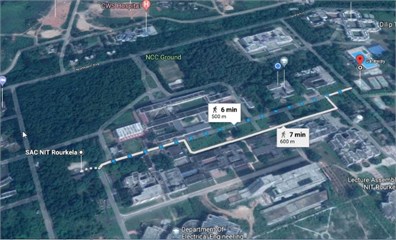
Fig. 8Coverage plan using LoRa system and blue colored dots represent of the measurement locations
a) O2O environment
b) I2O environment
Extensive measurements were captured at strategic distances between transmitter and receiver nodes for both schemes and are shown in Fig. 8. In each case, the transmitter was kept constant while the receiver was a variable. Although, 8 and 20 various locations were measured for both I2O and O2O cases, respectively. The transmitter node has been connected to a PC which is placed in the basketball court and eight different test points were chosen, with the distance to the transmitter position in I2O case. The transmitter and receiver nodes consist of an average antenna height of 1 m. Fig. 10 shows the different locations of the receiver to determine the RSSI and SNR values. In the case of O2O, the transmitter was fixed on the twig of a tree, an average height being 15 m above the surface of the earth, while the receiver nodes were placed at different strategic distances illustrated in Fig. 9. To this end, packets were sent from a LoRa device to the receiver node, and the RSSI of received packets were recorded while moving the receiver location.
Table 3LoRa characteristics in O2O case
S No | Distance from transmitter node (m) | Average RSSI (dBm) | Average SNR (dBm) |
1 | 100 | –82 | 6 |
2 | 200 | –99 | 6 |
3 | 300 | –102 | 6 |
4 | 400 | –105 | 6 |
5 | 500 | –110 | 5 |
6 | 600 | –116 | 2 |
7 | 700 | –125 | –6 |
8 | 800 | –128 | –7 |
9 | 900 | –128.45 | –8 |
10 | 1000 | –125 | –3 |
11 | 1100 | –127 | –6 |
12 | 1200 | –127.84 | –5 |
13 | 1300 | –127.34 | –4 |
14 | 1400 | –126 | –4 |
15 | 1500 | –132 | –7 |
16 | 1600 | –127 | –6 |
17 | 1700 | –126.65 | –8 |
18 | 1800 | –124 | –4 |
19 | 1900 | –126 | –4 |
20 | 2000 | –130 | –8 |
Fig. 9Experimental setup to assess LoRa coverage at different locations in O2O
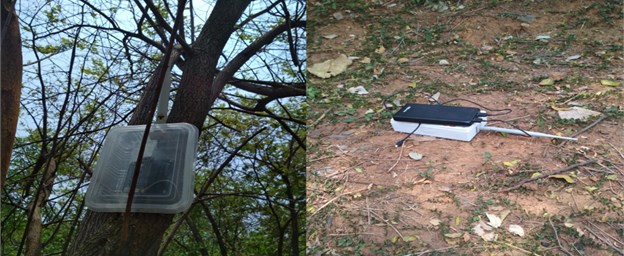
Fig. 10Experimental setup to assess LoRa coverage at different locations in I2O
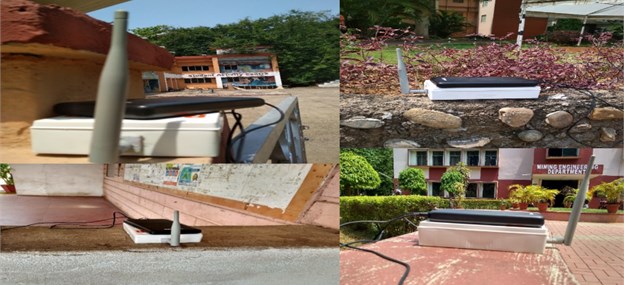
Table 4LoRa characteristics in I2O case
S No | Receiver location | Distance from transmitter node (m) | Average RSSI (dBm) | Average SNR (dBm) |
1 | Mining engineering department | 150 | –90 | –5 |
2 | Geo tech lab (inside mining dept) | 165 | –116 | 1 |
3 | Advance geo mechanics lab (inside mining dept) | 175 | –120 | –4 |
4 | Workshop | 250 | –95 | –6 |
5 | Nescafe shop | 300 | –112 | –1 |
6 | Department of MME | 350 | –118 | –2 |
7 | Department of CSE | 550 | –121.75 | –5 |
8 | SAC center | 600 | –125 | –2 |
7. Path loss modelling
In this study, the radio frequency (RF) model was developed and the path loss of LoRa wireless signal at 2.4 GHz has been determined experimentally at NIT Rourkela. A significant term in predicting the wireless-transmission coverage range is path loss, represents a signal attenuation in decibels (dB). Path loss is defined as the variation between the transmitted and the received powers at the antenna. The relation between path loss of transmitter and receiver nodes can be expressed as follows [34-41]:
where, is the transmitted power (dBm), is the received power (dBm), is the transmitter gain (dBi), and is the receiver gain (dBi). The specified values of each and is equal to 8 dBi.
The wireless radio propagation models are divided into three ways: free space, two-ray-reflection ground, and log-distance. The free space propagation model is a simplified model that assumes line-of-sight (LOS) communication between the transmitter-receiver pair and there is no intervening obstruction. The Two-Rays Ground Reflected model predicts the path losses between a transmitting antenna and a receiving antenna when they are in LOS. The log-distance path loss model predicts the path loss a signal encounters inside a building or densely populated areas over distance. In this context, we have conducted an experiment in an urban environment which consists of buildings and roadside trees. For this reason, we consider a Log-Distance path loss model [30,35,37] to determine the predicted path loss and formally expressed as:
where, is the near-earth reference distance. is a zero-mean Gaussian random variable in decibels and is a standard deviation. If the devices are stationary, you can ignore the effects of . The value of depends on the surrounding or propagation environment as per Eq. (4) and considered as three [37]. is the path loss at a near-earth reference distance and defined as:
Calculating the value of path loss at a distance of 1m using Eq. (5) and plugging it into Eq. (4) results in:
where, is the operation frequency of the propagation model and standard deviation (SD) can be calculated as:
where, represents the different RSSI values recorded at each distance , is the mean RSSI, and is the total number of observations (i.e. 20). The integer variables and n both vary from 1 to 20.
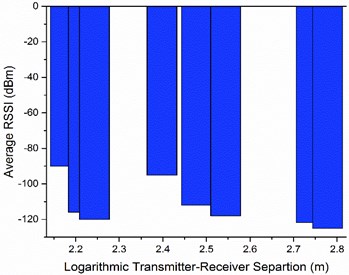
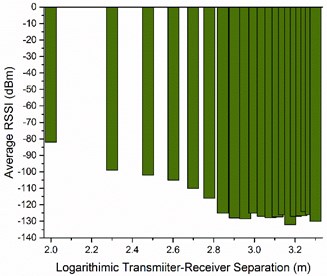
Fig. 11a) Average RSSI in I2O environment, b) Average RSSI in O2O environment
a)
b)
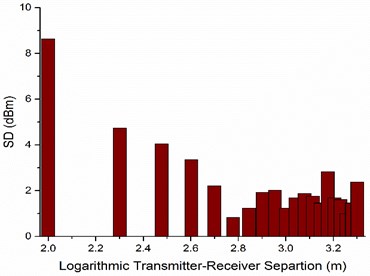
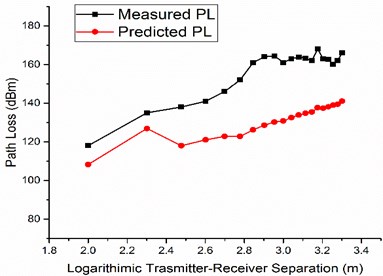
Fig. 12a) Variation of SD, b) Measured and predicted path loss in O2O environment
a)
b)
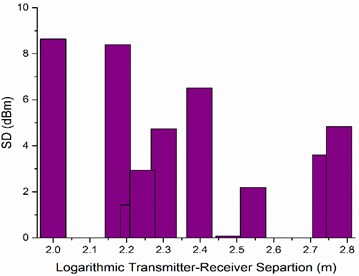
Fig. 13a) Variation of SD, b) Measured and predicted path loss in I2O environment
a)
b)
8. Results and discussion
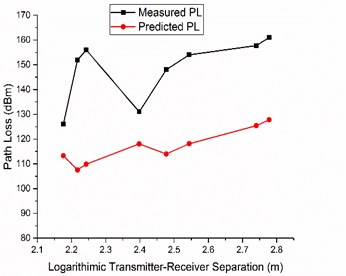
Tables 3 and 4 represents the obtained RSSI and SNR results for both O2O and I2O environment, respectively. It can be elucidated that the RSSI value has been decreasing faster in O2O as compared to I2O. Referring to Table 4, the data has been received in a good manner in I2O environment even though it was placed inside the Mining department building (location 2 and 3). On the contrary, the RSSI values were changed drastically due to obstacles in the case of O2O. The packets were received well up to the sixth location, later on, the reception rate was not good as observed from the low RSSI and SNR value of –125 dBm and –6 dBm, respectively. The average standard deviation (SD) values were measured for both the cases and found as 2.398 and 3.082 O2O and I2O, respectively (Figs. 12(a) and 13(a)). Besides, graphically demonstrates the measured and predicted path loss for both I2O and O2O scenarios as depicted in Figs. 12(b) and Fig. 13(b), respectively.
9. Conclusions
The LoRa-assisted IoT system using new emerging LoRa WAN technology and other embedded computing modules has been discussed in detail. Especially, the design and development of a BIGV monitoring system based on LoRa wireless RF communication. In particular, a comprehensive performance empirical evaluation of LoRa WAN technology with a single gateway and a single network server has been performed in different realistic environments. The proposed inexpensive IoT-based BIGV monitoring system provides blast-induced ground vibration information during the blasting time in open cast mine. Thus, the blasting experts will be well aware of the ground vibration intensity level and consequently, a change in the blasting pattern to reduce the ground vibration intensity.
In this article, two typical propagation scenarios such as I2O, and O2O was evaluated with the aim of employing their adversity to transmission-reception, and accordingly, their impact on the performance of the LoRa system. The experimental and theoretical empirical evaluation of LoRa data transmission-reception was measured and validated for both the cases. The results of an experimental test of both LoRaWAN and ZigBee protocol reveals that the LoRa WAN paradigm has a great potential standard and as an enabler for open cast mines and remote area environments, which can greatly benefit from long-range links. The results of the evaluation test can conclude that it can able to cover the NIT academic area and its premises and observed any pocket loss except at a few receiver locations due to environmental conditions and obstacles.
The average values of RSSI obtained were around –119 dBm at all measured points in O2O, whereas –112.4 dBm for the I2O environment. The measured average SNR values were –3 dBm and –2.45 dBm for I2O and O2O scenarios, respectively. Similarly, the average measured and predicted path loss was 148.23 dBm and 116.75 dBm in the case of I2O. On the contrary, the average measured and predicted path loss was found and the values were 151.71 dBm and 130.24 dBm for the O2O, respectively. However, the low power, inexpensive, low data rate, and LoRa assisted WSN system can be integrated into a cloud platform for each private and public network to accomplish optimal resource utilization and real-time data accessibility from anywhere.
References
-
Khandelwal M., Singh T. N. Prediction of blast-induced ground vibration using artificial neural. International Journal of Rock Mechanics and Mining Science, Vol. 46, Issue 7, 2009, p. 1214-1222.
-
Ragam P., Sahebraoji N. D. Application of MEMS-based accelerometer wireless sensor systems for monitoring of blast-induced ground vibration and structural health: a review. IET Wireless Sensor Systems, Vol. 9, Issue 3, 2019, p. 103-109.
-
Roadmap for the Future. Internet of Things in 2020, http://www.smart-systems integration.org/public/internet-of-things.
-
Wang F., Hu L., Hu J., Zhou J., Zhao K. Recent advances in the internet of things: multiple perspectives. IETE Technical Review, Vol. 34, Issue 2, 2017, p. 122-132.
-
Gupta R., Gupta R. ABC of internet of things: advancements, benefits, challenges, enablers, and facilities of IoT. Proceedings of Symposium on Colossal Data Analysis and Networking (CDAN) Indore, India, 2016.
-
Scilimati V., Petitti A., Boccadoro P., Colella R., Di Paola D., Milella A., Grieco L. A. Industrial Internet of things at work: a case study analysis in robotic-aided environmental monitoring. IET Wireless Sensor Systems, Vol. 7, Issue 5, 2017, p. 155-162.
-
IEEE P2413 standard for an architectural framework for the internet of things (IoT). IEEE Standard Association, https://standards. ieee.org/develop/project/2413.html.
-
Mehmood N. Q., Culmone R., Mostarda L. A. flexible and scalable architecture for real-time ANT+ sensor data acquisition and NoSQL storage. International Journal of Distributed Sensor Networks, Vol. 12, Issue 5, 2016, p. 3651591.
-
Dagdeviren O., Korkmaz I., Tekbacak F., Erciyes K. A survey of agent technologies for wireless sensor networks. IETE Technical Review, Vol. 28, Issue 2, 2011, p. 168-184.
-
Bandyopadhyay L. K., Chaulya S. K., Mishra P. K., Choure A., Baveja B. M. Wireless information and safety system for mines. Journal of Scientific and Industrial Research, Vol. 68, Issue 5, 2009, p. 107-117.
-
Li M., Liu Y. Underground coal mine monitoring with wireless sensor networks. ACM Transactions on Sensor Networks (TOSN), Vol. 5, Issue 2, 2009, p. 10.
-
Zhang Y., Yang W., Han D., Kim Y. I. An integrated environment monitoring system for underground coal mines – wireless sensor network subsystem with multi-parameter monitoring. Sensors, Vol. 14, Issue 7, 2014, p. 13149-13170.
-
Kwon S. W., Kim J. Y., Yoo H. S., Cho M. Y. Wireless vibration sensor for tunnel construction. Proceeding of the 23rd International Symposium on Automation and Robotics in Construction, Tokyo, 2006, p. 614-620.
-
Kim J. R., Yoo H. S., Kwon S. W., Cho M. Y. Integrated tunnel monitoring system using wireless automated data collection technology. Proceeding of 25th International Symposium on Automation and Robotics in Construction, Vilnius, Lithuania, 2008, p. 373-342.
-
Kim J., Kwon S., Park S., Kim Y. A MEMS-based commutation module with vibration sensor for wireless sensor network-based tunnel-blasting monitoring. KSCE Journal of Civil Engineering, Vol. 17, Issue 7, 2013, p. 1644-1653.
-
Lai J., Fan H., Chen J., Qiu J., Wang K. Blasting vibration monitoring of undercrossing railway tunnel using wireless sensor network. International Journal of Distributed Sensor Networks, Vol. 11, Issue 6, 2015, p. 703980.
-
Ooi G. L., Wang Y. H. Applying MEMS accelerometers to measure ground vibration and characterize landslide initiation features in laboratory flume test. Proceedings of Geo congress, Geo-Characterization and Modelling for Sustainability, Atlanta, Georgia, 2014, p. 2019-2028.
-
Alvarado M., Gonzalez F., Fletcher A., Doshi A. Towards the development of a low cost airborne sensing system to monitor dust particles after blasting at open-pit mine sites. Sensors, Vol. 15, Issue 8, 2015, p. 19667-19687.
-
Zhong M. S., Xie Q. M., Liu Y., Wu J. Y., Liu H. Q. Research status and prospect of remote intelligent monitoring system for engineering blasting vibration. Proceeding of 6th International Conference on Machinery, Materials, Environment, Biotechnology and Computer, China, 2016, p. 1444-1447.
-
Ragam P., Nimaje, D. S. Monitoring of blast-induced ground vibration using WSN and prediction with an ANN approach of ACC dungri limestone mine, India. Journal of Vibroengineering, Vol. 20, Issue 2, 2018, p. 1051-1062.
-
Tan L., Wang N. Future internet: the internet of things. Proceeding of 3rd International Conference on Advanced Computer Theory Engineering (ICACTE), Chengdu, China, 2010, p. 376-380.
-
Lin H. H., Tsai H., Chan T. C., Chu, Y. S., Chen Y. C., Liao T. S., Fang Y. M., Lee B. J., Lee H. C. An open-source wireless mesh networking module for environmental monitoring. Proceeding of IEEE Instrumentation and Measurement Technology Conference (IMTC), 2015, p. 1002-1007.
-
A Technical Overview of LoRa and LoRaWAN, LoRa Alliance. San Ramon, CA, USA, 2015, https://docs.wixstatic.com/ugd/eccc1a_ed71ea1cd969417493c74e4a13c55685.pdf.
-
Kim J., Song J. A. Secure device-to-device link establishment scheme for LoRaWAN. IEEE Sensor Journal, Vol. 18, Issue 5, 2018, p. 2153-2160.
-
Mahmoud M. S., Mohamad A. A. A study of efficient power consumption wireless communication techniques/modules for internet of things (IoT) applications. Advances in Internet Things, Vol. 6, 2016, p. 19-29.
-
Mekki K., Bajic E., Chaxel F., Meyer F. A comparative study of LPWAN technologies for large-scale IoT deployment. ICT Express, Vol. 5, Issue 1, 2019, p. 1-7.
-
Reda H. T., Daely P. T., Kharel J., Shin S. Y. On the application of IoT: meteorological information display system based on LoRa wireless communication. IETE Technical Review, Vol. 35, Issue 3, 2017, p. 256-265.
-
Semtech Corporation SX1272/3/6/7/8. LoRa Modem Designer’6s Guide. Semtech Corporation, https://www.semtech.com/images/datasheet/LoraDesignGuide_STD.pdf.
-
Kacz P., Hyneica O., Fiedler P., Bradaeora Z., Kucera P. Range test with ZigBee in indoor environments. Proceeding of IFAC Programmable Devices and Embedded Systems, Czech Republic, 2006, p. 447-451.
-
Xu L., He W., Li S. Internet of things in industries: a survey. IEEE Transactions on Industrial Informatics, Vol. 10, Issue 4, 2010, p. 2233-2243.
-
Atzori L., Iera A., Morabito G. The internet of things: a survey. Computer Network, Vol. 54, Issue 15, 2010, p. 2787-2805.
-
Berni A., Gregg W. O. On the utility of chirp modulation for digital signaling. IEEE Transactions on Communication, Vol. 21, Issue 6, 1973, p. 748-751.
-
Centenaro M., Vangelista L., Zanella A., Zorzi M. Long-range communications in unlicensed bands: The rising stars in the IoT and smart city scenarios. IEEE Wireless Communication, Vol. 23, Issue 5, 2016, p. 60-67.
-
Rappaport T. S. Wireless Communications: Principles and Practice. Upper Saddle River, Prentice Hall PTR, 1996.
-
Goldhirsh J., Vogel W. J. Handbook of Propagation Effects for Vehicular and Personal Mobile Satellite Systems. Chapter 11.3, Report A2A-98-U-0-021, Applied Physics Laboratory, Johns Hopkins University, http://vancouver.chapters.comsoc.org/files/2016/05/handbook.pdf, 1998.
-
Seybold J. Introduction to RF Propagation. Hoboken, Wiley Interscience, 2005.
-
Chrysikos T., Georgopoulos G., Kotsopoulos S. Wireless channel characterization for a home indoor propagation topology at 2.4 GHz. Proceeding of Wireless Telecommunications Symposium (WTS), New York, 2011.
-
Patri A., Nimaje D. S. Radio frequency propagation model and fading of wireless signal at 2.4 GHz in an underground coal mine. Journal of Southern African Institute of Mining and Metallurgy, Vol. 115, Issue 7, 2015, p. 629-636.
-
Wang D., Song L., Kong X., Zhang Z. Near-ground path loss measurements and modeling for wireless sensor networks at 2.4 GHz. International Journal of Distributed +Sensor Network, Vol. 8, 8, p. 2012-969712.
-
Sarma A. D., Pandit S. N. N., Prasad M. V. S. N. Modelling of path loss using adaptive propagation technique for land mobile CM and MM wave communication systems. IETE Technical Review, Vol. 17, Issues 1-2, 2000, p. 37-41.
-
Different Path loss models, https://www.edn.com/design/communications-networking/4315911 /Estimating-the-ZigBee-transmission-range-ISM-band.
About this article
The authors would like to thank Guntha Karthik and Devendra Kumar Yadav, Ph.D. Scholars, National Institute of Technology, Rourkela for their invaluable support during the performance evaluation test of LoRa and ZigBee RF modules.
