Abstract
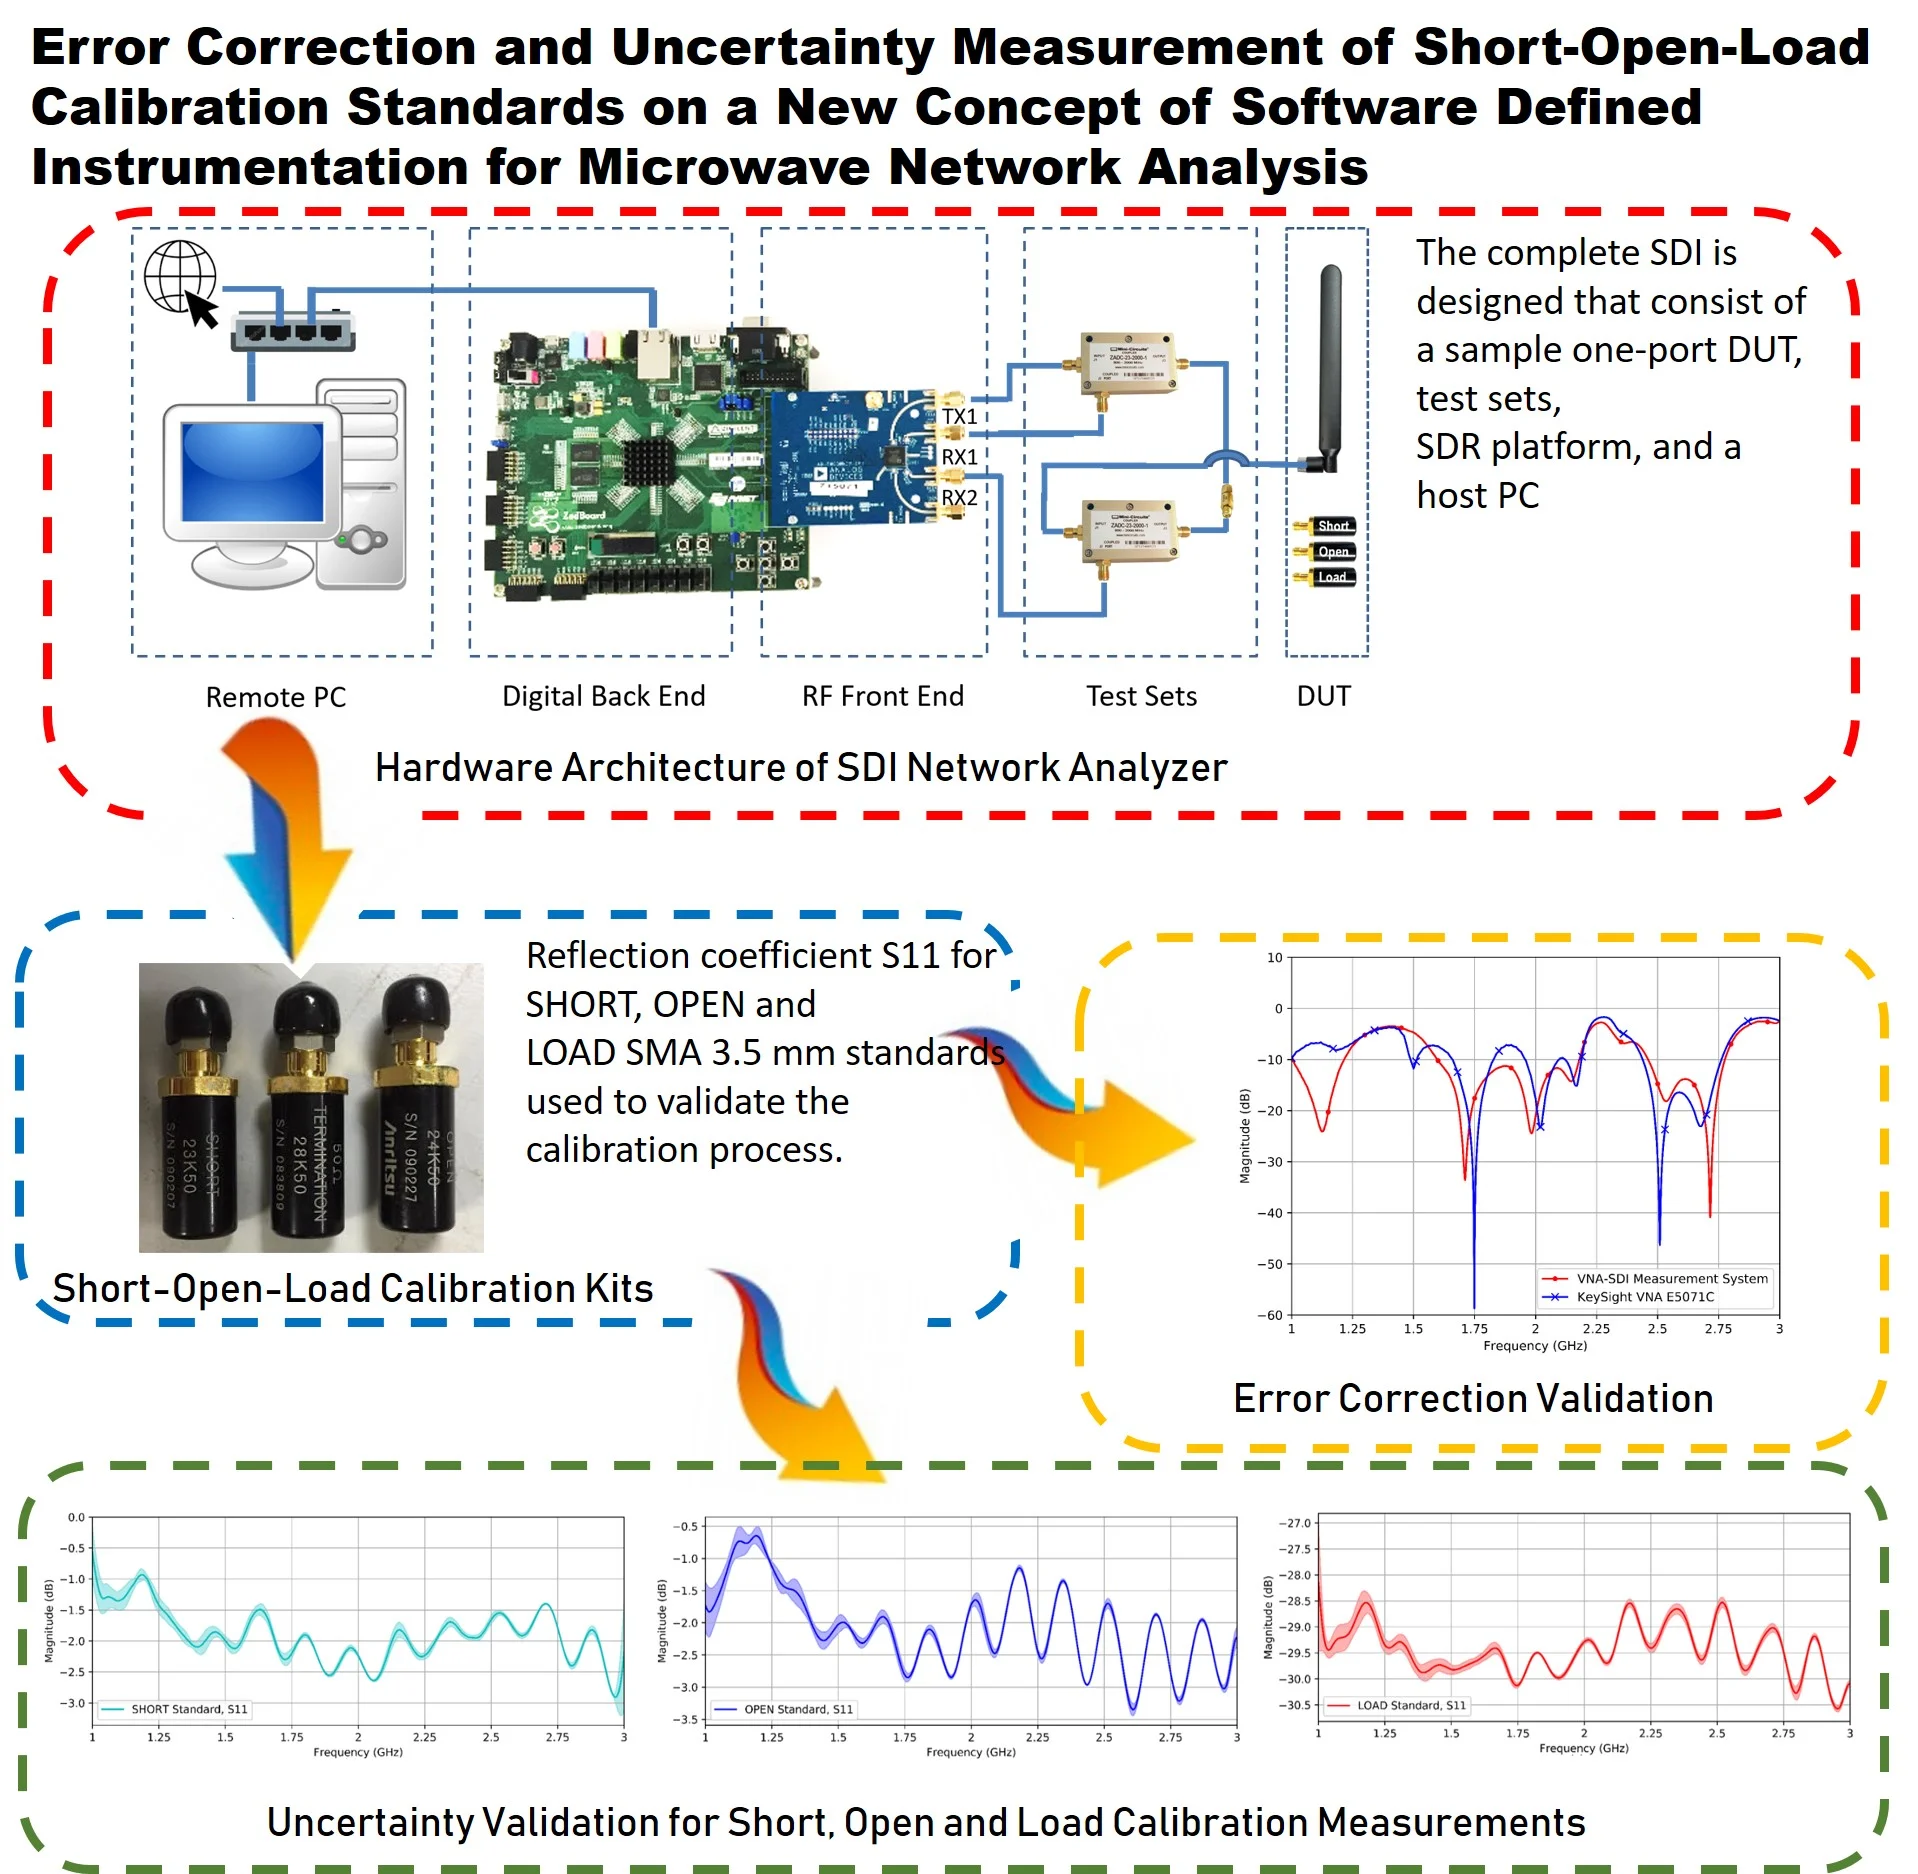
Software-Defined Radio (SDR) has appeared as a sufficient framework for the development and testing of the measurement systems such as a signal generator, signal analyzer, and network analysis used in the network analyzer. However, most of researchers or scientists still rely on commercial analyzers were larger benchtop instruments, highly cost investment and minimum software intervention. In this paper, a new concepts measurement revolution called as Software Defined Instrumentation (SDI) on network analysis is presented, which is based on reconfigurable SDR, a low-cost implementation, ability to access RF chain and utilizing open source signal processing framework. As a result, a Vector Network Analyzer (VNA) has been successful implemented by deploying an SDR platform, test sets, and data acquisition from the GNU Radio software in host PC. The known calibration process on SHORT-OPEN-LOAD (SOL) technique is validated to ensure measurement data from this SDI free from systematic error. Two types of SOL calibration standards used for a comparison study to validate the SDI measurement system which is capable of generating the response on the differential of standard quality and accuracy of standards kits. Finally, calibration uncertainty analysis is also presented in this work by utilizing RF open source package without any cost addition.
Highlights
- A new concept of Software Defined Instrumentation (SDI) measurement system on network analysis is presented.
- The measurement system consists of reconfigurable Software Defined Radio (SDR), test-sets, and an open-source signal processing framework is utilized with minimal cost.
- The Short-Open-Load (SOL) Calibration technique and uncertainty measurement with two different standard kits successfully verified.
- The Scattering parameters (S-parameters) measurement between the SDI measurement system and a commercial Vector Network Analyzer (VNA) shows is validated with the good agreement were achieved.
1. Introduction
The SDR is an all latest technology being developed in the recent century and is a radio in which some or the entire physical layer functions are software defined [1]. Most of the researcher used the commercial off-the-shelf SDR for wireless RF communication [2-4], GPS receiver [5, 6], Orthogonal Frequency Division Multiplexing (OFDM) Transceiver [7], Radar [8], and effective tools for education in RF waves field [9]. But there is still huge potential this SDR can be used for any RF measurement system by replacing the RF front-end system that equipped with the antenna to test set of the measurement system. This upgrading functionality of traditional SDR into new instrumentation infrastructure is called as Software-Defined Instrumentation (SDI).
A few papers already published some preliminary work how the SDR being utilized as the measurement system. In [10], they deploy a Universal Software Radio Peripheral (USRP) N210 as SDR platform to measure sine and pulse reference signal. However, the proposed measurement setup required two sets of SDR and two hosts PC. More unit of SDR and PC usage is not preferable for the compact or simple measurement system.
In [11], a concept of Software Defined Synthetic Instruments (SDSI) is introduced after the SDR or Cognitive Radio (CR) are improved and become a complex system that able to testing analog and digital signals, injecting test vector inside SDR/CR chain and measuring response at the module level. This SDSI consists of measurement and stimulus subsystems that deliver test signals to and measure the responses from a DUT. This paper mainly describes the conceptual of SDSI and not much detail on the low-level implementation of an example of RF instruments.
In [12, 13], SDI implementation on the signal analyzer is presented using the R5500 real-time spectrum analyzer from open source ThinkRF. This module is end-user commercial product dedicated for wireless signal analyzer application such as signal monitoring, surveillance countermeasures, and regulatory monitoring. This module may not suitable for the researcher who aims to manipulate any RF signal path on the front end module.
Corrected mixed-domain measurements are proposed in [14] together with a calibration procedure. The demonstration is constructed using an evaluation board from a 14-bit ADC, and bandpass filter as a DUT that able to measure reflection coefficient just below 1 GHz. This work is lack of description on hardware-software architecture ansssd calibration verification.
Therefore, at this work, a VNA implementation based on SDI technology with integrated RF transceiver in one chip, open source utilization, and well-known calibration procedure is performed and verified with two different standards manufacturer.
A VNA widely used for characterizing the performance of high-frequency RF components using scattering parameters [15]. Any instrument requires a calibration procedure to eliminate systematic error due to couplers directivity, transmission path and port mismatch with known standards. Then after calibration performed with those standards, the VNA can produce high accuracy measurements. As a summary, the calibration procedure is very a critical part of propose VNA measurement system based on SDI implementation.
2. SDI hardware architecture overview
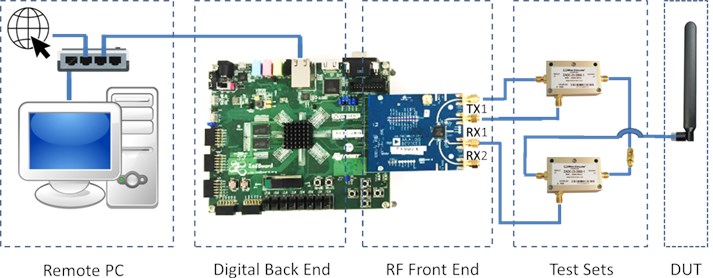
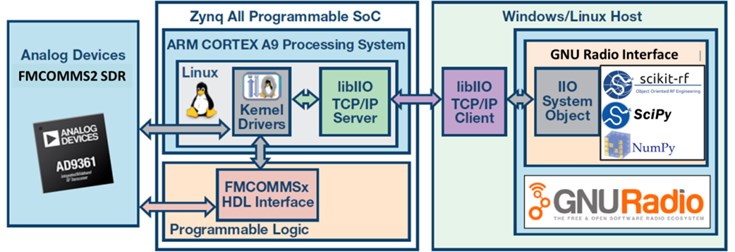
Fig. 1 shows the hardware architecture stages to establish a complete SDI for VNA measurement system. These stages consist of a remote host PC, digital back end, RF front end, a test set configuration and a device under test (DUT). In this work, the scope of measurement is focused on one-port measurement system specify reflection coefficient, . The hardware topology is presented aim for less RF discrete components integration, compact, mobile and user calibration friendly.
Fig. 1Hardware architecture configuration
2.1. DUT
The LTE Dipole antenna from Pulse Series SPDA 24700/2700 is selected a DUT sample as one-port DUT of this work. The specifications for frequency bandwidth given by manufacturer are 698-960/1710-2170/2500-2700 MHz [16]. This proposed SDI measurement system will verify this specification as shown in the following subsection. The interconnection between any DUT or RF discrete components to the VNA-SDI measurement system must be equipped with SMA 3.55 mm port type which is widely used in metrology instruments or production [17].
2.2. Test sets
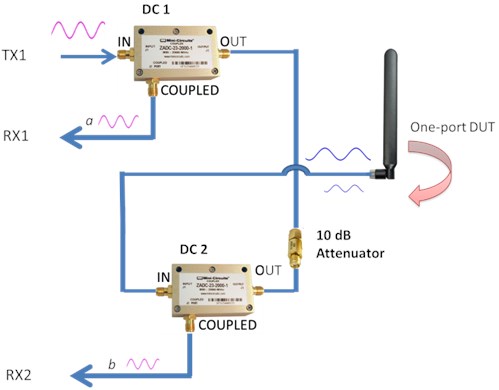
The test set consist of SMA coaxial cables, the 10 dB attenuator, and two directional couplers to separates the incident and reflected waves at the measurement plane as shown in Fig. 2. Coaxial cable RG316 type is used as a transmission line for continuous wave (CW) signals from or to SDR platform, between the test set and DUT. The stimulus signal from TX1 will be fed into the first coupler (DC 1) from IN port, then this traveling signal, some portion of it will forward into COUPLED port before this path goes to reference channel by RX1. This signal fed into RX1 is an incident wave, a. The OUT port from the first directional coupler then connected to OUT port of second directional coupler (DC 2). This traveling wave then goes to the INPUT port where the DUT is connected. This wave then reflected from DUT before some portion of it is fed into COUPLED port second directional coupler. This traveling signal is known as the reflected wave, b. This reflected wave is fed by measurement channel at RX2.
A 10 dB attenuator could be inserted in between OUT port DC1 and OUT port DC2 to reduce variation in impedance [18] or reducing inverse insert loss if low magnitude signals from TX1 applied.
Fig. 2Test set configuration with two directional couplers and attenuator
2.3. RF front end and digital back end
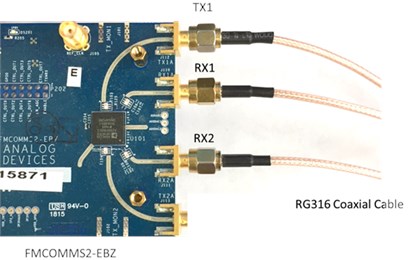
The SDR hardware chosen in this work is Zynq-7000 All Programmable SoC/Analog Devices Software-Defined Radio Kits which suitable for SDR, MIMO and data acquisition applications [19]. This SDR solution use combination of ZedBoard with Xilinx Zynq-7000 SoC as a carrier board and FMCOMMS2-EBZ module as a daughter board, with the AD9361 chip from Analog Devices, Inc (ADI). The FMCOMMS2-EBZ board is the RF front-end for transmitting and capturing RF signal. Apart from the front-end, an SDR system conjointly a radio back-end, that is chargeable for the remaining signal processing operations in a receiving or transmitting chain. The FMCOMMS2-EBZ consists of dual RX and TX ports as shown in Fig. 3. However, only one transceiver and two receivers are used for implementation of this SDI measurement system. Each transceiver has phase and frequency synchronization on both transmit and receive paths that have been very important characteristic when measuring any relative magnitude or phase on different receivers.
CW signal generates from the signal generator that utilizing DDS will transmit this traveling wave through transmitter path TX1. This CW signal is measured on receiver RX1 and reflected signal will be measured on receiver RX2.
Fig. 3RF font-end platforms configurations
FMCOMMS2-EBZ board can’t operate in the stand-alone platform but need a carrier board which has an embedded ARM processor and FPGA fabric inside of it. Both boards are connected via FPGA Mezzanine Card (FMC) for transfer complex sample between ADC and DAC into mainboard with higher data throughput up to 10 GB/s, low latency and use simple protocol communication. The complex samples on this particular platform are triggered by an internal DDS that was formed by four standalone signal generators. All of these four signal generators are mixed to create two tones specifically name as IQ signals that are delivered to the DAC.
The ZedBoard is a low-cost development board for Zynq-7000 chip that consists of dual ARM Cortex-A9 and a NEON floating point arithmetic logic unit (ALU). This Zynq-7000 chip is partitioned into programmable logic (PL) cells and processing system (PS) elements. The ZedBoard perform as back-end routine operation such as generate a complex sample from an internal DDS for IQ signal generator. In order, the host PC communicates to ZedBoard, a Gigabit Ethernet interface available that allows remote access to overall SDR system. Therefore, an Ethernet cable must be connected via Ethernet port to Ethernet hub.
2.4. Host PC
The main function of this remote PC is used to do signal processing on GNU Radio software, develop user applications, to collect raw measurement data in the form of real and imaginary complex values, perform system calibration procedure and to display the measurement data in multiple plot diagrams. Linux Ubuntu is chosen for running the operating system since all driver provided by ADI is based on Linux Industrial IIO framework. This PC communicates to the digital backend using 10 GB Ethernet facilities including Ethernet hub and Ethernet cables.
3. SDI firmware architecture overview
The SDI can be configured to select center frequency, sampling rate, bandwidth, and other parameters to transmit and receive signals of interest. This leaves the digital signal processing techniques, which are developed on a host PC, where debugging and visualization is much effective. This host required PC-based software to develop and test the data transmission and digital signal processing functions in establish software environment. One software environment that meets this requirement is GNU Radio, which is a free software development toolkit that provides signal processing blocks to implement software-defined radios and signal processing systems. Fig. 4 shows the signal flows through from remote PC until RF front end.
One of the methods available to interface to SDR board is dictated by the SDR software infrastructure namely GNU Radio Companion (GRC). This GRC is a graphical interface that represents links between GNU Radio blocks and allows the user to perform flexible connections, utilize available libraries and create a custom user module [20]. This software tool is a graphical entry for building GNU Radio flow graph, simulate and generate the baseband part automatically.
Fig. 4Firmware infrastructure with various libraries and open-source packages
3.1. Transceiver implementation on GNU radio
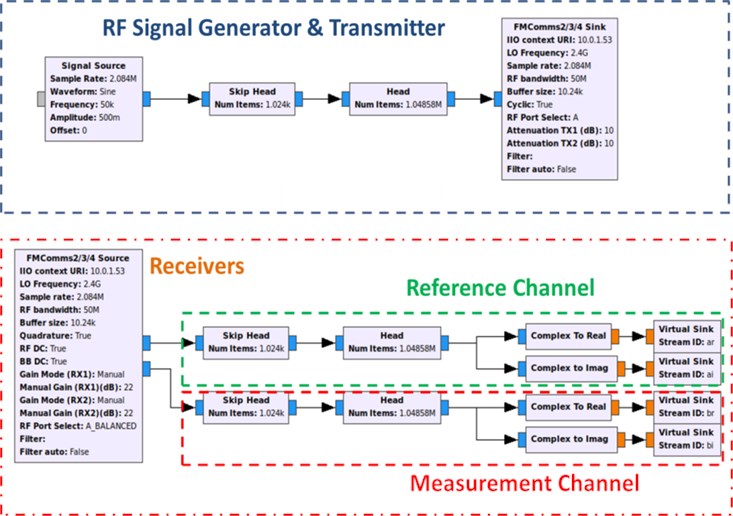
An overview of the transceiver part blocks as exposed to the GRC is depicted in Fig. 5. The two IIO blocks used that represent FMCOMMS2 transmitter and receiver known as FMCOMMS2 Sink and FMCOMMS2 Source respectively. The transmitter path delivers a CW of sine signal from the signal source block. Meanwhile, the receiver path has two channels used to receive two different signals in receiver port. The function of Skip Head is to remove initial locking time when SDR change any parameter set on the SDR.
Fig. 5Transceiver implementation on GRC flowgraphs
3.2. Complex divider implementation
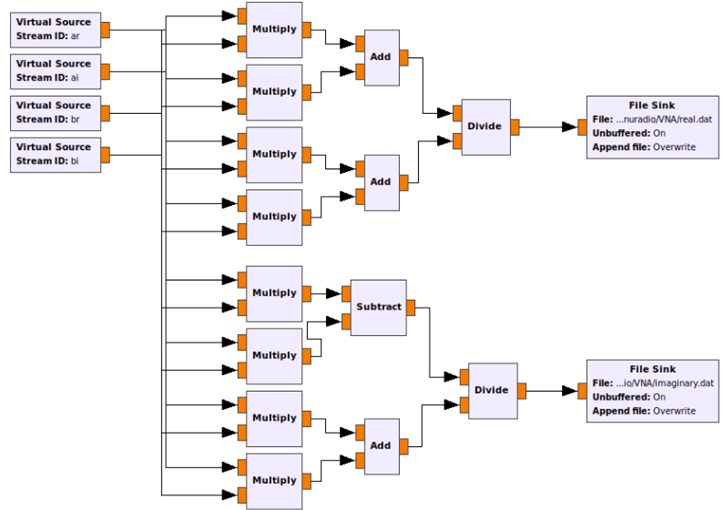
As shown in Fig. 2, the signal generator passes through directional couplers into one-port of DUT. Then the DUT will reflect some fraction of its reflection amplitude wave, , of the incident wave amplitude, . The directional coupler 1 serves to separate and measure the incident wave amplitude, through receiver RX on the reference channel. Meanwhile the reflection wave amplitude, is fed into receiver RX of measurement channel. The DUT input reflection coefficient can be calculated from these measured wave amplitude:
This is a complex number consisting of a real and an imaginary part. In order to calculate in signal processing blocks, the complex divider block is developed in GRC as shown in Fig. 6. The result of this operation, real and imaginary will be stored into File Sink blocks in term of binary file format.
Fig. 6Complex reflection coefficient implementation on GRC flowgraphs
4. One port calibration and error correction validation
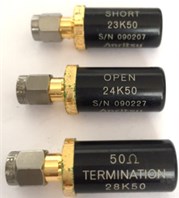
A calibration procedure is required to account for any errors introduced due to losses, mismatches and imperfect directivities in the system. On this section, three standard calibration kits; SHORT, OPEN and LOAD SMA 3.5 mm standards used to validate the calibration process as shown in Fig. 7. These calibration standards are connected to the measurement plane directly. The measurement plane is where the measurement begins and ends whenever the calibration standards are attached. Measurement of these standards is the process of removes systematic error. After these errors are successful quantified, their effect can be mathematically removed, thus the actual measurements are the highest level of accuracy or minimum uncertainty level for measuring DUT components.
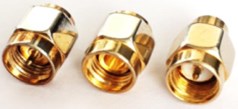
Two type of calibration standards used as a comparison study between commercial or industrial standards and low-cost calibration standards as shown in Fig. 8. The commercial grade standards are manufactured from Anritsu, K Calibration Kit Model 3642 and meanwhile, low-cost calibration standards are obtained from small manufactured industry.
Fig. 7SDI calibration with calibration standards
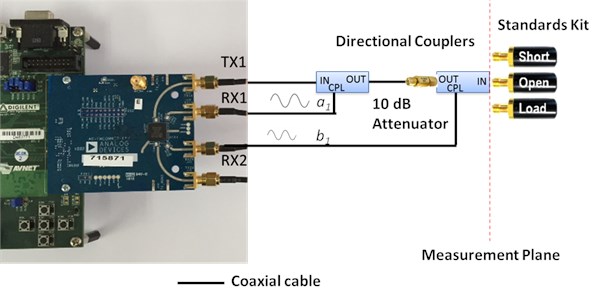
Fig. 8a) Anritsu SOL calibration standards, b) low cost calibration standards
a)
b)
4.1. S11 Measurement for calibration standards
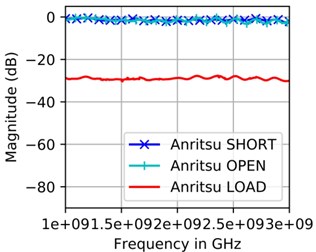
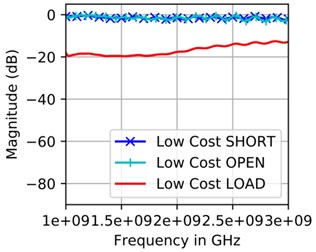
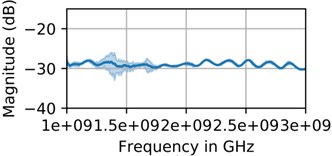
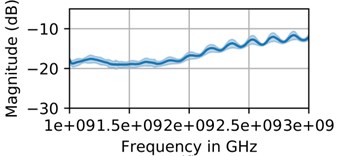
Two different calibrations standard response of measurement from frequency 1 GHz until 3 GHz with 1 MHz step size depicted in Fig. 9. In Fig. 9(a) shows the magnitude response for commercial standard with OPEN and SHORT are near to 0 dB and LOAD is within –30 dB. Meanwhile in Fig. 9(b) shows magnitude response for low-cost calibration standard with OPEN and SHORT are also near to 0 dB and LOAD is –20 dB to –10 dB. This response clearly shows how SDI measurement system capable to do the -parameter measurement, and ability to differentiate between high-quality standard kit and low-cost quality kit devices.
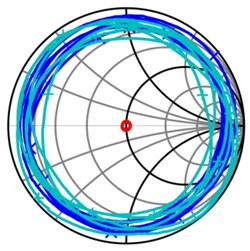
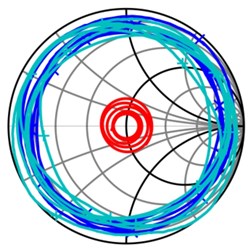
Fig. 9(c) and Fig. 9(d) shows the response on Smith chart for both types of calibration standards. The OPEN and SHORT standards for commercial type spiral near to the edge of Smith chart and LOAD standard just perfect spot at the center of Smith chart as shown in Fig. 9(c). Meanwhile the OPEN and SHORT for low-cost standards are also in spiral type but the most significant difference is medium spiral appeared on the LOAD as shown in Fig. 9(d). This response on LOAD standard for the low-cost kit is not good impedance accuracy that can be used for any calibration procedure for high frequency.
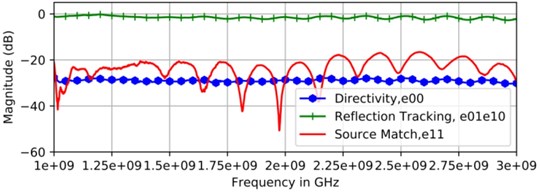
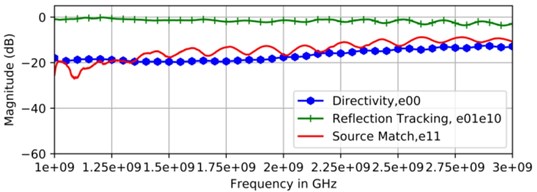
These -parameters for SHORT, OPEN and LOAD measurements, the error term can be visualized as shown in Fig. 10(a) for commercial standard and Fig. 10(b) for a low-cost standard.
Table 1 show magnitude comparison for directivity, reflection tracking, and source match. The data response from SDI measurement system using commercial grade standards is almost similar data from [21] but the poor result shows for low-cost calibration standards.
Table 1Error term for one port measurement
Error term | [21] | Anritsu calibration standards | Low cost calibration standards |
Directivity | ≥ 29 dB | ≥ 29 dB | ≤ 20 dB |
Reflection tracking | ≤ 2 dB | ≤ 2 dB | ≤ 2 dB |
Source match | ≥ 22 dB | ≥ 20 dB | ≤ 20 dB |
Fig. 9Magnitude S11 for: a) Anritsu calibration standards, b) low cost calibration standards and Smith chart for, c) Anritsu calibration standards, d) low cost calibration standards
a)
b)
c)
d)
Fig. 10Error term for: a) Anritsu calibration standards, b) low cost calibration standards
a)
b)
5. Uncertainty analysis
The overall uncertainty of the SDI measurement setup is determined with both verification standards. These verification standards need to have the same connector type as the DUT. On this work, an experimentally based technique for characterizing calibration uncertainty is utilized from open source python module scikit-rf [22, 23].
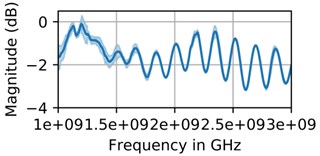
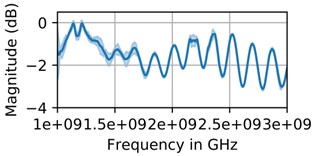
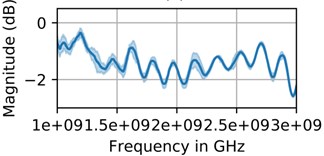
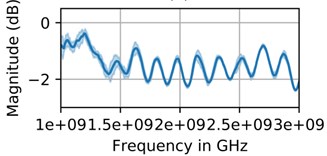
Fig. 11 presents uncertainty measurement for OPEN, SHORT and LOAD standard respectively for ten sample measurement reading was taken. The uncertainty response for both OPEN and SHORT are almost similar as depicted between Fig. 11(a) and Fig. 11(b) and Fig. 11(c) and Fig. 11(d) respectively. However, in Fig. 11(e) and Fig. 11(f) shows significant differences between from commercial grade LOAD standard and low-cost LOAD standard. The uncertainty band becomes clearly visible for low-cost LOAD standard in the full bandwidth.
Fig. 11OPEN uncertainty for: a) Anritsu calibration standards, b) low cost calibration standards, SHORT uncertainty for, c) Anritsu calibration standards, d) low cost calibration standards and LOAD uncertainty for, e) Anritsu calibration standards, f) low cost calibration standards
a)
b)
c)
d)
e)
f)
At the same time, the standard deviation is also concurrently generated as shown in Table 2. The commercial grade standards have minimum variation compare with low-cost standard.
Table 2Standard deviation for SOL standard with ten sample measurement
Standard deviation | Anritsu standards | Low cost standards |
SHORT | 0.0075 | 0.01 |
OPEN | 0.0050 | 0.01 |
LOAD | 0.0005 | 0.01 |
6. DUT S11 measurement
To validate the one-port of measurement, a passive antenna device used as a DUT as shown in Fig. 12. Two different performance of measurement with different calibration standards applies in the previous section. These performances also are benchmarked with measurement using commercial VNA instrument, Anritsu 37347D.
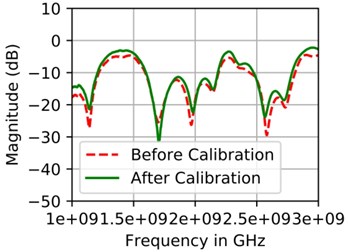
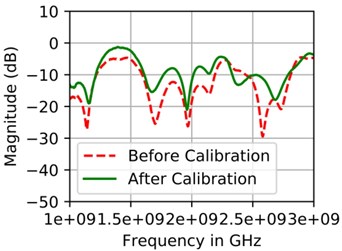
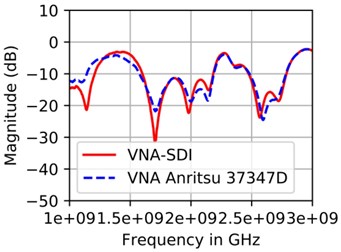
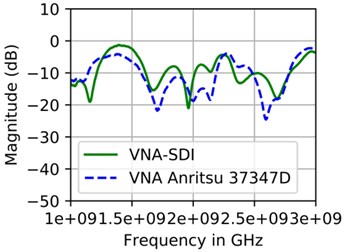
Fig. 13 shows the response of measurement from SDI before and after the measurements system apply Anritsu calibration standards (a) compare with low-cost calibration standards (b). The error margin for low-cost calibration standards is higher than commercial grade calibration standards. Meanwhile another subplot in Fig. 13 shows comparison performance of measurement on DUT when applying commercial grade standards (c) and low-cost standards (d). A good agreement is archived when the SDI uses commercial grade standards from Anritsu calibration kit. This measurement taken from SDI measurement system also validates specification for antenna bandwidth given from manufacturer optimum from frequency 1700-2200 MHz and 2500-2700 MHz.
Fig. 12S11 measurement topology on SDI measurement system
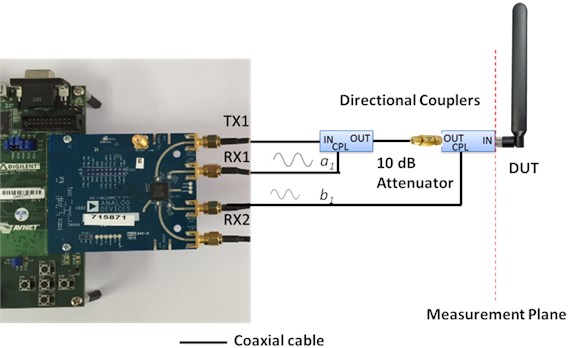
Fig. 13S11 measurement for: a) dipole antenna before and after Anritsu calibration standards applied, b) before and after low cost calibration standards applied. Then S11 Measurement for dipole antenna using, c) Anritsu calibration standards, d) low cost calibration standards against commercial VNA Anritsu 37347D
a)
b)
c)
d)
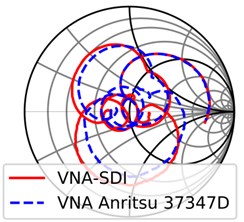
In Fig. 14, presents a Smith chart comparison for both calibration standards after performs error correction and phase measurement comparison for both calibration standards after performing error correction on the sample DUT.
Fig. 14Smith chart comparison for dipole antenna using: a) Anritsu calibration standards, b) low cost calibration standards against commercial VNA Anritsu 37347D. Phase measurement comparison for dipole antenna using, c) Anritsu calibration standards, d) low cost calibration standards against commercial VNA Anritsu 37347D
a)
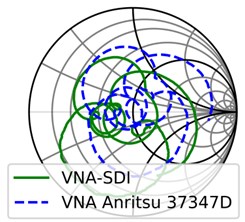
b)
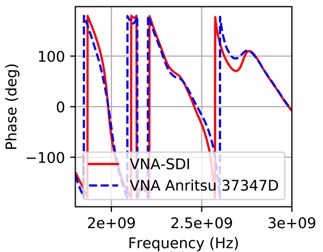
c)
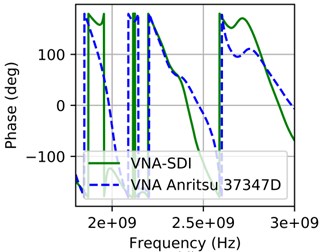
d)
7. Conclusions
We have presented a new concept of SDI based on SDR platform that utilizing an open source signal processing software. The practical VNA frequency range from 1-6 GHz is successful design with s-parameter implementation was construct on open source GNU Radio software and development test set for one port measurement system is configured using minimum RF discrete components such as couplers and RF transmission cables.
A number of measurements and verification carried out on LTE dipole antenna are also presented to validate error correction on one-port calibration system using Anritsu commercial grade calibration standards compare with low-cost calibration standards. The open-port calibration using Anritsu commercial grade calibration standards is compared with commercial VNA showing good agreement.
References
-
Devi C., Thangadurai N. A review on recent trends in software defined radio design and applications. International Journal of Advanced Research in Electronics and Communication Engineering (IJARECE), Vol. 6, Issue 10, 2017, p. 1021-1025.
-
Ferrari P., Flammini A., Sisinni E. New architecture for a wireless smart sensor based on a software-defined radio. IEEE Transactions on Instrumentation and Measurement, Vol. 60, Issue 6, 2011, p. 2133-2141.
-
Uengtrakul B., Bunnjaweht D. A cost efficient software defined radio receiver for demonstrating concepts in communication and signal processing using Python and RTL-SDR. 4th International Conference on Digital Information and Communication Technology and its Applications (DICTAP), Bangkok, 2014, p. 394-399.
-
Dang T. M., Gonnot T., Saniie J. End-to-end wireless digital communication system of FPGA based software defined radio. IEEE International Conference on Electro Information Technology (EIT), Lincoln, 2017, p. 235-239.
-
Schmidt E., Akopian D., Pack D. J. Development of a real-time software-defined GPS receiver in a LabVIEW-based instrumentation environment. IEEE Transactions on Instrumentation and Measurement, Vol. 67, Issue 9, 2018, p. 2082-2096.
-
Soghoyan A., Suleiman A., Akopian D. A development and testing instrumentation for GPS software defined radio with fast FPGA prototyping support. IEEE Transactions on Instrumentation and Measurement, Vol. 63, Issue 8, 2001, p. 2012-2014.
-
Bloessl B., Segata M., Sommer C., Dressler F. Towards an open source IEEE 802.11p stack: a full SDR-based transceiver in GNU radio. IEEE Vehicular Networking Conference, Boston, 2013, p. 143-149.
-
Weidong H., Houjun S., Xin L., Shiyong L. Research on SDR architecture for radar target signatures measurement. CIE International Conference on Radar, Shanghai, 2006.
-
Arslan H. Teaching SDR through a laboratory based course with modern measurement and test instruments. Proceeding of the SDR 07 Technical Conference and Product Exposition, 2017.
-
Andrich C., Ihlow A., Bauer J., Beuster N., Galdo G. D. High-precision measurement of sine and pulse reference signals using software-defined radio. IEEE Transactions on Instrumentation and Measurement, Vol. 67, Issue 5, 2018, p. 1132-1141.
-
Carey D., Lowdermilk R., Spinali M. Testing software defined and cognitive radios using software defined synthetic instruments. IEEE Instrumentation and Measurement Magazine, Vol. 18, Issue 2, 2015, p. 19-24.
-
Helaly T., Adnani N. A fourth category of software-defined instrumentation for wireless test. IEEE Instrumentation and Measurement Magazine, Vol. 20, Issue 4, 2017, p. 3-10.
-
Helaly T., Adnani N. A new category of software-defined instrumentation for wireless test. IEEE Autotestcon, Anaheim, 2016.
-
Cruz P., Carvalho N. B., Remley K. A., Gard K. G. Mixed analog-digital instrumentation for software-defined-radio characterization. IEEE MTT-S International Microwave Symposium Digest, Atlanta, USA, 2008, p. 253-256.
-
Szatkowski J., Wiatr W. Study of residual VNA measurement errors due to imperfect Thru-Reflect-Match calibration standards. 22nd International Microwave and Radar Conference (MIKON), Poznan, 2018, p. 664-667.
-
Pulse electronic, https://productfinder.pulseeng.com/product/SPDA24700/2700.
-
Magerl M., Mandic T., Baric A. Broadband characterization of SMA connectors by measurements. 37th International Convention on Information and Communication Technology, Electronics and Microelectronics (MIPRO), Opatija, 2014, p. 104-109.
-
Grujiá D. N, Jovanović P., Savić M. Using software defined radio for RF measurements Zooming Innovation in Consumer Electronics International Conference (ZINC), Novi Sad, 2017, p. 18-21.
-
Xilinx and Analog Devices Release Two Zynq-7000 All Programmable SoC/Analog Devices Software-Defined Radio Kits from. Avnet Electronics Marketing, https://news.avnet.com/press-release/avnet-electronics-marketing-xilinx-and-analog-devices-release-two-zynq-7000-all.
-
Muslimin J., Asnawi A. L., Ismail A. F., Jusoh A. Z. SDR-based transceiver of digital communication system using USRP and GNU radio. International Conference on Computer and Communication Engineering (ICCCE), Kuala Lumpur, 2016, p. 449-453.
-
Michael Hiebel Fundamentals of Vector Network Analysis. Rohde and Schwarz, 2007.
-
Arsenovic A., Chen L., Bauwens M. F., Li H., Barker N. S., Weikle R. M. An experimental technique for calibration uncertainty analysis. IEEE Transactions on Microwave Theory and Techniques, Vol. 61, Issue 1, 2013, p. 263-269.
-
Arsenovic A. SCIKIT-RF: Open-source microwave/RF tools for python. 2018, http://www.scikit-rf.org.
Cited by
About this article

The authors would like to express our appreciation to Department of Computer and Communications Systems, Universiti Putra Malaysia staffs and students, for their support and cooperation.
