Abstract
A set of test system, which is suitable for static test of a hyperstatic aero-engine pylon structure of a certain aircraft, was designed according to the requirements of static structure test. This test technology solved some key problems such as support stiffness simulation of hyperstatic engine pylon and aero-engine loading simulation. Based on these experimental techniques, the static test on a hyperstatic aero-engine pylon of a certain aircraft has been completed in the paper. The test results testified to the stable and reliable working performance of the test system. And the aero-engine pylon, the test specimen, didn’t produce any crack or harmful large deformation under all work conditions, indicating that it has met the design requirements on both static strength and stiffness. The test technology can be applied in static tests of similar hyperstatic test specimen. The test data can serve as a basis for structural static strength and stiffness property evaluation of the aero-engine pylon.
1. Introduction
Aero-engine pylon of aircraft is a transition structure which connects nacelle and wing. It transmits the thrust of engine when aircraft is flying and separates the engine from the fuel tank when aircraft is wrecking [1]. The aero-engine pylon bears large and alternative loads during flight, so its reliability concerns the safe flight of aircraft. Therefore, conducting structural test on aero-engine pylon is not only for verifying the design of engine pylon’s structure, but also for assessing the safety performance of an aircraft [2]. Static test is the most basic and important one of all structural tests. It is the safety verification of test specimen’s structural design, and it is an important basis of test specimen’s modification.
Static tests on different structures have been investigated and the technology of structural static test has been developed rapidly. There are some structures which is static indeterminate. Tests of this kind of specimen is different with common static tests because of the effect of stiffness. To solve the stiffness problem, there has been some studies done by domestic and foreign scholars. In 1991, Zhao Shanzhai researched 3 kinds of typical static tests, and summarized that the boundary support stiffness has great effect on load distribution of test specimen in static tests. Therefore the boundary conditions should be simulated in component static test of aircraft [4]. In the same year, Luo Jiaquan created a stiffness model to simulate the stiffness of aft-fuselage and horizontal tail of an aircraft, and analyzed the low speed flutter of the aircraft [3]. In 1999, Fang Mingyun used computers to auto-control the loads in full-scale static test harmonically. This method was first used in full-scale static tests of helicopters in China, and it further improved loading accuracy and safety in static tests [5]. In the same year, Yang Minggui and Jiang Detan researched the theoretical design of the Circular-section I-shaped Beam Shearing Force Sensor, which can achieve the measurement for some special condition [6]. In 2003, S. F. Ma and T. K. Shiue conducted a bench static test of an airfoil elevator to certify its static structural integrity. They described the test setup and procedure in detail [7]. In 2005, through the theoretical analysis and wind tunnel test on aeroelastic model, Yu Shice researched the pneumatic stiffness simulation of large span roof, and summarized a set of methods to simulate the stiffness of aerodynamic structure [8]. In the same year, Xu Ze researched the full-scale static test of an aircraft. He described the key techniques and the solving methods of static test simulation in detail [9]. Ramly used an innovative trussed support part in static strength test of wing in 2010. The results verified the finite element simulation analysis of wing [10].
To ensure the accuracy of test results, the static test on aero-engine pylon, which is supported static indeterminately by wing, requires to accurately simulate the supporting condition of wing and the loading condition of aero-engine. Generally, the wing-to-pylon structure is statically determinate. The boundary condition can be easily simulated just by ensuring sufficient stiffness and strength. But simulating the boundary condition of hyperstatic aero-engine pylon is much more difficult in static test, because the wing-to-pylon structure is static indeterminate and the stiffness of wing directly affects the path of force transfer in engine pylons. To design a static test method which is suitable for hyperstatic aero-engine pylon, the paper researched a hyperstatic engine pylon of a certain aircraft, and designed a set of scientific and reasonable test scheme according to the engine pylon’s loading characteristic and structural property. This test technology is reliable and practical, and the method has important reference values for static tests on similar hyperstatic test specimen.
2. Structure and load of test specimen
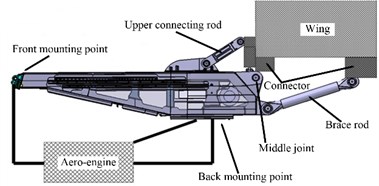
According to existing connection forms, aero-engine pylon structures can be divided into drag strut type, box beam type and hyperstatic type. As for the hyperstatic type pylon structure, there are 3 longitudinal beams named “top beam”, “middle beam” and “under beam” on it. The top beam connects to front wing spar through a connecting rod named “upper connecting rod”. The middle beam connects to reinforced skin near front wing spar through 2 joints named “middle joint”. The under beam connects to reinforced panel between front wing spar and back wing spar through a “brace rod”. The test specimen in this paper is a hyperstatic pylon, shown in Fig. 1. In addition, the pylon connects with aero-engine at front and back mounting points.
Fig. 1Aero-engine pylon structure of a certain aircraft
2.1. Structure of engine pylon
According to structural mechanics, aero-engine pylon has 6 degrees of freedom in space, including 3 translation and 3 rotation degrees of freedom. The loads corresponding with the 6 DOF are heading load, lateral load, vertical load, heading torque, lateral bending moment and vertical bending moment. In the pylon-wing interface, the upper connecting rod, brace rod, and middle joints can transmit heading load and vertical load. Two cross lateral rods can transmit the lateral load. The upper connecting rod, brace rod and middle joint work together to transmit lateral bending moment. The last 2 loads, heading torque and vertical bending moment, can be transmitted by the 2 symmetrical middle joints. The number of constraints provided by each connector is shown in Table 1. The upper connecting rod, brace rod and 2 lateral rods only bear axial tensile-compressive load, so constraints provided by each of them is 1. The 2 symmetrical middle joints are pinning supported through 2 shear pins, so each middle joint provides 2 constraints. Since there is no virtual constraint, the wing-to-pylon structure is static indeterminate, and the redundancy is .
Table 1Constraints Number provided by connectors
Connector | Upper connecting rod | Left lateral rod | Right lateral rod | Left middle joint | Right middle joint | Brace rod |
Constraint number | 1 | 1 | 1 | 2 | 2 | 1 |
The aero-engine has 6 degrees of freedom in space too. It is fixed on the pylon, which constrains its vertical translation, lateral translation and heading torsion through a hinge joint and a connecting rod at front mounting point. As for the other three degrees of freedom, the aero-engine also connects to pylon through a thrust bar and 2 cross lateral rods at back mounting point. The thrust bar constrains the heading translation of aero-engine. The 2 cross lateral rods, equal to a hinge joint, which transmits vertical and lateral loads. This equivalent hinge joint works together with the hinge joint at front mounting point to provide lateral and vertical rotational constrains. Thus, there is no redundant constrain in the pylon-to-engine structure. It is statically determinate.
2.2. Test load case
The loads borne by aero-engine pylon are mainly because of aero-engine’s thrust and inertial force, and the action point is at the center of gravity of engine. A set of preliminary design load cases which are suitable to aero-engine pylon is shown in Table 2.
Table 2A set of preliminary design load cases for aero-engine pylon
Serial No. | Case | Code name | Description of case |
1 | Emergency landing | 1001 | 9 g forward |
2 | Flying sideward | 1003 | 4.2 g rightward & 1.5 g downward |
3 | Dynamic-load case | 1005 | 8 g down ward |
The overloads of aero-engine in Table 2 can be converted into forces shown in Table 3 that act on the center of gravity of aero-engine. The coordinate is body axes coordinate system: backward of heading direction is creasing axis, vertical upward direction is creasing axis, and lateral leftward direction is creasing axis.
Table 3Test load on the center of gravity of pylon
Case code | (N) | (N) | (N) |
1001 | –351036 | 0 | 0 |
1003 | 0 | –58506 | –163817 |
1005 | 0 | –312032 | 0 |
3. Design of test system
The static test system includes support system, loading system and measurement system. A reasonable support system should provide the test specimen with exact support condition to simulate the real work conditions. The loading system should meet the accuracy requirement during loading, and ensure that all the load cases of test specimen can be exactly simulated. The measurement system should be able to measure all measuring items in test and ensure the measurement accuracy.
3.1. Design objective and requirement
The support system in this paper includes a test bench and a wing simulation part. The test bench aims to provide installation frame to whole test system. It must, therefore, have sufficient space for test and its deformation should be controlled within a certain range. Its strength should meet the rules that the factor of safety is 3. The wing simulation part is designed to simulate the pylon’s real boundary support condition. So its stiffness must equal real wing. The loading system in this paper includes hydraulic actuator and loading part. Their function is to simulate aero-engine loading on pylon. Loading precision of the hydraulic actuator should be controlled in 1 %. The loading part must have stiffness and strength large enough such that its safety factor is 3 and the deformation controlled within a certain range. The measurement in the static test includes strain measurement, deformation measurement and force measurement. The measuring errors should be within 1 %.
3.2. Test system
3.2.1. Support system
The support system shown in Fig. 2 includes test bench and wing simulation part. The shape dimension of the test bench is 4.58 m×2.58 m×4.6 m. The upright beam is the principle force bearing component and installs wing simulation part. It is composed by 2 edge strips and 2 web plates in “#” form. The double web form can increase beam’s distorting ability and bending ability. The cross beam is assisted force bearing component aiming to sustain the bench shape. Its section shows double “C” shape.
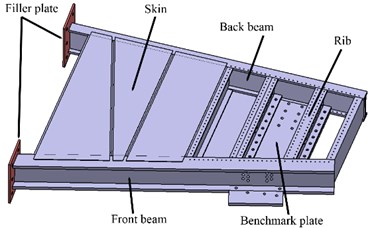
The wing in this paper is of a double beam frame. Its principle force bearing structures are front and back beams, strengthening rib and skin. Through analysis, it was found that the support stiffness of wing to pylon is mainly determined by stiffness of the 4 wing boxes between pylon and fuselage, and other wing boxes have little impact on it. So the paper intercept the 4 wing boxes and pick up the principle force bearing structures of them as the coarse model of wing simulation part. The three-dimensional model of wing simulation part is shown in Fig. 3. It is composed by a front beam, a back beam, 11 pieces of skin, 7 ribs, a benchmark plate and 2 filler plates. The 2 filler plates set at wing root and attach to test bench. The benchmark plate and the web of front beam compose the installation datum of pylon.
Fig. 2Support system in test
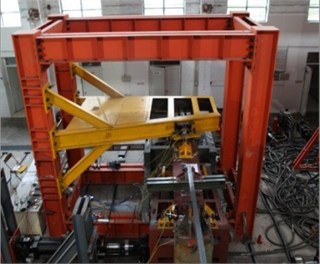
Fig. 3Model of wing simulation part
3.2.2. Loading system
The loading form in this pylon static test is loading on the center of gravity of aero-engine from 3 directions. In traditional static test of engine pylon, the loading method is loading on each loading joint of every mounting point. This loading method requires many actuators to load cooperatively. Considering the pylon-to-engine structure is statically determinate, this paper designs a loading part to simulate aero-engine loading on pylon. The loading part is shown in Fig. 4 and Fig. 5. Front and back mounting points can be combined through it. By loading on this loading part, all load cases in this test can be completed by only 3 actuators. Because of the statically determinate structure, the load distribution can be exactly determined through calculating. Thus the loading joints of pylon can be loaded exactly by loading part.
Fig. 4Model of loading part
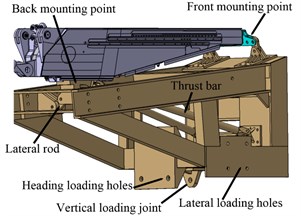
Fig. 5Loading part in test
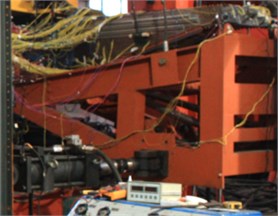
The hydraulic actuator connects to and loads on loading part through bolt holes which are designed on loading part. The bolt holes shown in Fig. 4 include the lateral loading holes on the right side, the heading loading holes at the back and the vertical loading joint at the bottom. When the hydraulic actuators work, all action lines of loads go through the center of gravity of aero-engine. The loading joints at the front mounting point are loaded by the loading part through a hinge joint and a connecting rod. The loading joints at back mounting point are loaded through a thrust bar and 2 cross lateral rods.
3.2.3. Measurement system
Measurement items in this test include strains, deformations and interface loads. Measuring the strains and deformations is to research the pylon’s strength and stiffness property. Measuring the interface loads is to verify stiffness simulation of the wing simulation part. Strain gauges are used to measure strain. To measure the deformation of pylon, a kind of guyed displacement sensor with large measuring range is used. Both the strain gauges and displacement sensors have passed the test of Nanjing Measuring Center and got certification. The measuring errors are within 1 %. As for the measurement of interface load, a type of force transducers are used according to the practical applications.
4. Stiffness simulation of wing simulation part
The connection structure of pylon and wing simulation part in this paper is static indeterminate. The load value transmitted by each connecting joint is determined according to support stiffness [11]. So the support stiffness of wing simulation part to pylon must be the same as the real wing. To simulate real wing’s stiffness, a lot of computations and analyses have been performed after determining the coarse model of wing simulation part. Because the stiffness of wing is very complex, and the load value of each connecting joint is related to the stiffness. We can control stiffness of wing simulation part by measuring and controlling the load value of each connecting joint. That is, if the measuring load values of every joint which connected to the wing simulation part and pylon are equal to the reference values in every load case, it can be confirmed that the support stiffness of wing simulation part to pylon is the same as real wing. The reference value is the load of connection joint when the pylon is installed on an actual wing. They were obtained by computing the finite element model of real wing.
In order to adjust the stiffness of wing simulation part, to make the load value of each connecting joint to meet the reference value, a lot of finite element calculations have been performed. According to mechanics, the structures which have large effect on support stiffness of wing simulation part are front and back beams, ribs, skins, benchmark plate and the base of brace rod. To investigate the effect of each structure, we use control variable method to compute and analyze. For example, to analyze the effect of front beam on support stiffness, we change its stiffness by changing its thickness. And then built different finite element models with different thickness of front beam and computed. Finally, we record the variation trend of load, borne by each connecting joint, along with the thickness changing. This way, we have analyzed the qualitative effect of each structure’s thickness on load distribution. The result of analysis is shown in Table 4.
Table 4Qualitative effect of structures’ stiffness increasing on load distribution
Structure | Loads variation trend along with thickness increasing | |||
Upper connecting rod | Middle joint | Lateral rod | Brace rod | |
Front beam | increase | increase | increase | decrease |
Back beam | Slightly decrease | Slightly decrease | Slightly decrease | Slightly increase |
Rib | decrease | Not obvious | Not obvious | increase |
Skin | Not obvious | increase | Not obvious | Not obvious |
Benchmark plate | decrease | Not obvious | Not obvious | increase |
Base of brace rod | Obviously decrease | Obviously decrease | Obviously decrease | Obviously increase |
Table 5Final geometric size of wing simulation part
Structure | Thickness/mm |
Eedge strip of front beam | 35 |
Web plate of front beam | 30 |
Edge strip of back beam | 25 |
Web plate of back beam | 20 |
Ribs | 15 |
Benchmark plate | 40 |
Skin | 5 |
Base of upper connecting rod | 30 |
Base of middle joints | 30 |
Base of brace rob | 30 |
Table 6Simulation result
Connection joint | Condition 1001 | Condition 1003 | Condition 1005 | ||||||
Reference (N) | Simulation (N) | Errors (%) | Reference (N) | Simulation (N) | Errors (%) | Reference (N) | Simulation (N) | Errors (%) | |
Upper connecting rod | 508000 | 493000 | 2.95 | 167000 | 162000 | 2.99 | 934000 | 916000 | 1.93 |
Brace rod | 445000 | 458000 | -2.92 | 87148 | 94145 | -8.03 | 573000 | 580000 | -1.22 |
Left lateral rod | 23039 | 22374 | 2.89 | 91327 | 84260 | 7.74 | 56814 | 57550 | -1.30 |
Right lateral rod | 36064 | 35412 | 1.81 | 120000 | 118000 | 1.67 | 56963 | 57710 | -1.31 |
Left middle joint | 203000 | 189000 | 6.90 | 1160000 | 1180000 | -1.72 | 126000 | 117000 | 7.14 |
Right middle joint | 206000 | 192000 | 6.80 | 1220000 | 1210000 | 0.82 | 171000 | 159000 | 7.01 |
According to the results, we can reasonably adjust the geometric parameters of the model of wing simulation part, to make the loads of every connection joint to meet the reference values. We use finite element method to calculate the loads of connection joints after each change of a geometric parameter, and compare the results and reference values to make the next adjusting scheme which determines which structure to resize and how much the size of the geometric parameter to adjust. Through repeated iterative calculation, a set of parameters is finally determined. On the condition of this set of geometric parameters, the load of each connection joint is close to the reference value in each load case and the deviation is within 5 %.
The final geometric parameter of each structure of wing simulation part is shown in Table 5. For model of wing simulation part with the thicknesses, load of each connection joint in every load case is calculated and shown in Table 6. The calculated result shows that most of the deviations are within 5 %. This means that the loads of most connection joints are close to the reference values in every load case. There are still some deviations that exceed 5 %, but the loads with exceeded deviation are very little compared to others in the load case.
5. Test Results
In order to obtain the test data of pylon under every load case and ensure the safety and success of test, the test process is divided into distinct stages. The stages of this test include test under limit load, test under design load and test under failure load. The limit load is the maximum load in the actual use of pylon. The relation of limit load and design load is that design load = limit load × safety factor.
The safety factor of pylon in this paper is 1.5, so the limit load is equal to 67 % of design load. This paper is just about the static test under limit load of a hyperstatic aero-engine pylon of a certain aircraft. After checking the test bench, wing simulation part, loading part and aero-engine pylon itself, no crack or harmful deformation was found. The test result shows that the test system is with sufficient strength and stiffness, and the aero-engine pylon can work normally under dangerous load cases such as emergency landing.
5.1. Interface load measurement results
The wing-to-pylon structure in this paper is static indeterminate, and the force transfer of pylon is indeterminate. In order to analyze the force-transfer characteristic of pylon, we need to measure the interface loads. Measurement of interface loads needs to use different force transducers according to the practical connection form. We used a kind of load pin to monitor the interface loads, according to the shear pin connection form in the connection of pylon and wing simulation part.
The results of load pins under every load case are shown in Table 7, Table 8 and Table 9. When load case 1001 and 1005, the principle force bearing connectors are upper connecting rod and brace rod. So the Table 7 and Table 8 show the results measured at upper connecting rod and brace rod. Under load case 1003, the principle force bearing connectors are 2 middle joints. So the Table 9 shows the measure results of corresponding load pins. The measurement results and reference values are compared. The reference values are gained through calculating the finite element model of real wing and pylon. The results show that the wing simulation part has actually simulated the support stiffness of wing.
Table 7Interface load of test under working condition 1001
Interface | Position | Measurement (kN) | Reference (kN) | Error (%) |
Wing to pylon | Upper connecting rod | 514.36 | 508 | 1.25 |
Brace rod | 457.96 | 445 | 2.91 |
Table 8Interface load of test under working condition 1005
Interface | Position | Measurement (kN) | Reference (kN) | Error (%) |
Wing to pylon | Upper connecting rod | 1012.08 | 934 | 8.36 |
Brace rod | 542.51 | 573 | 5.32 |
Table 9Interface load of test under working condition 1003
Interface | Position | Measurement (kN) | Reference (kN) | Error (%) |
Wing to pylon | Left middle joint | 1058.33 | 1160.00 | 8.76 |
Right middle joint | 1270.23 | 1220.00 | 4.12 |
5.2. Measurement results of stress
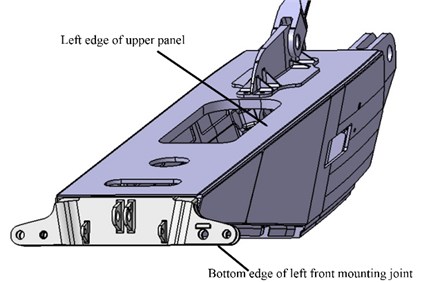
There are many strain monitoring points in this test. Now we just analyze the load case 1003 which is the most dangerous case in this paper, and select the 2 key points where strains are maximal to analyze. The 2 key points are shown in Fig. 6, named as bottom edge of left front mounting joint and left edge of upper panel respectively. Under load case 1003, the pylon bears lateral rightward load and vertical downward load. Besides, because the action point is at the center of gravity of engine, the pylon also bears additional twisting and bending moment.
Fig. 6Position of maximum stress in load case 1003
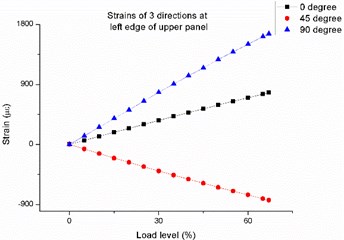
The data measured by strain gauges is shown in Fig. 7 and Fig. 8. It shows that the strain-load curve has good linearity. By calculating and analyzing, it is understood that the compression stress at bottom edge of left front mounting joint is 392.92 MPa. The maximum compression stress is due to that lateral and vertical loads are transmitted through pin to left front mounting joint and make the lug to compress and bend. The tensile stress at left edge of upper panel is 381.19 MPa. This maximum tensile stress is due to that the vertical bending moment and lateral bending moment load on pylon and bend it downwards and rightwards. Both of the results are in accordance to the structure characteristics and bearing property of the aero-engine pylon in this test.
Fig. 7Strain-load curve at bottom edge of left front mounting joint
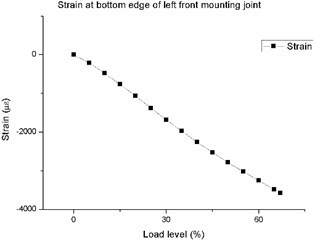
Fig. 8Strain-load curve at left edge of upper panel
5.3. Measurement results of displacement
According to the measurement results of guyed displacement sensors, the main displacement directions are different in different load cases. Under load case 1001, the displacement of heading direction is greater than that of other directions. The maximum heading displacement is 75.9 mm and takes place at the center of connection joint lug which connects brace rod and wing simulation part. Under load case 1003, the displacement of lateral direction is the main displacement. The maximum lateral displacement is 88.77 mm and takes place at the loading point, namely the center of gravity of aero-engine. Under load case 1005, the displacement of vertical direction is the main displacement. And the maximum vertical displacement is 55.81 mm. It takes place at the center of gravity of aero-engine too. These results are in accordance to the loading characteristic under each load case.
Table 10Maximum displacement under each working condition
Load case | Displacement location | Displacement direction | Value (mm) |
1001 | Connecting pin of brace rod and wing | Heading direction | 75.9 |
1003 | Loading point (gravity center of engine) | Lateral direction | -88.77 |
1005 | Loading point (gravity center of engine) | Vertical direction | -55.81 |
6. Conclusion
According to the goals and requirements of test, we design a set of test system which is suited to the static test on hyperstatic aero-engine pylon. And based on the designed scheme, successful test on hyperstatic aero-engine pylon of a certain aircraft has been carried out. During the course of test, the whole test system didn’t produce any cracks or harmful plastic deformation. The test result shows that the aero-engine pylon has met the strength and stiffness requirements under load cases such as emergency landing. Practices show that this test technology is scientific and reasonable. It effectively solves the key problems such as supporting stiffness simulation, interface load measurement and method of loading, in the static test on a hyperstatic aero-engine pylon of a certain aircraft.
References
-
Kemp J., Woods L. Live fire testing a legacy system – assessing dry bay fire potential in the new C-5M engine pylon. 50th AIAA/ASME/ASCE/AHS/ASC structures, structural dynamics, and materials conference, Palm Springs, 2009.
-
Gu S. Aircraft Conceptual Design. Beijing, Beihang University, 2009.
-
Luo J. A study on the stiffness simulation calculation method of flutter models of after body and horizontal tail of a new type aeroplane. Journal of Nanjing University of Aeronautics & Astronautics, Vol. 23, 1991, p. 121-123.
-
Zhao S. Experimental research of boundary conditions for static structure test. Structure & Environment Engineering, Issue 2, 1991, p. 35-39.
-
Fang M. A coordinate automatic control loading method in the control software for static test of a complete helicopter. Helicopter Technique, Issue 3, 1999, p. 36-40.
-
Yang M., Jiang D. Theoretical design and output signal analysis of the circular-section I-shaped beam shearing force sensor. Journal of Transducer Technology, Issue 2, 1990, p. 36-38.
-
S. F. Ma, T. K. Shiue Aircraft airworthiness certification: static bench testing of an airfoil elevator. Experimental Techniques, Vol. 27, 2003, p. 32-35.
-
Yu S., Sun B., Lou W. Pneumatic stiffness simulation of wing tunnel aeroelastic model tests for closed long-span roof. Journal of Zhejiang University, Vol. 39, 2005, p. 6-10.
-
Xu Z. Digital simulation of full scale static test of aircraft. Chinese Journal of Aeronautics, Vol. 18, 2005, p. 138-141.
-
Ramly R., Kuntjoro W., Wisnoe W., et al. Design and analysis for development of a wing box static test rig. 2010 International Conference on Science and Social Research, Kuala Lumpur, 2010.
-
Zhao Q., Ding Y., Jin H. Effects of structure stiffnesses on the load distribution of bolt group at wing root. Chinese Journal of Aeronautics, Vol. 29, 2008, p. 931-936.
About this article
This work is supported by Jiangsu Provincial Qing Lan Project and Natural Science Foundation of China (No. BK2012795), Operating Expenses of Basic Scientific Research Project (No. NS2014009) and Priority Academic Program Development of Jiangsu Higher Education Institutions.
