Abstract
One of important fields in transformer diagnostics is assessment of the mechanical condition of an active part: windings, core and leads. There are two methods which give detailed information on the condition of the active part: Frequency Response Analysis (FRA) and Vibroacoustic Method (VM). Both of these methods are not giving yet simple answers on the technical condition of a transformer. In order to examine their complementary possibilities an experiment was performed on a real transformer. There were various faults applied to the active part. Results have confirmed that each of these methods is sensitive to different changes in the active part.
1. Introduction
Detailed and reliable diagnostics of power transformers is necessary in asset management of distribution companies. Only the full information on technical condition of transformers population, together with information on each unit’s importance in the system, leads to economically and technically reasonable management. One of important fields in transformer diagnostics is assessment of the mechanical condition of an active part: windings, core and leads. There are two methods which can give detailed information on the condition of the active part: Frequency Response Analysis (FRA) and Vibroacoustic Method (VM). In the case of FRA the interpretation of test results is still difficult, especially for units without previously taken measurements which can be used for comparison. In such case comparison is done between phases or for sister or twin units. Differences in recorded curves may be result of deformation, but also can be effect of characteristic constructional details of the transformer. For VM there are many variants of modifications applied for measurements and the analysis, and the method is still under development. Each of these methods is based on different physical phenomena, so their results are complementary, allowing easier interpretation of conclusions coming from single methods.
In order to examine complementary possibilities of both test methods an experiment was performed on a real transformer. All measurements with both methods were taken on complete transformer with active part immersed in the original oil, the lid firmly attached with screws and with original bushings. On each stage of tests Frequency Response measurements were conducted and transformer was powered from 15 kV side to allow recording of Vibroacoustic signal, both in transient and steady state. There were various faults applied to the windings. Results have confirmed that each of these methods is sensitive to different changes in the active part. However interpretation of results from both methods makes easier interpretation what kind of problem there is with mechanical condition of the transformer.
2. Description of the experiment
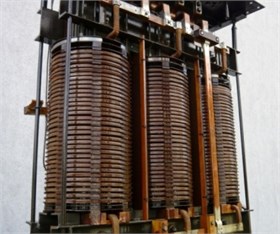
The transformer used for the experiment was a unit replaced in distribution company by a new one because of age, however it was in a very good technical condition. Its parameters were: type TONa 800/15, 15/0.4 kV, 800 kVA, year of production 1962. Transformer’s active part is presented on Fig. 1(a).
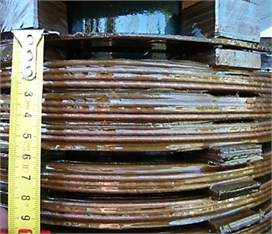
Fig. 1a) Active part of the transformer used for the experimental tests and b) top two discs of the winding lowered
a)
b)
The deformational tests were based on introducing controlled deformations to the windings and conducting measurements with FRA and VM methods. Deformations introduced into winding were based on clamping loosening and the axial shift of whole discs. There were three levels of controlled defects:
1) Loosening the winding clamping, without any additional discs displacements – D1.
2) Winding deformed by lowering the single top disc, no clamping as in previous case – D2.
3) Winding deformed by lowering two top disc, no clamping – D3 (Fig. 1(b)).
3. FRA measurements
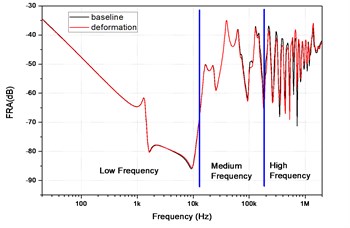
The transformer winding can be described by a set of local capacitances, self and mutual inductances and resistances. Every change in winding geometry leads to change of these parameters, which influences the shape of the transfer function. The analysis of Frequency Response measurements results is based on comparison of data presented usually as sine signal damping along frequency spectrum in logarithmic scale. Such curve can be compared to results recorded for a transformer in time intervals, between phases, between twin or sister units or with help of computer models. Time based comparison is the most reliable, but for most of old transformers there is no fingerprint data available. The next two approaches are usually applied in industrial practice, however they are quite uncertain and may lead to misinterpretations. Each transformer can have differences in FRA curve compared between phases or, if compared to other units, due to constructional differences [1]. Helpful results can be obtained from controlled deformations, but this method cannot be applied in mass scale and generalized [2]. Applicability of FRA method and various techniques of test systems and connection setups have been widely discussed [3]. At the current stage of the FRA method it is possible to perform repetitive results thanks to the use of suitable connection techniques, which is summarized in CIGRÉ document [4] in which recommendations are provided and at the present the IEEE (PC57.149/D8) and the IEC PT 60076-18 are working on the elaboration of standards under which test procedures and FRA instrument requirements are established. Frequency Response (FR) in the experiment has been measured with a commercial device FRAnalyzer from Omicron. High voltage winding, used for deformations, was delta connected, therefore the signal was also transferred through other phases, so the Frequency Response had its specific shape. All FRA tests were conducted in three leads setup: Source, Reference and Measurement. Signals are given against earth potential. Measurements results presented in the paper were taken with the Source and Reference leads connected together to the bushing at the beginning of tested winding, while Measurement lead to the bushing at its end, (“end-to-end” measurement). The Source lead gives sine signal with frequency from 20 Hz to 2 MHz or higher, Reference is used for measurement of this signal at the “input” bushing, while Measurement at the ‘output’ bushing. Frequency Response of the winding is presented on Fig. 2(a). It can be seen that changes in FR curve for baseline measurement and after introducing the deformation are not significant and are visible in higher frequencies. The frequency range has been divided into three parts: Low Frequency gives information on magnetic circuit of a transformer, Medium Frequency on significant deformations and High Frequency on smaller deformations, influence of leads etc. [5].
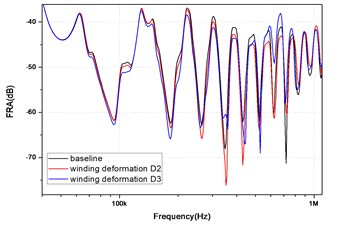
Fig. 2Frequency response of the winding before and after deformation: a) full spectrum, b) zoomed frequency range with visible differences in FR for two deformations
a)
b)
Detailed ranges limits depend on the construction of the transformer and its geometrical size – the smaller unit is the higher frequencies show its Frequency Response. In this case differences are visible in Medium and High Frequency ranges. It is clear that they come from deformations in the winding. Fig. 2(b) presents zoomed frequency range with visible differences between curves for ‘healthy’ winding and after two kinds of deformations. Axial shift of discs influenced mainly damping of FR. The deformation was not significant, as the shift of top two discs reduced the oil gap less than 1 cm (Fig. 1(b)). Nevertheless some resonances have shifted vertically even by 10 dB (350 kHz, 700 kHz). The conclusion is that such deformation can be easily detected by FRA method. No further deformation were introduced because the transformer had to be powered in order to perform vibroacoustic recordings, so the whole operations would be risky, especially with radial deformation introduced.
Presented FRA results show that described deformations cause typical changes in Frequency Response. Differences appear in expected frequency range, and have high amplitude damping changes. However, at current stage of FRA method development it would not be possible to perform inverse problem – to identify the location or size of the deformation in the winding on the base of FRA measurements.
4. Vibroacoustic measurements
The vibroacoustic diagnostics is used at present in many fields of engineering and science. Its advantage is no need to interfere in a structure of tested object. Also in the case of mechanical condition assessment of an active part of the transformer this method is used more and more often. Recommendations used for vibroacoustic measurements of transformers are over 30 years and do not include modern metrological and computational possibilities and may lead to serious misinterpretations [6]. Inside a transformer electrodynamical and magnetostriction forces influence windings and a core, causing their vibrations. These vibrations, transferred by an insulating liquid, cause vibrations of tank walls. The reason of a core vibrations is magnetostriction, leading to changes of geometrical dimensions of magnetic material located in a magnetic field. The intensity of magnetic field in the core placed inside of a winding depends on a voltage applied to the winding [7]. Vibrations of transformer construction recorded with an accelerometer attached to transformer’s tank are a superposition of mentioned vibrations of a core and windings. The latter are influenced by electrodynamical forces proportional to the square value of a current [8]. Because the force is directly proportional to the acceleration, it can be assumed that vibrations acceleration of windings is directly proportional to the square value of the current. A frequency of basic vibrations harmonic in both cases is twice as big as supplied power frequency.
Loosening and deformations of windings and core sheets are the direct causes of significant changes in frequency spectrum of recorded vibrations signal. Apart from harmonics with basic frequency 100 Hz (for 50 Hz power supply), the frequency spectrum will contain also other harmonics having various amplitudes. The shape of amplitude spectrum is strictly correlated to the character of mechanical defects in a core and windings. The assessment of vibrations in a transient state, in the first 10-20 seconds from powering a transformer without any load, may reduce the influence of some factors causing vibrations. The method of tank vibrations assessment in transient state is based on following assumptions:
1) The influence of magnetostriction phenomena on recorded vibrations is identical for transient and steady states of transformer operation, with assumption that voltage amplitude is constant.
2) The amplitude of magnetizing current in period shorter that 0.5 s from powering the transformer reaches the value several or over ten times higher than nominal currents [8], leading to vibrations of windings caused by electrodynamical forces.
3) In steady state without load the main source of transformer tank vibrations core are vibrations caused by magnetostriction phenomena. Windings vibrations are negligible low due to the lack of a load, in windings there is a magnetizing current having the amplitude considerably lower than nominal current.
Because of “interfering” influence of magnetostriction phenomena the analysis of transient state may be difficult. For example, problematic might be accurate assessment of vibrations time, caused by transient state. Vibroacoustic comparative diagnostics of windings condition of similar type transformers also is not reliable, because core’s technical condition of tested transformers might be different which influences amplitude of vibrations acceleration and amplitude spectrum in steady state operation without load. After considering assumption 1 of the presented method it is possible to reduce the influence of magnetostriction phenomena on recorded vibrations signal. It can be obtained by using a Spectral Subtraction Method – SSM [9]. SSM is one of basic methods used for reduction of interferences having additive character from sound recording and is used in sound engineering. The idea of this method can be described in the simplest realization as following: if recorded discrete signal is present with additive interference , then:
is non-interfered signal. In frequency domain:
where , , are discrete Fourier transforms of signals , and .
In a SSM method Eqs. (1) and (2) are not realized directly, but there are performed calculations based only on amplitude spectra of recorded signal and estimated interference :
leaving in spectrum phase of frequency spectrum . Coefficient 1 in the case of subtraction in amplitude spectrum domain or 2 in the case of power spectrum. The level of interferences reduction is estimated with coefficient [0, 1].
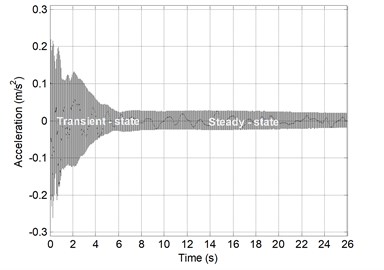
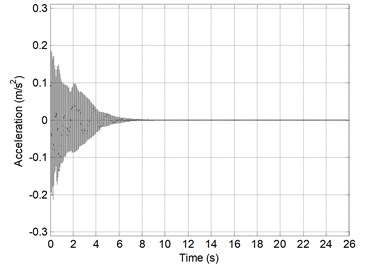
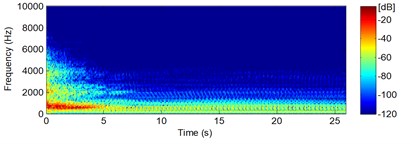
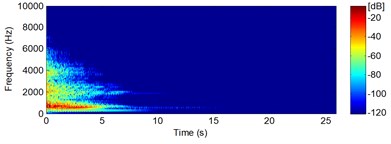
The reduction of the magnetostriction based vibrations influence is realized by treating steady state vibrations signal as the additive interference. If in Eq. (3) 1, 0.1 the final result was obtained, shown on Figs. 3 and 4: momentary value of transformer tank vibrations acceleration before (Fig. 3(a)) and after reduction (Fig. 3(b)) and vibrations spectrogram (respectively Fig. 4(a) and 4(b)).
Fig. 3Momentary value of transformer tank vibrations: a) before, b) after reducing magnetostriction phenomena
a)
b)
Fig. 4Vibrations spectrogram: a) before, b) after reducing magnetostriction phenomena
a)
b)
The value of coefficient in Eq. (3) has been determined on the base of assumption that vibrations amplitude reduction caused by magnetostriction is –40 dB, while value of 1 because the algorithm of spectral subtraction had been realized in signal amplitudes domain.
Vibroacoustic measurements on tested transformer have been taken with accelerometric vibration sensor SVAN 958. During the experiment device SVAN 958 was used as signal recorder, while mathematical analysis was conducted in MATLAB environment.
During the experimental tests on the transformer the accelerometer was mounted on the right side of the tank (on column A), in the middle of its height. For vibroacoustic analysis with SSM algorithm (V-SSM) there was taken the first ten seconds of recorded signal, starting from powering transformer without any load. Fig. 5 presents stabilization process of vibrations acceleration (envelope) with reduced influence of the magnetostriction.
Developing simulated degradation of windings mechanical condition unambiguously influences the envelope shape of vibrations acceleration signal: by loosening and deforming the winding increases the amplitude of vibrations and the time of transient state vibrations suppression is changing.
Fig. 5Stabilization process of tank vibrations for three windings deformations
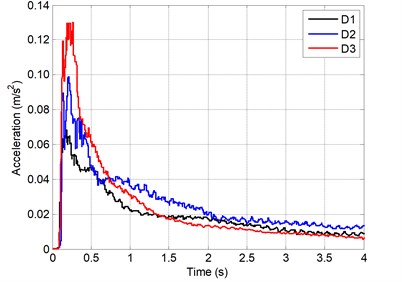
It can be concluded that e.g. after time approx. 1 s from powering the transformer the acceleration is 0.022 m/s2, 0.032 m/s2 and 0.040 m/s2, respectively for windings defects D1, D2 and D3. However it shall be noted that even though magnetostriction phenomena has been reduced, in transient state vibrate both windings and the core. Therefore the measurement with V-SSM in real conditions cannot unambiguously determine the mechanical condition of windings only. Obtained results shall be verified with FRA method.
5. Conclusions
The idea of combined FRA and VM measurements for the assessment of mechanical condition of transformer windings has been investigated and introduced into experimental deformational tests. A new approach for VM method has been presented, based not on the traditional analysis of an amplitude spectrum, but coming from analysis of stabilization of tank vibrations’ acceleration in the transient state. The vibroacoustic signal reflected vibrations of construction caused by electromagnetic forces affecting the core and windings. The influence of magnetostriction had been reduced by application of Spectral Substraction Method (V-SSM). The experiment performed on the real transformer, by the means of controlled deformations and FRA and VM measurements showed that it was possible to use both methods for the complementary analysis. The application of FRA and V-SSM measurements may give detailed information of the mechanical condition of transformer’s active part.
References
-
Jayasinghe J. A. S. B., Wang Z. D., Darwin A. W., Jarman P. N. Practical issues in making FRA measurements on power transformers. XIVth International Symposium on High Voltage Engineering, Beijing, China, 2005.
-
Banaszak S. Conformity of models and measurements of windings deformations in frequency response analysis method. Review on Electrical Engineering – Przegląd Elektrotechniczny, Vol. 86, Issue 7, 2010, p. 278-280.
-
Jayasinghe J. A. S. B., Wang Z. D., Jarman P. N., Darwin A. W. Winding movement in power transformers: a comparison of FRA measurement connection methods. IEEE Transactions on Dielectrics and Electrical Insulation, Vol. 13, Issue 6, 2006, p. 1342-1349.
-
Mechanical-condition assessment of transformer windings using frequency response analysis (FRA). Report of CIGRE Working Group A2.26, 2008.
-
Banaszak S. Sensitivity of FRA measurements to various failure modes. Review on Electrical Engineering – Przegląd Elektrotechniczny, Vol. 89, Issue 3b, 2013, p. 270-272.
-
Borucki S., Cichoń A., Subocz J., Kornatowski E. The technical assessment of core and windings in a transient state of power transformer operation. Review on Electrical Engineering – Przegląd Elektrotechniczny, Vol. 86, Issue 11b, 2010, p. 22-25, (in Polish).
-
Shenghang J., Yongfen L., Yanming L. Research on extraction technique of transformer core fundamental frequency vibration based on OLCM. IEEE Transactions on Power Delivery, Vol. 21, Issue 4, 2006, p. 1981-1988.
-
Kornatowski E. Time-frequency vibration analysis of the transformer construction. Review on Electrical Engineering – Przegląd Elektrotechniczny, Vol. 88, Issue 11b, 2012, p. 268-271, (in Polish).
-
Czyżewski A. Digital Sound. Chosen Theoretical Problems, Technology, Applications. EXIT, Warszawa, Poland, 1998, (in Polish).
