Abstract
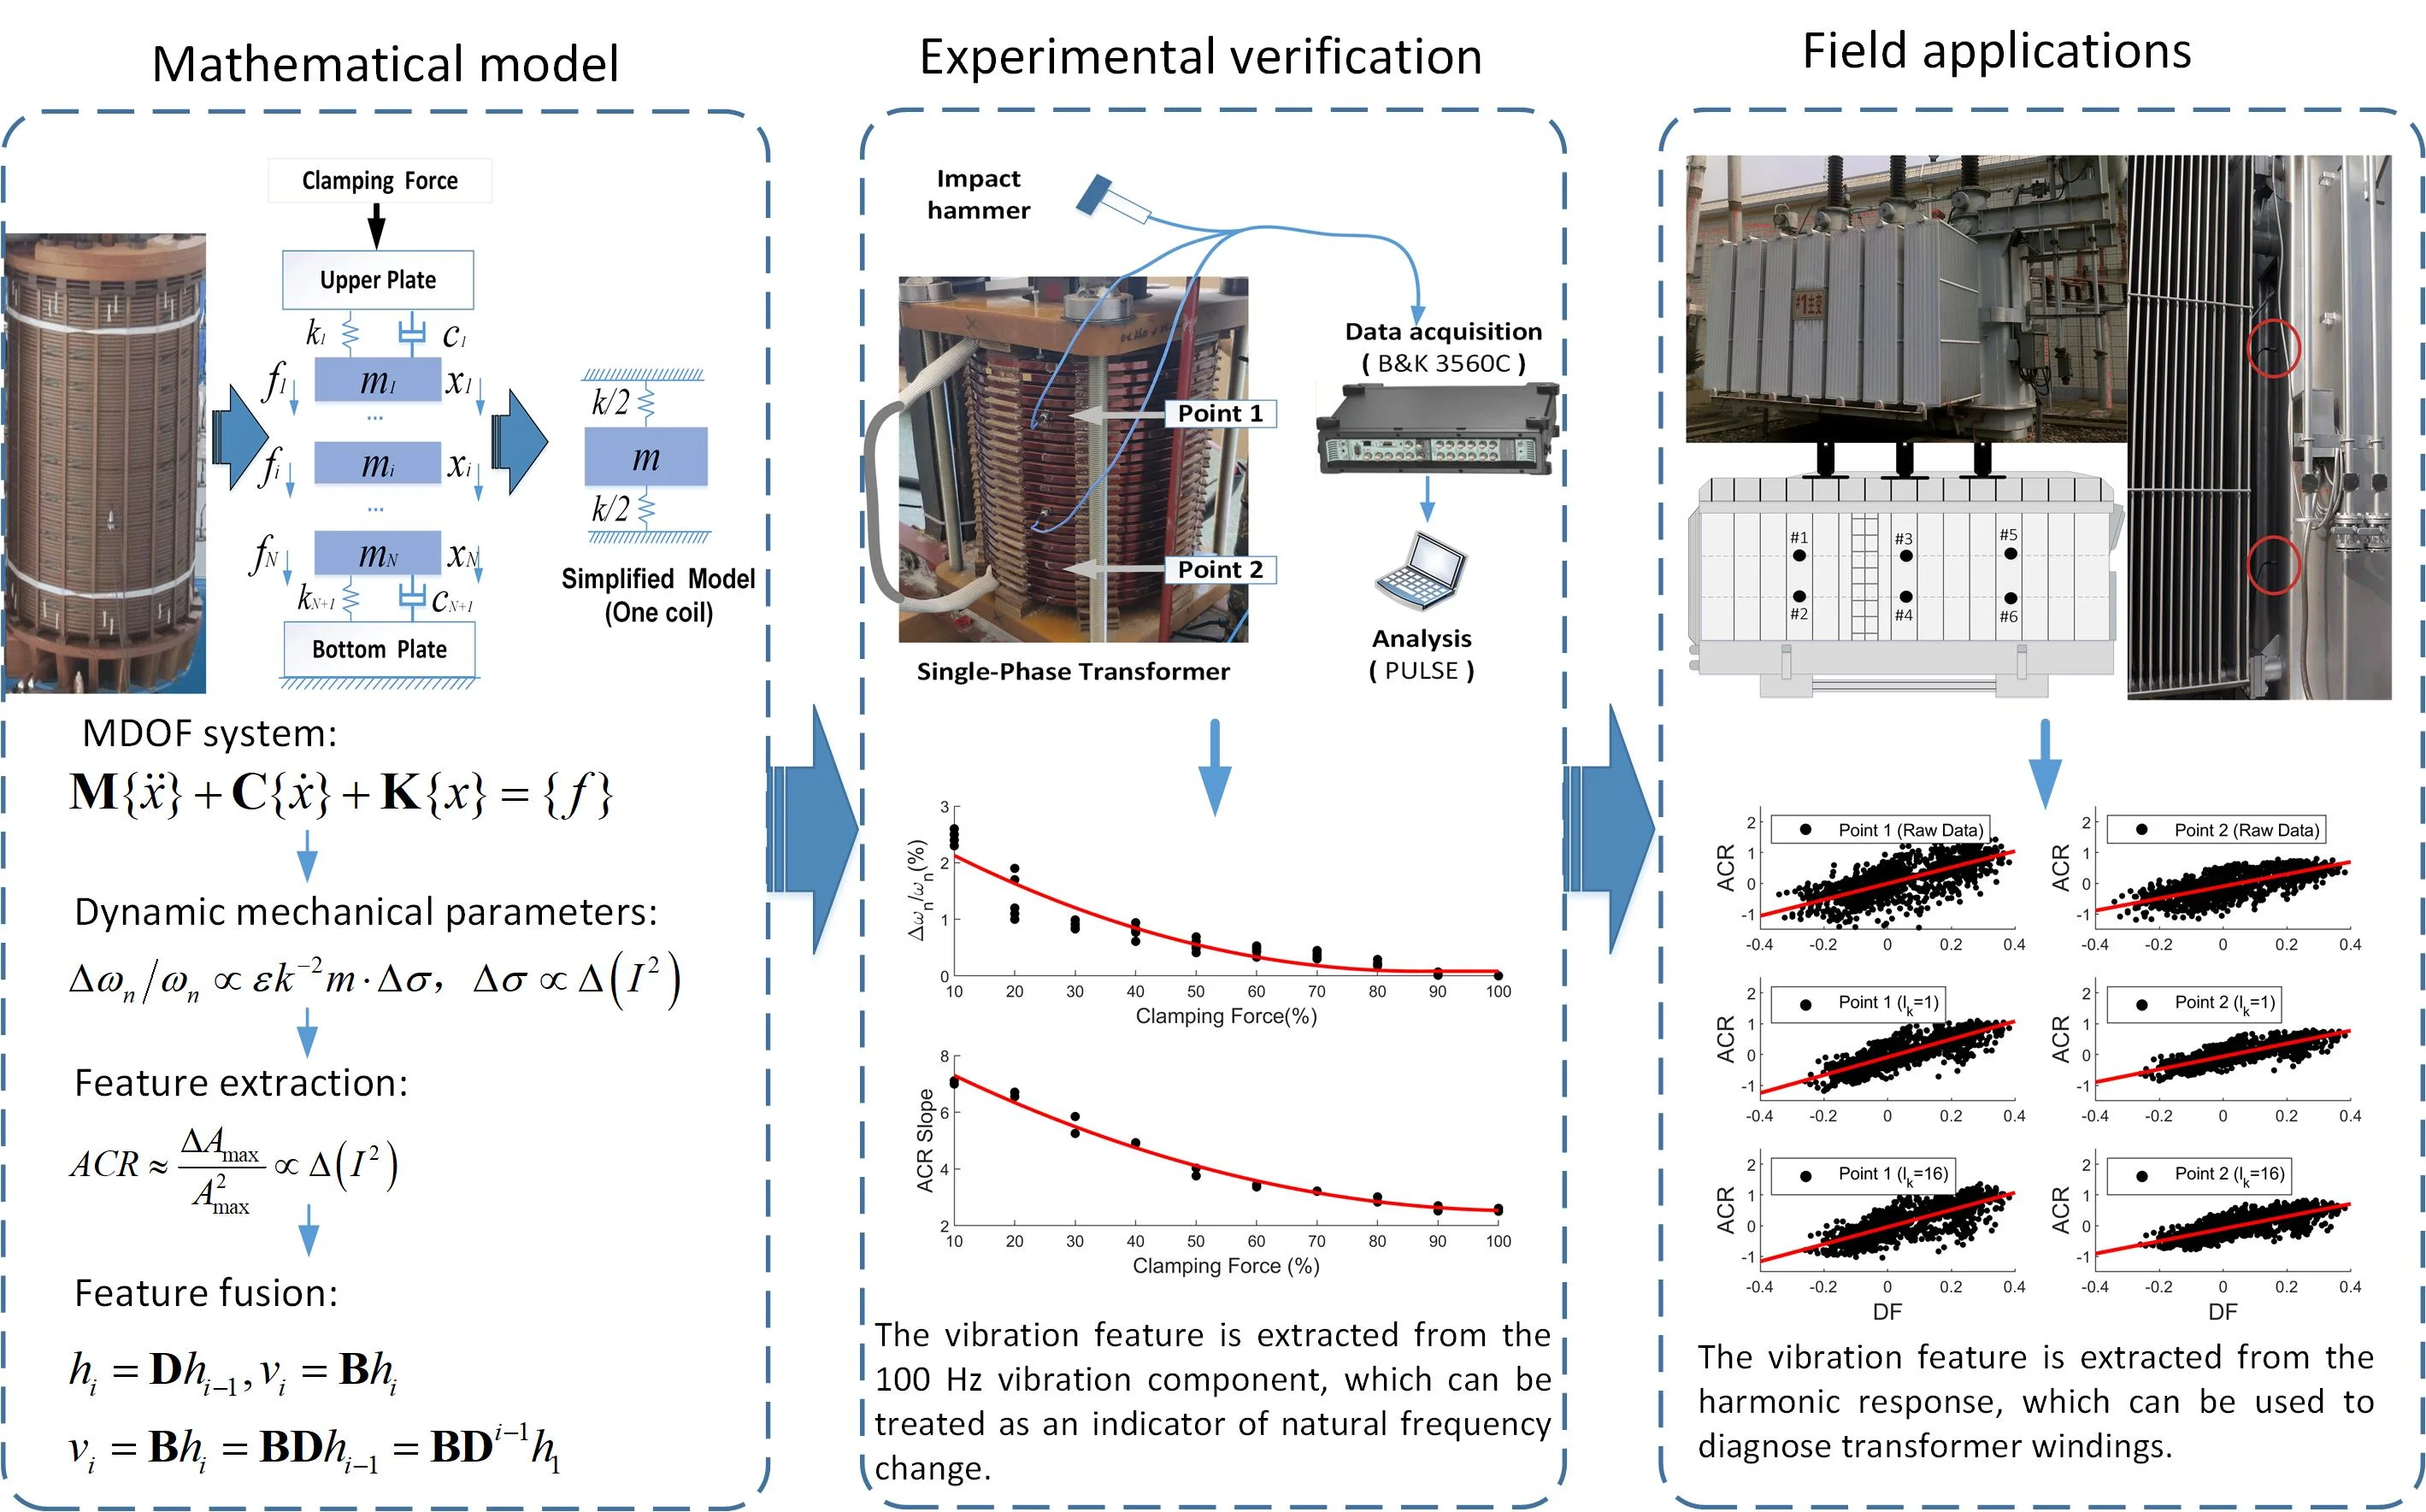
The power transformer is a key device in the power grid systems. The mechanical degradation of windings represented by the clamping force looseness will cause the decline of the short circuit withstand ability, and cause further damages. This paper proposes a clamping force diagnosis method for operating windings based on the study of the vibration response. In the theory part, the influence of the load current on the natural frequency of windings is discussed, and the influence of the natural frequency change on the steady-state vibration response is studied to obtain the vibration feature related with the clamping force. The subspace method is used to fuse two vibration sequences with the same characteristics to eliminate the measurement error. In the experiment, the free vibration test was performed on a short circuit on-load winding structure. It was proved that the natural frequency change can be extracted from the relationship between the amplitude change of the 100 Hz component and the current change. In the field tests, the vibration sequences of two typical transformers were compared, and the results show that the vibration feature extracted from the relationship between the amplitude variation and the current change contains the structural information of windings.
Highlights
- The structure of operating windings can be regarded as a dynamic system.
- The relationship between 100 Hz vibration and load contains the structural information.
- The amplitude change of the degraded transformer is more significant than that of the normal transformer under similar load fluctuations.
- The subspace-based method can effectively fuse the vibration feature of multiple points related with the same windings.
1. Introduction
As the key equipment in power grids, the reliability and safety of power transformers have always been the focus of field maintenance. At present, the frequency response analysis (FRA) and short-circuit impedance measurement are widely used to diagnose winding faults [1-3]. However, the disadvantage is that the measurement can only be carried out when the transformer is switched off. Dissolved gas analysis (DGA) can perform real-time monitoring of the gas composition in the insulating oil [4], and identify whether discharge or high temperature phenomena occur inside the tank, but it is not sensitive to the winding deformation, pressboard misalignment and other faults that do not produce gas. The current studies show that the clamping force reduction will degrade the short-circuit strength of the winding mechanical structure, which is one of the main causes of transformer damages [5, 6]. Therefore, a fault diagnosis approach for transformer windings that moves from offline to online is urgently needed.
The vibration-based fault diagnosis method for power transformers has attracted more and more attentions [7, 8]. It was proved that the transformer vibration is mainly caused by the magnetostrictive force in the core and the electromagnetic force in the windings [9]. The core vibration is related with the magnetostrictive phenomenon. Under the assumption that the transformer operates at a fixed voltage, the vibration of the iron core is constant, and contains 100 Hz component and its harmonics. The electromagnetic force is mainly produced by the interaction of current and leakage magnetic flux, whose frequency is mainly at 100 Hz. Besides, the steady-state response under harmonic excitation is affected by the structural parameters of windings.
Early in 1980, Hori et al. simplified the winding structure into a multi-degree-of-freedom model, and two methods were used to calculate the axial vibration of transformer windings under short circuit conditions [10]. Wang et al. established a 110 kV transformer model by the finite-element method, and the dynamic features of the winding vibrations were obtained through magnetic-structural coupling analysis [11]. Although the nonlinear mechanical characteristics of the insulations was taken into account, neither the influence of electromagnetic force on natural frequency nor the load-dependent harmonic response was mentioned. Wang and Zhang applied operational modal analysis to the identification of structural parameters [12, 13]. However, the assumption that the windings are randomly excited by Gaussian white noise is impossible for field transformers. We have analyzed the influence of the electromagnetic force on the winding modal parameters through experiments and finite element simulation [14, 15]. Therefore, it is important to understand the relationship between steady-state vibration and load current for operating transformers.
The steady-state vibration acquired from the transformer tank has periodic characteristics. Ji and Garcia et al. established the relationship between the fundamental frequency vibration and the input parameters such as current, voltage and oil temperature [16, 17]. It was proved that the fundamental frequency component is related with the winding condition. Hong et al. proposed a winding fault diagnosis model based on the vibration correlation of the measuring points on the tank [18]. Besides, the harmonic component of the steady-state vibration plays an important role in winding fault diagnosis. Bartoletti et al. proposed several health metrics for transformers based on the weighted harmonic amplitudes of the acquired vibrations, and it was proved that the high frequency harmonics are significant for the anomalous transformers [19]. We have proposed a lot of signal-based feature extraction methods through statistical analysis of a large number of field transformers, such as harmonic complexity and vibration similarity analysis [20]. In recent years, with the development of modern signal processing methods, variational mode decomposition (VMD) and empirical wavelet analysis were used to decompose the original vibration into different functions [21, 22]. However, these methods mainly focus on the non-stationary components of the transformer vibration, which are especially suitable for dealing with the vibrations of anomalous transformers.
In our previous studies [14, 15], the relationship between load current and natural frequency change under different clamping forces is obtained by finite element simulation and laboratory experiments. In this study, we focus on the amplitude change of the vibration response under harmonic excitations, and the related feature extraction procedure is proposed. In the laboratory experiment, the relationship between the vibration feature of the fundamental frequency and the load variation was presented for the first time. In the field tests, the variation of the vibration harmonic amplitude with load was investigated, and the feature extracted from typical samples were compared. Because the accuracy of the extracted vibration feature is limited by the sensor accuracy, the data fusion of two signals sourced from the same windings is carried out. The subspace-based method is used to eliminate measurement error and improve the accuracy of winding condition assessment [23].
2. Vibration model of operating windings
2.1. Influence of load current on natural frequency change
The disk-type winding structure of power transformers is illustrated in Fig. 1, which is composed of uniformly distributed coils and pressboards. Normally, the coil consists of copper conductors wrapped by insulating paper. It is proved that this symmetrical structure can be simplified into a multi-degree-of-freedom (MDOF) mathematical model. In the model, represents the mass of a coil, and the insulation material is represented by the combination of stiffness () and damping (). The above three parameters are known as the mechanical parameters of the windings. In addition, and represent the electromagnetic force and displacement of the -th coil, respectively. The winding unit is fixed between the upper and bottom yoke. The bottom yoke is fixed to the transformer tank, whose displacement can be considered as zero. The upper clamp provides a constant axial clamping force.
Fig. 1Mathematical model of transformer windings
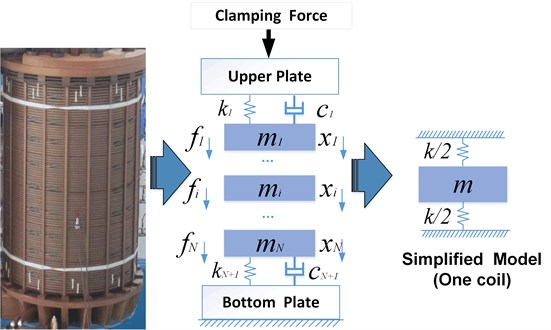
Assuming that the stiffness of the iron core and the yoke is large enough, the vibration model of the windings in the axial direction can be described as follows:
where , and are mass, damping and stiffness matrices respectively, and are displacement vector and electromagnetic force vector, respectively. Unlike the static winding model, the operating winding is influenced by the load-varying electromagnetic force when the transformer is switched on. It is proved that the electromagnetic force is proportional to the square of the current [17]:
where means the force amplitude of the -th coil. In this study, we focus on the DC component which changes the axial force distribution:
As is proved in the previous study [25], the stress-strain property of the insulations can be defined as:
where and are the strain and stress of the insulations, respectively, and and are constant coefficients. The natural frequency is related to the equivalent stiffness and mass, and is a constant coefficient:
Next, the derivative of with respect to is obtained as:
Finally, the ratio without is obtained by combining Eqs. (5) and (6):
Previous work has shown that the natural frequency of the winding structure is related to the electromagnetic force in the axial direction [15]. The normal winding structure usually has a relatively large clamping force. Therefore, the related stiffness is large, and the electromagnetic force can hardly change the natural frequency. In contrast, the natural frequency of the loose windings is more susceptible to the current change. In this study, we focus on the steady-state vibration response of an on-load windings under harmonic excitation, and the variation of the harmonic amplitude caused by load change is studied.
2.2. Influence of natural frequency change on steady-vibration
For an operating transformer, the vibration signal collected from the tank contains 100 Hz component and its harmonics. In this section, a simplified single degree-of-freedom (SDOF) system is used to demonstrate the mechanism of the amplitude change caused by the natural frequency change. Assume that the SDOF system shown in Fig. 1 is subjected to a sinusoidal force with amplitude and angular frequency :
The related steady-state response is:
The amplitude reaches the maximum value when is close to . In order to study the influence of natural frequency change on amplitude, the derivative of with respect to is obtained as:
The ratio of natural frequency change to natural frequency can be obtained by combining Eq. (9) and Eq. (10), and the displacement amplitude is replaced by the acceleration amplitude :
If the force amplitude remains constant between two measurements. Substitute Eq. (7) into Eqs. (11) to simplify the amplitude change as:
Here, a new vibration feature (amplitude change rate) is introduced, which is proportional to the change of current square, and the relationship contains the information of the winding clamping force ( and ). Note that the current value should be normalized first, whose range is from 0 to 1.
In the laboratory on-load experiment, the electromagnetic force is the only source of the winding vibrations, which has two roles. On one hand, it changes the axial clamping force, and further changes the natural frequency. On the other hand, it produces a sinusoidal response as an excitation force at 100 Hz. If the current change is slight between two adjacent measurements in the process of load current regulation, the force amplitude is treated as a constant value. So, the approximate value for the 100 Hz vibration is given as:
The aforementioned model is based on a SDOF system. However, the actual winding structure is a MDOF system. Because the harmonic components higher than 100 Hz are almost generated by the magnetostrictive force in the core, the excitation force above 200 Hz remains unchanged when the voltage of the transformer keeps fixed. According to Eq. (12), the is associated with the amplitude and force regardless of frequency, and Eq. (14) is satisfied for any excitation force and harmonic amplitude:
In fact, it is difficult to get the exact distribution of the magnetostrictive force. In this study, only the maximum amplitude in the frequency range is taken into account. It is assumed that the transformers with the same voltage level have similar magnetostrictive force distribution, and the is normalized to 1. Next, the value for an operating transformer is defined as:
In the application of this method, two requirements should be satisfied to obtain an accuracy result. First, only the transformers with similar structure are selected to make sure is close. Second, in order to acquire the vibration response of windings, the accelerometers should be fixed on the tank close to the windings. Then, the clamping force can be approximately evaluated by the relationship between and current change.
2.3. Field applications
In the field tests, six accelerometers are arranged on one side of the transformer tank, whose locations are illustrated in Fig. 2. The sensors in one column are related to one winding unit, whose positions are symmetrical with respect to the winding center. In addition, the sensor location should be close to the winding end which is subjected to a large electromagnetic force. The vibration and current signals are acquired synchronously at 10 kHz sampling rate. The data acquisition device records one-second data every minute, and the measurement continues for more than 24 hours to cover the entire load range.
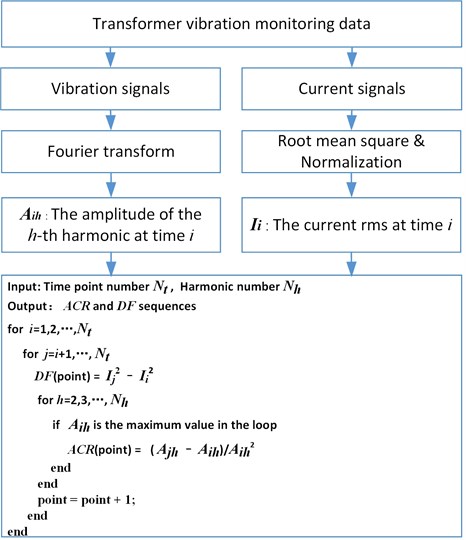
The vibration acquired from the transformer tank is a mixed signal, and we focus on the harmonic components with frequencies larger than 100 Hz. Based on the aforementioned theory, the vibration features of each location can be extracted by using the procedures shown in Fig. 3. is the amplitude of the -th harmonic at time index , which has a negative value when the absolute value of the amplitude and the current RMS change synchronously, otherwise it has a positive value. The time point number depends on the sampling interval. For example, if the interval is set to one hour, is 24 for a one-day period. Since the vibration component is mainly concentrated in the range of 0 to 1000 Hz, the harmonic number is set to 10. The and sequences are obtained by comparing the harmonic amplitudes and currents in a loop. In addition, each element in the sequence represents the electromagnetic force change between two selected samples.
Fig. 2Sensor arrangement in the field tests
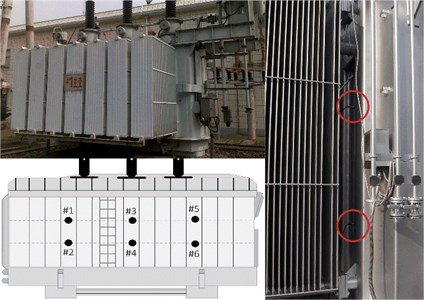
Fig. 3Flowchart of the vibration feature extraction procedure
2.4. Vibration feature fusion
The accuracy of the sequence is highly restricted by the accelerometer sensitivity. According to the relationship between the sequence and sequence, the subspace method is used as the feature fusion approach to decrease the influence of measurement noise. Suppose and are the observation vector and the hidden sate vector at time , respectively. Here, consists of the -th element in the sequence from several related sensors. The length of the vector is an undetermined parameter, which is denoted as , Then, the deterministic linear dynamical system is expressed as:
where D and B are the transition matrix and emission matrix, respectively. Next, the general form of is shown as:
The related Hankel matrix is formed from the stacking consecutive observation vectors. If the observation length is 6, and the stacking order is 3, then the Hankel matrix is:
According to Eqs. (17), the matrix can be expressed as:
Next, SVD decomposition is performed on :
is named as the extended observability matrix. Ideally, the matrix contains the singular values up to the dimension of the hidden variables, and the remaining singular values equal zero. The hidden variables can be estimated by the product of two submatrices as:
Finally, the output reconstruction matrix is defined as:
where is the number of vibration channels. If 1, the reconstructed signals of all channels have the same pattern. However, the difference among the output signals gradually increases as the value increases.
2.5. Total scheme
The proposed online fault diagnosis method for power transformers is summarized in Fig. 4. First, the multi-channel vibrations and current signals should be acquired synchronously. Next, the feature extraction procedure is carried out as is shown in Fig. 3. In this study, the extracted sequences are obtained from the data set of 24 hours. Next, the feature fusion scheme is performed on the related channels, such as point 1 and point 2 in Fig. 2. In the final step, the relationship between the reconstructed vibration sequence and force change sequence is evaluated, which is used to assess the winding conditions.
3. Experimental verification
3.1. Experimental setup
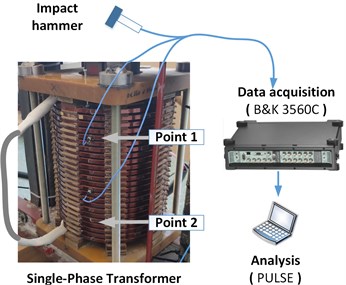
The power transformer is a kind of high voltage equipment, whose service life is more than 10 years. Therefore, it is impossible to perform a run-to-failure test on an in-service transformer. In the laboratory experiment, a 10 kVA single-phase transformer model was adopted to verify the influence of load current on the steady-state vibration of windings under different conditions, which is shown in Fig. 5. The rated voltage of the high-voltage terminal and the low-voltage terminal is 415 V and 240 V, respectively. The on-load experiment was carried out on the transformer by short-circuiting the low voltage side, and applying voltage to the high-voltage terminal. During the experiment, the current was adjusted from 0 % to 100 % by AC voltage regulator. In order to ensure the safety of the experiment, the input voltage should not exceed 48 V. During the experiment, the fifth coil was selected as point 1, and the symmetric 20-th coil was selected as point 2. According to the FEM simulation results in [14], the location of the measuring point has no effect on the natural frequency change of the obtained vibration. The impact hammer was used to excite the winding in the vertical direction. The accelerometers PCB 356A03 were fixed on the coil by adhesive, and the data acquisition instrument B&K 3560C recorded the vibration signal before and after the impact. In the process of clamping force adjustment, the torque wrench applied a specific torque through the tightening bolt, and 2.4 MPa stress on the pressboard is regarded as a 100 % clamping force.
Fig. 4Flowchart of the winding fault diagnosis procedure
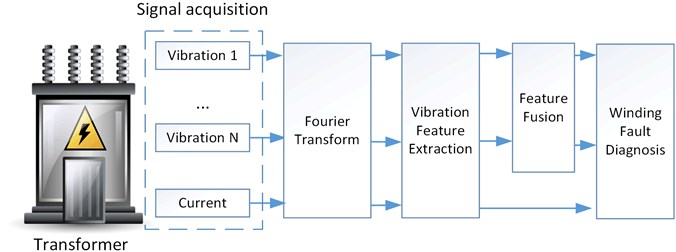
Fig. 5Experimental platform of operating windings
3.2. Data analysis and discussions
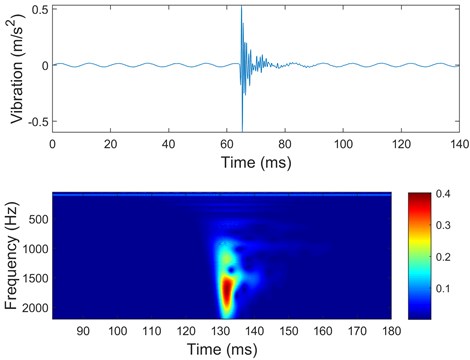
Taking the vibration signal under 30 % clamping force and 100 % current as an example, the vibration of point 1 in the time-frequency domain is shown in Fig. 6. The signal not only contains the steady-state characteristics of the windings under 100 Hz electromagnetic force, but also contains the free vibration characteristics after an impact. The vibration contains two kinds of information. First, according to Eq. (13), the 100 Hz amplitude of the steady state vibration is used to explore the relationship between load change and amplitude change. Second, as is shown in Eq. (7), the relationship between load change and natural frequency change can be obtained by analyzing the free vibration.
Fig. 6The vibration in the time-frequency domain
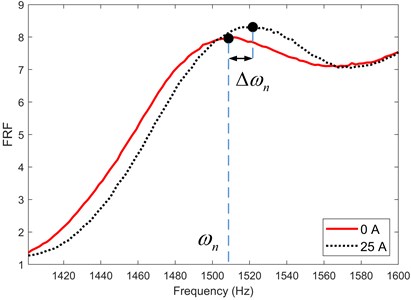
The frequency response function (FRF) is defined as the ratio of the output response to the exciting force of the hammer. Fig. 7 shows the effect of load current on FRFs under loose stress conditions, and only one peak is illustrated. The clamping force of the normal windings is 100 % (about 2.4 MPa), while the clamping force of the loose windings is 30 %. The peak in the FRF curve is regarded as a natural frequency of the winding structure, and the natural frequency change means the peak movement between static state and full load. Because point 1 and point 2 are centrosymmetric, they contain similar vibration information.
Fig. 7Influence of current on FRFs of loose windings
The natural frequency change under different clamping force is summarized in Fig. 8, which is obtained by calculating the peak movements of the FRFs. Obviously, the natural frequency change is zero under 100 % clamping force, However, as the frequency increases, the natural frequency change becomes more significant under 30 % clamping force. According to Eq. (7), the ratio of natural frequency change to natural frequency is related to the equivalent stiffness, which can be treated as a health parameter for clamping force assessment.
The 100 Hz steady-state vibrations are widely studied in the previous research. The 100 Hz vibration amplitudes under different loads are shown in Fig. 9. It was proved that the amplitude is proportional to the square of the current [16, 17].
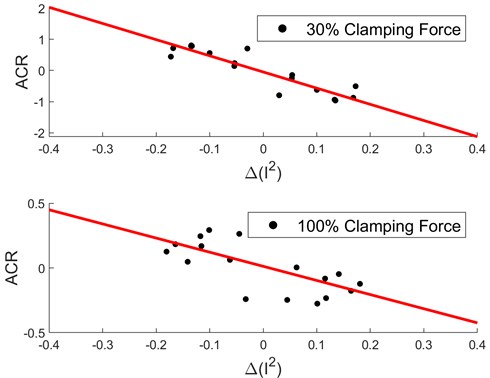
As is defined in Eq. (13), we extract the parameter from two adjacent measurements. Fig. 10 shows the relationship between the value of 100 Hz component and the change of current squared for point 1. According to Eq. (13), the slope of the fitted line is related to the equivalent stiffness of the structure. The greater the clamping force, the smaller the slope value.
Fig. 8Natural frequency change due to load change
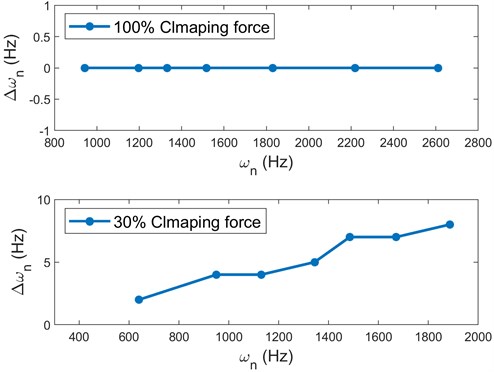
Fig. 9100 Hz vibration amplitude as a function of current
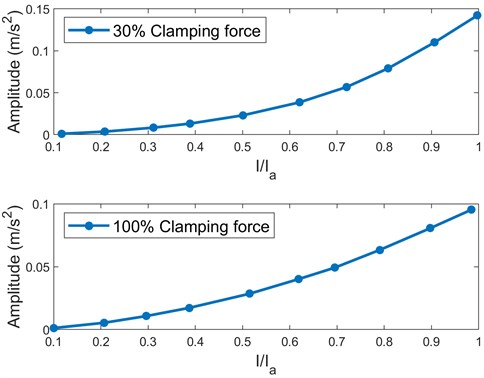
Fig. 10Influence of current change on vibration feature
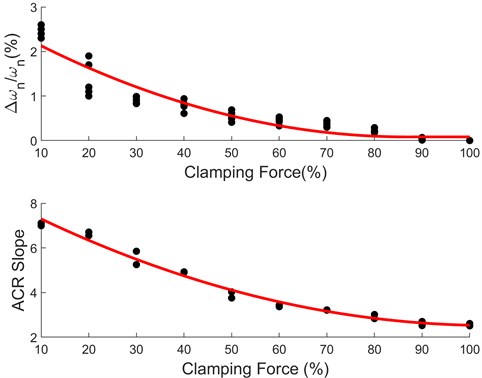
Based on the above results, two parameters for operating windings are extracted: the ratio of natural frequency change to natural frequency at rated current (/), and the slope under harmonic excitation. The relationship between natural frequency change and clamping force is shown in Fig. 11. When the clamping force is greater than 70 %, the natural frequency hardly changes with load. Referring to Fig. 10, the slopes of point 1 and point 2 under different clamping forces are extracted, and the results are also shown in Fig. 11. According to Eq. (7) and Eq. (12), two parameters are both related to the equivalent stiffness , so the red fitted curves have the same trend.
Fig. 11Relationship between vibration features and clamping force
4. Field applications
4.1. Transformer samples
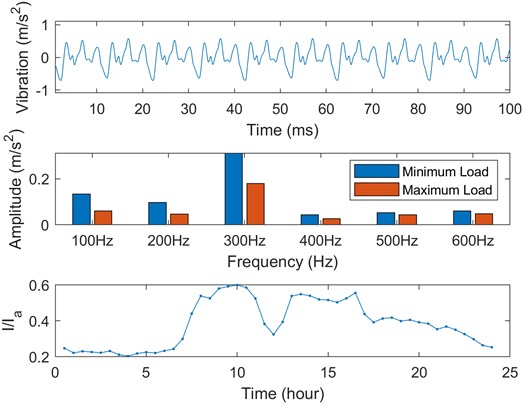
In the field applications, two typical 110 kV power transformers are selected, one is a normal sample, and the other is a degraded sample. The model of the normal transformer is SZ10-50000/110, which has been in use for only three years, and no anomaly was found during routine condition monitoring. The model of the degraded transformer is SZ9-40000/110, which has suffered many short-circuit impacts in the past 12 years. According to the short-circuit impedance (SCI) test results, the SCI change rates of three individual windings of the degraded transformer are 0.81 %, 1.08 % and 1.24 %, respectively. In contrast, the SCI value of the normal transformer is close to 0. In the field test, the vibrations of six points were acquired synchronously, and the vibrations in the time and frequency domain of one point (Point 1) are shown in Fig. 12 and Fig. 13 respectively. The current RMS trend for each transformer is also included in the figures, and the frequency components under maximum load and minimum load are compared. The vibration of the normal transformer mainly concentrates at 400 Hz, and that of the degraded transformer mainly concentrates at 300 Hz. However, there is no evidence that the amplitude and frequency of the harmonics can be used as a diagnostic parameter.
In order to show the change of the vibration frequency with load, the centroid frequency within the frequency range from 0 to 1000 Hz is defined as:
where represents the vibration amplitude at frequency . According to Fig. 12 and Fig. 13, the load trends of two transformers over 24 hours are similar. Fig. 14 compares the centroid frequency trends of the selected points over 24 hours. The centroid frequency of the normal transformer changes slightly with load, and the fluctuation is within 20 Hz. In contrast, the centroid frequency of the degraded transformer changes dramatically with load, and the fluctuation is larger than 100 Hz.
Fig. 12Steady-state vibrations of the normal transformer
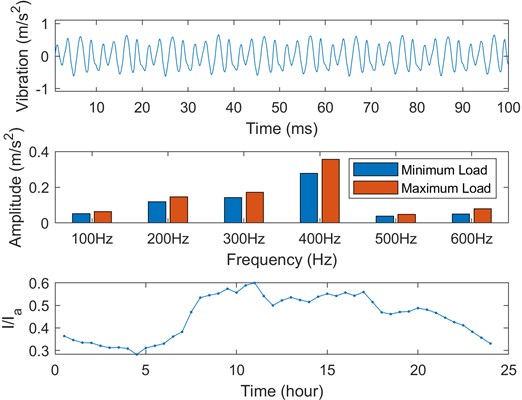
Fig. 13Steady-state vibrations of the degraded transformer
4.2. Data analysis and discussions
Based on the vibration monitoring data, the sequence and sequence of each point are extracted according to the flow chart shown in Fig. 3. Both point 1 and point 2 are related to the same winding structure (Phase A), which are selected as the input of the feature fusion. The feature sequence length is 1128 when 24. Fig. 15 shows the sequence and sequence of the normal transformer. In the figure, the sequence after fusion and the original sequence are compared. According to the flowchart in Fig. 3, the sequence is obtained by using cycle compare method, which has obvious periodicity. It is proved that the subspace-based method can effectively remove the noise and keep the useful information.
Fig. 14Comparison of the centroid frequency trends
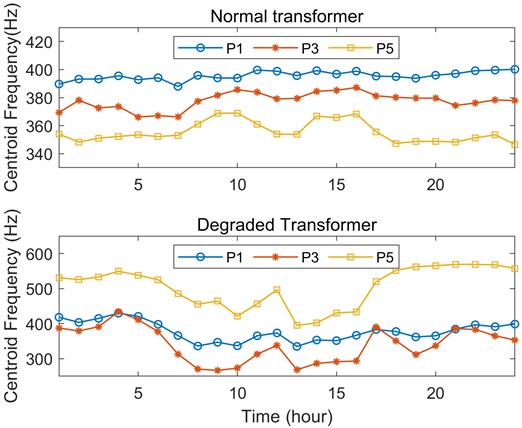
Fig. 15ACR sequences before and after feature fusion
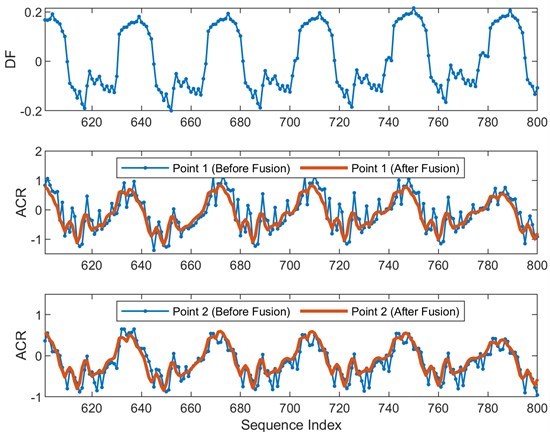
Fig. 16 shows the effect of the hidden sate vector length on the fusion results. 1 means only the first principal component is retained. In other words, the sequences from two points are combined into one. However, the difference of two points after fusion becomes significant as the value increases. In this paper, the stacking order is three times the value.
As is shown in Fig. 17, the relationship between sequence and sequence for the normal transformer is represented by a scatter graph, and the results under different fusion parameters are also compared. The red fitted line is obtained by the least square method, which passes through the origin of coordinates. According to Eq. (12) and Eq. (15), the slope of the fitted line is related to the equivalent stiffness, which can be used to assess the winding clamping force. The parameter RMSE (root mean square error) between the measurement points and the fitting results is used to evaluate the fusion effect. Table 1 lists the corresponding results of Fig. 17. Compared with the raw data, the feature fusion can effectively reduce the RMSE value and improve the fitting accuracy.
Fig. 16Influence of the vector length on the fusion results
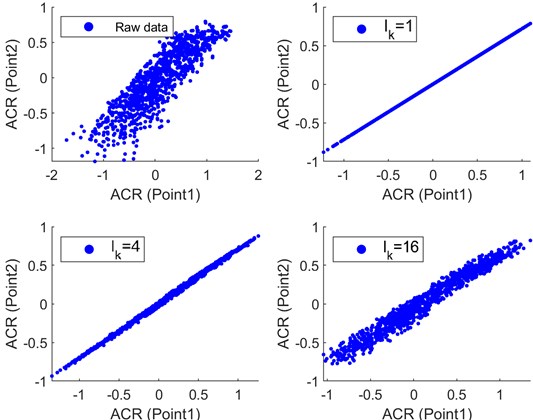
Fig. 17Vibration feature distribution for the normal transformer
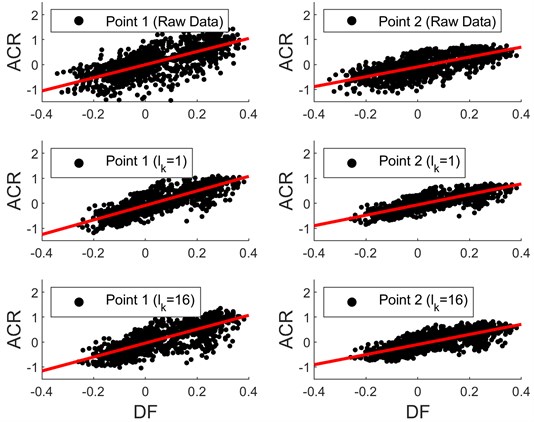
Table 1Vibration features for the normal transformer
Original data | Fusion (1) | Fusion ( 16) | ||||
Location | Slope | RMSE | Slope | RMSE | Slope | RMSE |
Point 1 | 2.63 | 0.41 | 2.90 | 0.28 | 2.79 | 0.34 |
Point 2 | 1.97 | 0.29 | 2.08 | 0.20 | 2.02 | 0.24 |
Point 3 | 1.84 | 0.21 | 1.67 | 0.17 | 1.65 | 0.19 |
Point 4 | 1.51 | 0.12 | 1.34 | 0.09 | 1.34 | 0.10 |
Point 5 | 1.46 | 0.17 | 1.65 | 0.08 | 1.59 | 0.11 |
Point 6 | 2.01 | 0.16 | 1.98 | 0.13 | 2.01 | 0.14 |
Referring to our previous study in [20], 20 healthy transformer samples are selected, and the related slopes are shown in Fig. 18. Note that each transformer has six sensors, which correspond to six samples in the figure. Finally, 100 samples are obtained after the invalid data is discarded. The Gaussian function model is used to fit the sample distribution, and the related probability density function is also shown in the figure. The statistical results show that the average value is 2, which is close to the feature value of the typical sample.
Fig. 18Vibration feature distribution for normal transformers
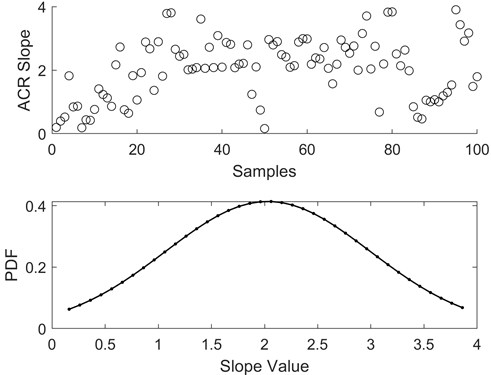
Fig. 19 illustrates the relationship between sequence and sequence for the degraded transformer. The related slope and RMSE values are concluded in Table 2. Refer to the trend of the slope with clamping force shown in Fig. 11, the larger the slope value, the smaller the clamping force for the windings with similar structure. The slope values of the degraded transformer are larger than that of the normal transformer, which indicates that the degraded transformer may have loose winding structure. This conclusion is consistent with the results of the SCI approach.
Fig. 19Vibration feature distribution for the degraded transformer
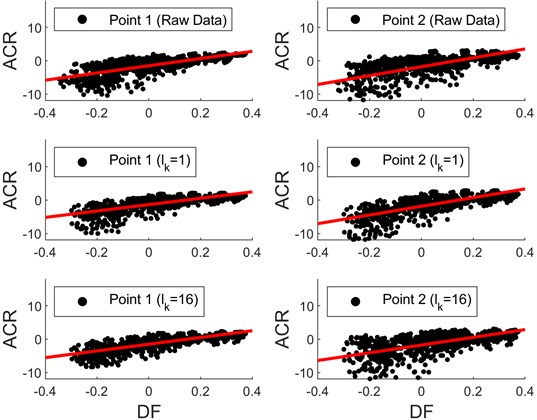
In this section, the vibration features from two typical field transformers are analyzed, and both transformers have the maximum vibration amplitude at 300 Hz or 400 Hz. The vibration of the degraded sample changes more significantly under similar load fluctuation, which corresponds to a greater slope. The vibrations from 20 normal transformers are investigated to show the dispersion of different samples. The statistical results show that the selected normal transformer is representative of all normal transformers of the same voltage level. The feature fusion approach can reduce noise effectively. When 1, the input sequences are combined into one, which results in a minimum fitting error.
Table 2Vibration features for the degraded transformer
Original data | Fusion (1) | Fusion (16) | ||||
Location | Slope | RMSE | Slope | RMSE | Slope | RMSE |
Point 1 | 16.0 | 2.33 | 13.0 | 1.64 | 12.4 | 1.68 |
Point 2 | 12.6 | 2.68 | 12.4 | 1.57 | 12.8 | 1.97 |
Point 3 | 17.1 | 2.67 | 14.8 | 2.10 | 16.2 | 2.01 |
Point 4 | 18.4 | 3.57 | 16.9 | 2.39 | 15.5 | 2.58 |
Point 5 | 10.8 | 1.68 | 9.53 | 1.48 | 10.1 | 1.39 |
Point 6 | 13.3 | 2.94 | 12.9 | 2.02 | 11.6 | 2.45 |
5. Conclusions
In this study, the amplitude change of the steady-state vibration response under harmonic excitation is used to diagnose transformer windings, which is based on the relationship between load current and nature frequency change for operating transformer windings. In the experiment, the impact test was performed on an on-load winding structure, and the results show that the natural frequency is increased with the increase of load current, which leads to the change of the steady-state response. Both natural frequency change rate and amplitude change rate () can be used to assess the winding clamping force of the experimental transformer. In the field tests, two typical transformers were compared, including one normal sample and one degraded sample. The results show that the amplitude change of the degraded transformer is more significant than that of the normal transformer under similar load fluctuations. In order to identify the slight change of vibration amplitude caused by current fluctuation, subspace-based method is used to fuse the vibration feature sequence of multiple points related with the same windings. The results show that the slope of the degraded transformer is larger than that of the normal transformer.
References
-
V. Nurmanova, M. Bagheri, A. Zollanvari, K. Aliakhmet, Y. Akhmetov, and G. B. Gharehpetian, “A new transformer FRA measurement technique to reach smart interpretation for inter-disk faults,” IEEE Transactions on Power Delivery, Vol. 34, No. 4, pp. 1508–1519, Aug. 2019, https://doi.org/10.1109/tpwrd.2019.2909144
-
M. Bagheri, M. Naderi, T. Blackburn, and T. Phung, “Frequency response analysis and short-circuit impedance measurement in detection of winding deformation within power transformers,” IEEE Electrical Insulation Magazine, Vol. 29, No. 3, pp. 33–40, May 2013, https://doi.org/10.1109/mei.2013.6507412
-
J. Liu, Z. Zhao, C. Tang, C. Yao, C. Li, and S. Islam, “Classifying transformer winding deformation fault types and degrees using FRA based on support vector machine,” IEEE Access, Vol. 7, pp. 112494–112504, 2019, https://doi.org/10.1109/access.2019.2932497
-
X. Li, H. Wu, and D. Wu, “DGA interpretation scheme derived from case study,” IEEE Transactions on Power Delivery, Vol. 26, No. 2, pp. 1292–1293, Apr. 2011, https://doi.org/10.1109/tpwrd.2010.2091325
-
L. Naranpanawe, C. Ekanayake, T. K. Saha, and P. K. Annamalai, “Influence of moisture dependency of pressboard on transformer winding clamping pressure,” IEEE Transactions on Dielectrics and Electrical Insulation, Vol. 24, No. 5, pp. 3191–3200, Oct. 2017, https://doi.org/10.1109/tdei.2017.006206
-
L. Naranpanawe, C. Ekanayake, and T. K. Saha, “Measurements on pressboard to understand the effect of solid insulation condition on monitoring of power transformer winding clamping pressure,” IET Science, Measurement and Technology, Vol. 13, No. 2, pp. 186–192, Mar. 2019, https://doi.org/10.1049/iet-smt.2018.5096
-
M. Bagheri, M. S. Naderi, and T. Blackburn, “Advanced transformer winding deformation diagnosis: moving from off-line to on-line,” IEEE Transactions on Dielectrics and Electrical Insulation, Vol. 19, No. 6, pp. 1860–1870, Dec. 2012, https://doi.org/10.1109/tdei.2012.6396941
-
S. Saponara, L. Fanucci, F. Bernardo, and A. Falciani, “Predictive diagnosis of high-power transformer faults by networking vibration measuring nodes with integrated signal processing,” IEEE Transactions on Instrumentation and Measurement, Vol. 65, No. 8, pp. 1749–1760, Aug. 2016, https://doi.org/10.1109/tim.2016.2552658
-
M. Bagheri, A. Zollanvari, and S. Nezhivenko, “Transformer fault condition prognosis using vibration signals over cloud environment,” IEEE Access, Vol. 6, pp. 9862–9874, 2018, https://doi.org/10.1109/access.2018.2809436
-
Y. Hori and K. Okuyama, “Axial vibration analysis of transformer windings under short circuit conditions,” IEEE Transactions on Power Apparatus and Systems, Vol. PAS-99, No. 2, pp. 443–451, Mar. 1980, https://doi.org/10.1109/tpas.1980.319680
-
S. Wang, S. Wang, N. Zhang, D. Yuan, and H. Qiu, “Calculation and analysis of mechanical characteristics of transformer windings under short-circuit condition,” IEEE Transactions on Magnetics, Vol. 55, No. 7, pp. 1–4, Jul. 2019, https://doi.org/10.1109/tmag.2019.2898183
-
Y. Wang and J. Pan, “Applications of operational modal analysis to a single-phase distribution transformer,” IEEE Transactions on Power Delivery, Vol. 30, No. 4, pp. 2061–2063, Aug. 2015, https://doi.org/10.1109/tpwrd.2015.2412696
-
F. Zhang, S. Ji, H. Ma, and T. K. Saha, “Operational modal analysis of transformer windings,” IEEE Transactions on Power Delivery, Vol. 35, No. 3, pp. 1285–1298, Jun. 2020, https://doi.org/10.1109/tpwrd.2019.2939388
-
K. Hong, J. Pan, and M. Jin, “Transformer condition monitoring based on load-varied vibration response and GRU neural networks,” IEEE Access, Vol. 8, pp. 178685–178694, 2020, https://doi.org/10.1109/access.2020.3027834
-
K. Hong, M. Jin, and H. Huang, “Transformer winding fault diagnosis using vibration image and deep learning,” IEEE Transactions on Power Delivery, Vol. 36, No. 2, pp. 676–685, Apr. 2021, https://doi.org/10.1109/tpwrd.2020.2988820
-
B. Garcia, J. C. Burgos, and A. M. Alonso, “Transformer tank vibration modeling as a method of detecting winding deformations-part II: experimental verification,” IEEE Transactions on Power Delivery, Vol. 21, No. 1, pp. 164–169, Jan. 2006, https://doi.org/10.1109/tpwrd.2005.852275
-
J. Shengchang, L. Yongfen, and L. Yanming, “Research on extraction technique of transformer core fundamental frequency vibration based on OLCM,” IEEE Transactions on Power Delivery, Vol. 21, No. 4, pp. 1981–1988, Oct. 2006, https://doi.org/10.1109/tpwrd.2006.876665
-
K. Hong, H. Huang, and J. Zhou, “Winding condition assessment of power transformers based on vibration correlation,” IEEE Transactions on Power Delivery, Vol. 30, No. 4, pp. 1735–1742, Aug. 2015, https://doi.org/10.1109/tpwrd.2014.2376033
-
C. Bartoletti et al., “Vibro-acoustic techniques to diagnose power transformers,” IEEE Transactions on Power Delivery, Vol. 19, No. 1, pp. 221–229, Jan. 2004, https://doi.org/10.1109/tpwrd.2003.820177
-
K. Hong, H. Huang, Y. Fu, and J. Zhou, “A vibration measurement system for health monitoring of power transformers,” Measurement, Vol. 93, pp. 135–147, Nov. 2016, https://doi.org/10.1016/j.measurement.2016.07.002
-
K. Hong, L. Wang, and S. Xu, “A variational mode decomposition approach for degradation assessment of power transformer windings,” IEEE Transactions on Instrumentation and Measurement, Vol. 68, No. 4, pp. 1221–1229, 2019, https://doi.org/10.1109/tim.2018.2865048
-
M. Zhao and G. Xu, “Feature extraction of power transformer vibration signals based on empirical wavelet transform and multiscale entropy,” IET Science, Measurement and Technology, Vol. 12, No. 1, pp. 63–71, Jan. 2018, https://doi.org/10.1049/iet-smt.2017.0188
-
A. Swindlehust, R. Roy, B. Ottersten, and T. Kailath, “A subspace fitting method for identification of linear state-space models,” IEEE Transactions on Automatic Control, Vol. 40, No. 2, pp. 311–316, 1995, https://doi.org/10.1109/9.341800
-
Q. Mayyala, K. Abed-Meraim, and A. Zerguine, “Structure-based subspace method for multichannel blind system identification,” IEEE Signal Processing Letters, Vol. 24, No. 8, pp. 1183–1187, Aug. 2017, https://doi.org/10.1109/lsp.2017.2715418
-
H. Zhou, K. Hong, H. Huang, and J. Zhou, “Transformer winding fault detection by vibration analysis methods,” Applied Acoustics, Vol. 114, pp. 136–146, Dec. 2016, https://doi.org/10.1016/j.apacoust.2016.07.024
Cited by
About this article

This work was supported by the Open Fund of Beijing Key Laboratory of Distribution Transformer Energy-Saving Technology (China Electric Power Research Institute) under Grant PDB51202001515.
