Abstract
This study presents a Lamb wave-based probabilistic fatigue life prediction for riveted lap joints. First, a brief introduction is given for the experiment of Lamb wave-based damage detection. Three damage sensitive features (correlation coefficient, amplitude change and phase change) are employed to correlate the fatigue crack size with Lamb wave signal. Then the probability of detection (POD) method is used to couple the actual crack size with the model predictions using Lamb wave signal. Considering the uncertainties of the initial crack size and crack growth parameters, Bayesian method and Markov Chain Monte Carlo (MCMC) simulation are applied to obtain the probabilistic fatigue life. In order to verify the reliability of the proposed probabilistic fatigue life prediction procedure, one set of experimental data is used for validation purpose.
1. Introduction
Structural health monitoring (SHM) is of critical importance to provide the safety, reliability and affordability for structures [1]. As one of the most common failure modes for aviation structures, fatigue damage greatly impacts the long term durability of structures [2]. So fatigue diagnosis and prognosis are important parts for structural health monitoring [3]. Lamb wave-based non-destructive evaluation (NDE) is widely used in SHM, and the validity of this method is proved by [4, 5]. The quality of NDE using Lamb wave-based method depends on many uncertain factors, including the sensitivity of inspection instruments, the service condition of target systems [6]. Therefore, the reliability and accuracy of the NDE method need to be concerned for an effective SHM system. Probability of detection (POD) is one of the common used methods to quantify the reliability of NDE method [6, 7], and it evaluates the accuracy of the detection devices and the damage quantitative models.
Riveted lap joints have been increasingly used in aviation structures because of the light weight and excellent structural performance [8]. Riveted lap joints are subject to cracks initiation arising from stress concentration in the vicinity of the rivet holes. Schindel et al. [9] applied Lamb waves using air-coupled transducers to adhesively bonded aluminum plates for damage detection. A structural health monitoring strategy is proposed in [10] to detect disbands in a composite lap-joint, considering the effect of joint geometry using a within-the-bond approach.
Among all the studies focus on Lamb wave-based damage detection for lap joints, few have been reported on probabilistic fatigue life prediction for the Lamb wave-based damage quantitative method. In this study, the POD method is employed to investigate the reliability of the Lamb wave-based fatigue damage evaluation, and a probabilistic fatigue life for riveted lap joint is obtained.
2. Lamb wave-based fatigue crack quantification
In this study, piezoelectric (PZT) sensor is employed to perform the fatigue crack detection for riveted lap joints under fatigue cyclic loading. The specimens are three rivet rows by five rivets wide lap joints and are made of 1.6 mm aircraft grade Al 2024-T3 sheets. Specimens consist of two aluminum panels, the top panel has a countersunk hole and the bottom panel has a straight hole. The countersunk hole in the first row is marked as the target area in this study. PZTs are used as the actuator to excite guided Lamb wave, as well as the sensor to acquire the wave reflection from the boundaries of the fatigue crack at the edge of bolt joints. The pitch-catch configuration is employed in this study. The hot spots, which are vulnerable to fatigue crack according to existing data, are monitored by travelling optical microscope with a CCD camera during the fatigue testing process. Specific experimental information can be referred to [11]. Total seven specimens are used in the current investigation. Six of them are made from the same manufacture, the other one is from a different manufacture, as shown in Fig. 1(a) (NRC). At each of the measurement points shown in Fig. 1(a), fatigue testing experiment is paused and the Lamb waves are generated by the actuator and the transmitted waves are collected by the sensors.
Three crack sensitive features (the correlation coefficient, normalized amplitude, and phase change between the damage signal and the baseline signal) are used to quantify the fatigue crack size, shown in Eq. (1). The parameters of the model are presented in Table 1.
where – rack size, – correlation coefficient, – phase change, – normalized amplitude.
Table 1Parameters of the second-order multivariate regression model
Coefficients | Value | Coefficients | Value |
9.3153 | -9.2745 | ||
-6.8290 | 2.9318 | ||
-8.0771 | 8.1628 | ||
-4.8965 | 4.5682 | ||
9.1995 | 4.4369 |
In above discussion, a fatigue crack size quantification model based on Lamb wave method is introduced to evaluate the crack size. It provides a useful NDE tool for riveted lap joints components. Next, the reliability of the Lamb wave-based crack detection model is evaluated by the formal of POD.
3. Probability of detection modeling
The general POD method falls into two categories: hit/miss data and signal response data [6, 12]. For hit/miss data, NDE only recorded in terms of whether the flaw is detected or not. But for more informative NDE, the signal data can predict the crack size. Thus the NDE data are referred to as signal predication, denoted as . The POD for signal response data can be derived from the correlation of signal predication of crack size () vs. actual crack size ().
It has been reported [13] that and are usually linearly correlated, and can be expressed as:
where , are fitting parameters and is a normal random variable with zero mean and standard deviation .
In order to verify the linear correlation between and , the log-scale plot using the total 31 points demonstrated in Fig. 1(a), are shown in Fig. 1(b). A liner regression is used to estimate the coefficient and intercept in Eq. 2. is 0.0611, is 0.9326, and . The mean and 95 % bound prediction results are shown in Fig. 1(b) in solid and dash lines, respectively.
A pre-defined is used to represent the detection threshold. The can be assumed according to the measurement noise and physical limits of the measuring devices. It influences both the minimum size detected and the probability of false positive detection [7].
Fig. 1The results of crack size
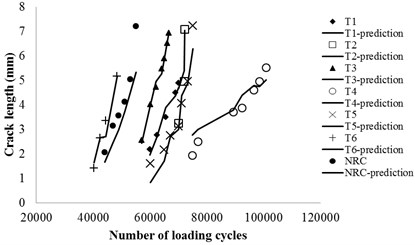
a) Fatigue testing data and life prediction curve
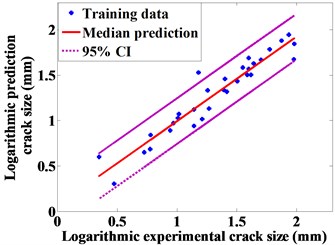
b) Sizing information of actual crack size and prediction crack size in log-scale
If exceeds the threshold value of , a flaw is regarded as identified. The probability of detection of size can be detected as follows:
where represents the probability of event , represents standard normal cumulative distribution function. Based on the POD model, the probability density function of crack size can be obtained. The reliability of the fatigue crack detection method can be classified into two groups. First, no crack has been detected by device. It does not necessarily mean the target system is free of crack when no crack detected in the NDE results. The inherent uncertainty and the may affect the NDE results. Second, a flaw has been detected. The POD represents the probability of detecting a size crack when the true crack size is . Event defines that a flaw has been detected and event defines that no crack has been detected. For convenience, random variables are denoted using capital letters (e.g., ) and corresponding values are denoted using lower case letters (e.g., ).
3.1. Indication is found in NDE data
The detected crack size is denoted as . The distribution of the actual crack size can be expressed as the following equation [14]:
where represents the random variable of the actual crack size, and is the standard normal probability density function (PDF).
3.2. No indication is found in NDE data
When there is no crack indication is found in NDE results, the PDF of the actual crack size can be expressed as Eq. (6) [14]:
4. Probabilistic fatigue life assessments for lap joint
4.1. Uncertainties of fatigue growth model parameters
There are many sources of uncertainties for fatigue life predication. One of the critical factors is initial crack size. The initial crack size estimation based on NDE data has been discussed above. The uncertainties from material properties and geometries are also need to be included. In general, the material uncertainties affect the fatigue life prediction through fatigue model parameters. The classic Paris’ equation (shown in Eq. (7)) is employed here for fatigue life predication. The fatigue testing data (shown in Fig. 1(a)) for the lap joint specimens are used to preform Bayesian parameter estimation with Markov Chain Monte Carlo (MCMC) method:
where is the crack size, is the number of cyclic loads, is the stress intensity factor range during one loading cycle, is the applied stress amplitude, is the geometric correction factor, and and are model parameters.
The joint distribution of is estimated using 200,000 MCMC samples, considering the two parameters follow a multivariate normal distribution (MVN). The mean vector is and the covariance matrix is .
4.2. Probability fatigue life prediction
The critical stress intensity factor of the lap joint material is , and the critical crack size is obtained as . Using the direct integration of Eq. (7), the probability fatigue life can be expressed as:
where is the initial crack size, is the applied stress amplitude, is the geometric correction factor and equal to 1 for model I case.
4.2.1. The probability of fatigue life with no flaw identified
Based on the fatigue testing data, the minimum detected crack size is obtained as 1.42 mm. Thus 1.42 mm is considered as detection threshold (i.e., 1.42 mm). Using numerical quadrature to evaluate the normalizing constant (denominator) of Eq. (6), the actual flaw size distribution is given by:
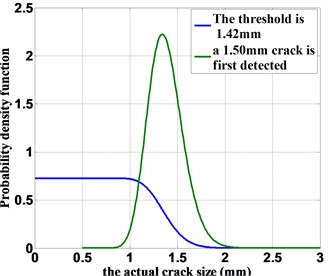
The PDF of the actual crack size with no indication is shown in Fig. 2. The blue line represents the actual crack size distribution, given that no crack is identified from the NDE data and the detection threshold is 1.42 mm.
Using 100,000 times of MC simulations, the probability of fatigue life with no indication (detection threshold is 1.42 mm) is shown in Fig. 3(a).
Fig. 2The probability density functions of the actual crack size.
4.2.2. The probability of fatigue life with a flaw identified
Given the fact that a crack with a size of 1.50 mm is reported, the PDF of the actual crack size (using Eq. (5)) is:
The PDF of the actual crack size with the flaw indication is shown in Fig. 2. With 100,000 MC simulations, the probability of fatigue life with an identified flaw (crack size is 1.50 mm) is shown in Fig. 3(b).
Fig. 3Probability of fatigue life for the lap joints
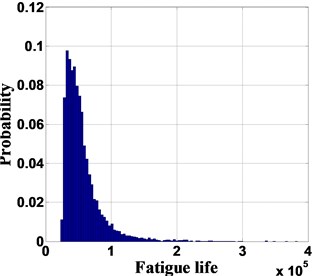
a) The probability of fatigue life with no flaw identified: threshold detection is 1.42 mm
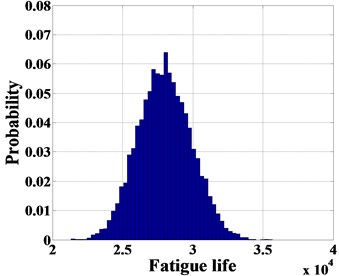
b) the probability of fatigue life with a flaw identified (1.50 mm)
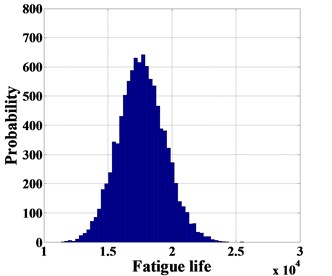
Fig. 4The probability of fatigue life with flaw identified (1.61 mm)
4.3. Validation with experimental data
In order to verify the reliability of the proposed probabilistic fatigue life prediction procedure, T5 specimen is used for validation. The minimal detected crack is reported with a size of 1.61 mm at 14845 cycles. The specimen failed at a crack size of 7.24 mm. Using 1.61 mm as the reported crack size and 7.24 mm as the critical crack size, the probabilistic fatigue life results are obtained using 100,000 MCMC simulations, as shown in Fig. 4. The experiment result (14845 cycles) is within the 95 % confidence interval (12444, 22770), and using the lower bound of 12444 can provide a small safety margin for decision-making.
5. Conclusions
In this study, a new methodology for the probabilistic fatigue life prediction of riveted lap joints is proposed. A multi-feature integration crack detection model is used to correlate the Lamb wave signal to the actual crack size. A log-linear POD modeling for Lamb wave-based NDE is investigated based on the multi-feature crack detection model. The PDFs of the actual initial crack size is obtained using the log-linear POD model. MCMC method is used to perform the parameter estimation for the initial crack size and crack growth model parameters. The probabilistic fatigue life for riveted lap joint is obtained using Monte Carlo simulations. Additionally, one set of experimental data is used to validate the reliability and accuracy of the proposed probabilistic fatigue life prediction.
References
-
V. Giurgiutiu Tuned lamb wave excitation and detection with piezoelectric wafer active sensors for structural health monitoring. Journal of Intelligent Material Systems and Structures, Vol. 16, 2005, p. 291-305.
-
P. B. Nagy Fatigue damage assessment by nonlinear ultrasonic materials characterization. Ultrasonics, Vol. 36, 1998, p. 375-381.
-
M. Link, M. Weiland Damage identification by multi-model updating in the modal and in the time domain. Mechanical Systems and Signal Processing, Vol. 23, 2009, p. 1734-1746.
-
Y. Feng, L. Zhou Combination of time reversal process and ultrasonic tomography approaches for baseline-free damage diagnosis. Journal of Vibroengineering, Vol. 13, 2011, p. 253-268.
-
L. Zhou, Z. He, H. Sun Lamb wave mode conversion-based crack detection for plate-like structures without baseline information. Journal of Vibroengineering, Vol. 15, 2013, p. 647-657.
-
K. Simola, U. Pulkkinen Models for non-destructive inspection data. Reliability Engineering & System Safety, Vol. 60, 1998, p. 1-12.
-
X. Guan, J. Zhang, K. Kadau, S. Zhou Probabilistic fatigue life prediction using ultrasonic inspection data considering equivalent initial flaw size uncertainty. Review of Progress in Quantative Nondestructive Evaluation, Vol. 32, 2013, p. 620-627.
-
R. S. Piascik, S. A. Willard The characteristics of multi-site fatigue damage in the fuselage riveted lap splice joint. Icaf 97: Fatigue in New and Ageing Aircraft, Vols I and Ii, 1997, p. 93-114.
-
D. W. Schindel, D. S. Forsyth, D. A. Hutchins, A. Fahr Air-coupled ultrasonic NDE of bonded aluminum lap joints. Ultrasonics, Vol. 35, 1997, p. 1-6.
-
N. Quaegebeur, P. Micheau, P. Masson, M. Castaings Methodology for optimal configuration in structural health monitoring of composite bonded joints. Smart Materials and Structures, Vol. 21, 2012.
-
H. Jingjing, G. Xuefei, P. Tishun, L. Yongming, S. Abhinav, C. Jose, et al. A multi-feature integration method for fatigue crack detection and crack length estimation in riveted lap joints using Lamb waves. Smart Materials and Structures, Vol. 22, 2013, p. 105007.
-
M. Lowe, R. Challis, C. Chan The transmission of Lamb waves across adhesively bonded lap joints. The Journal of the Acoustical Society of America, Vol. 107, 2000, p. 1333-1345.
-
A. P. Berens NDE reliability data analysis. ASM Handbook, Vol. 17, 1989, p. 689-701.
-
X. F. Guan, J. D. Zhang, S. H. Zhou, E. M. Rasselkorde, W. Abbasi Probabilistic modeling and sizing of embedded flaws in ultrasonic non-destructive inspections for fatigue damage prognostics and structural integrity assessment. Ndt & E International, Vol. 61, 2014, p. 1-9.
About this article

