Abstract
The constructed 3D model of the lower part of human body for the simulation of high jump enables to investigate not only parameters of the jump but to analyses the forces acting in muscles and joints as well. The model enables determining the most important muscles for the jump performance and sequentially to make recommendations for the sportsmen seeking the jump height. The developed methodology can be applied for the analysis of other type movements in sports.
1. Introduction
Structural basis of a human like of other vertebral living beings is his support locomotion system which consists of bones connected by mobile or immobile joints and soft tissues. This system is somewhat analogous to the supporting structures of common mechanical systems with the main difference that it changes in time. When a human organism grows, matures, and ages both geometrical dimensions and properties of structural components of the mentioned system change – mechanical properties and dimensions of bones and soft tissues; mobility and elasticity of the joints, etc. Body constitution of a certain human, his physical abilities depend greatly on the parameters of support locomotion system. As the main parameters characterizing the mentioned system can be easily measured, such measurements are named as anthropometric measurements the accumulation and systemizing the data of which was started in middle ages. Usually the main attention is paid to the measurements of general anthropometric parameters of the whole organism and for the determination of geometrical parameters of separate parts of the body (most frequently – skull, limb bones and other). Anthropometric data of a human are obtained using standardized methodologies of measurements, mainly limiting by height, weight measurements and calculation of the body mass index.
Recently for the analysis of human movements mainly a complex of means is used – very often together with computerized 3D view analysis systems by which the trajectories, velocities and accelerations of control points on the human body are determined by recording the human motion, i.e. by optical methods which compete more end more significantly with mechanical and electrical methods as they allow analyzing movements without direct contact with the body. Special labels perfectly reflecting the beams of infrared and visible spectrum are attached to characteristic points on the body and the human in motion is recorded. Information on the motion of characteristic points is synchronically sent from all recording cameras to computer.
Such methods are applied for human gait analysis and the analysis of movements’ characteristic for different branches of sports. Human movements can be recorded and analyzed even by a single camera just recording the analyzed object and later reconstructing in a slowed down manner the recorded view. But usually 3D motion analysis systems [1] (e.g. Vicon, Qualisys, Simi, Ariel and other) consist of 1 – 8 stationary and mobile high velocity digital cameras, the device for information transfer from cameras to computer and special software (e.g., Visual 3D, Simi and other) for the acquisition measurement information on motion parameters. For more comprehensive analysis to the mentioned systems the synchronically operating force platforms, electromyography and other analog hardware can be connected. For comprehensive research special systems of 8, 10, 100 Hz and even higher frequency cameras are applied, nevertheless elementary research can be conducted by 2-4 semi professional digital cameras. The motion of up to several tens of labels (from 3 to 45 mm in diameter) is recorded. By selecting labels of the necessary size and distance of the measurement both the relatively high motion amplitudes (e.g. in jump) and relatively low motion amplitudes (e.g. of the finger motion, jawbone motion and similar) can be measured. For jump analysis the motion trajectories of control points, the duration of phases of jump cycle and take off force can be directly measured [2-5].
2. The main stages of movement analysis methodology
The human movement analysis is being accomplished in two stages: in the first stage the experimental research is performed and the side model condition obtained, on the next stage computer-based human model is being created and calculations done. The main stages of this methodology:
1) By recording high jump of a human applying the system for measurement and analysis of 3D movements the trajectories of control points, the laws of joint angles change, the laws of movements of body segments, velocities and accelerations are determined (they are in the database).
2) Applying the software of biomechanical analysis according anthropometric data of the human (height, weight, body proportions) under analysis computer biomechanical model which corresponds to support locomotion apparatus including absolutely rigid bones joint by elements of certain stiffness and damping and movement limiting elements is constructed with muscles actuating the model.
3) On the basis of biomechanical model solving the problem of inverse dynamics (body movement benchmark trajectory or joint angle variations are indicated) the muscles activity regularity enabling experimentally measured model movement is determined.
3. Results
Applying Biomechanical analysis software according to explotory person anthropometric data (Table 1) computer-based biomechanical model coincident with testee lower body part supporting and movement apparatus- bones, joints, muscles which are used for movement completion was designed (Fig. 1). During the jump analysis such model encomasses: pelvic bone, femur bones, shinbones, splint-bones and feet bones, connective hip, knee and ankle muscles and main lower limbs muscles: muscles that move the thigh, muscles that move the leg, and muscles that move the foot and toes.
Fig. 1Lower body part computer – based biomechanical model for jump analysis (bones, joints and muscles)
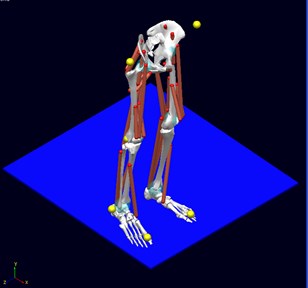
Table 1LifeMOD in terms of computer
Parameters | Remarks |
$-UNITS [UNITS] LENGTH = millimeter FORCE = newton ANGLE = degrees MASS = kg TIME = second | Measurements |
Height, mm | |
Force, N | |
Angles, degrees | |
Mass, kg | |
Time, s | |
$--------------ANTHROPOMETRIC_DATA [ANTHROPOMETRIC_DATA] SUBJECT_NAME = gal3a GENDER = 1.0 TOTAL_BODY_HEIGHT = 1900 TOTAL_BODY_MASS = 90.00 AGE = 276 HANDS = 1 NOHAT = 1 | Antrhropometric data |
Subject name (code) | |
gender (1 – mascul., 2 – fem.) | |
Height, mm | |
Mass, kg | |
Age, months | |
$-MARKER_SET [MARKER_SET] TYPE = Davis T4 = OFF RSHO = OFF RASIS = ON RFEMW = OFF RFEMC = ON RLATM = ON LWRI = OFF LASIS = ON LFEMW = OFF LFEMC = ON LHEEL = OFF L2MET = ON SHFT = OFF | Marking |
OFF – inactive markers | |
ON – active markers | |
$-MOTION_DATA [MOTION_DATA] | Movement data |
Those segments which are not used in modeling the jump are deactivated, the degree of joint, which not highly influence the motion, flexibility is fixed (e.g. knee joint can be bent only in sagittal plane), the rest are modeled as passive, they are given certain angular rigidity and suppression (Table 2).
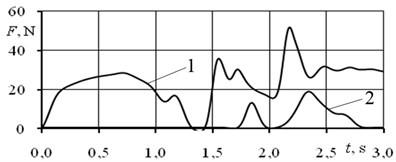
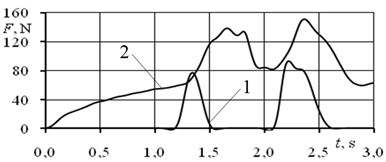
Fig. 2Dynamics analysis: a) – LifeMOD (yellow movement forming markers), b) – MC reaction power; 1 high jump, 2 fast jump
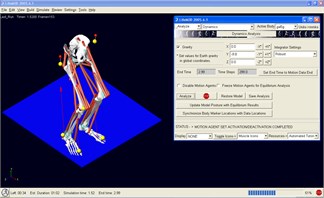
a)
b)
Solving the problem of dynamics concerning motion of the model corresponding a human being the trajectories of benchmarks in the model were indicated and the performance laws of the mentioned above muscles were derived in order to ensure the determined by measurements motion.
Fig. 2 displays LifeMOD the dynamic analysis and MC reaction power during high and fast jumps.
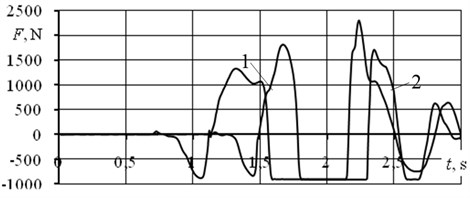
Fig. 3 and Fig. 4 depict the variation of main leg mucles force during tested jumps (left and right leg).
Table 2Activated joint parameters
Joint | Axes* | Angular rigidity, N∙mm/degrees | Angular suppresion, N∙mm∙s/degrees | Freedom interval, degrees | Angular rigidity on the verge of movement freedom, N∙mm/degrees |
Hip joint | 100 | 1000 | 50-120 | 106 | |
Hip joint | 100 | 1000 | 30-30 | 106 | |
Hip joint | 100 | 1000 | 60-60 | 106 | |
Knee joint | 100 | 1000 | 160-10 | 106 | |
Knee joint | Fixed freedom degree | ||||
Knee joint | Fixed freedom degree | ||||
Ankle joint | 100 | 1000 | 50-120 | 106 | |
Ankle joint | Fixed freedom degree | ||||
Ankle joint | Fixed freedom degree | ||||
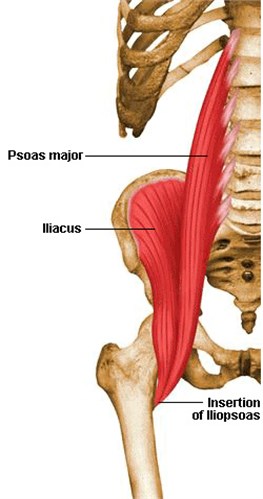
Fig. 3Hip Iliacus muscle: a) variation during the jump, b) – left leg, c) – right leg; 1 high jump, 2 fast jump
a)
b)
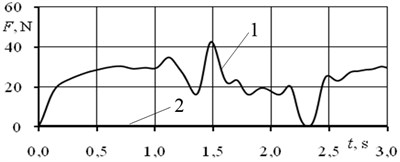
c)
Fig. 4Sacral gluteus maximus: a) variation during the jump, b) – left leg, c) – right leg; 1 high jump, 2 fast jump
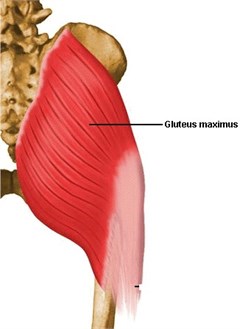
a)
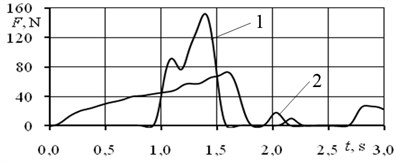
a
c)
4. Conclusions
It is determined that the activity of hip muscle and central double shin muscle is up to 50 % higher at fast jumps and the activity of side double shin muscle is up to 40 % higher at high jumps. Applying 3D mathematical model of human support-locomotion system the influence of the following muscles on jump height was determined. It can be stated that the forces developed during jump by the muscles of different legs differ up to 10 %. From computer analysis of the jumps of different types different muscle activities were determined for high jump and fast jump.
References
-
Aragon L. F. Evaluation of four vertical jump tests: methodology, reliability, validity, and accuracy. Measurement in Physical Education and Exercise Science, Vol. 4, Issue 4, 2000, p. 215-228.
-
Blanksby B., Nicholson L., Elliott B. Biomechanical analysis of the grab, track and handle swimming starts: an intervention study. Sport Biomechanics, Vol. 1, Issue 1, 2001, p. 11-24.
-
Derrick T. R., Caldwell G. E., Hamill J. Modeling the stiffness characteristcs of the human body while running with various stride lengths. Journal of Applied Biomechanics, Vol. 16, 2000, p. 36-51.
-
Haguenauer M., Legreneur P., Monteil K. M. Vertical jumping reorganization with aging: a kinematic comparison between young and elderly men. Journal of Applied Biomechanics, Vol. 21, 2005, p. 236-246.
-
McLean S. P., Holthe M. J., Vint P. F., Beckett K. D., Hinrichs R. N. Addition of an approach to swimming relay start. Journal of Applied Biomechanics, Vol. 16, 2000, p. 342-355.
About this article

