Abstract
The reverberation chamber which was used to test sound absorption and insulation performance in the reverberation space had the following problems. Firstly, the construction cost of the reverberation chamber was high. Secondly, the test can’t be completed when the size of the specimen was too small. As a result, a small reverberation box with a relatively small size had significant meaning. The previous researchers designed the small reverberation box by using the traditional experience and theory formulas which had a long period and high cost. In order to solve this problem, simulation analysis on sound insulation performance of a compound structure through Statistical Energy Analysis (SEA) was proposed. And then the sound field distribution of the small reverberation box was simulated by Boundary Element Method (BEM). According to the simulation results, the model was optimized repeatedly. And finally a small reverberation box model with sufficient sound insulation performance and uniform sound field was obtained. The actual structure was made based on simulation model, and its sound characteristic was tested. The results showed that the small reverberation box had an excellent performance. BEM-SEA method was feasible to be used to design a small reverberation box.
1. Introduction
At present, it was very difficult to reduce noise from source due to the limited conditions. As a result, the researchers started to pay their attention on sound absorption and sound insulation performance in a reverberation space [1-4]. The reverberation chamber which was used to test sound absorption and insulation performance in the reverberation space had the following problems. Firstly, the construction cost of the reverberation chamber was high. Secondly, the test can't be completed when the size of the specimen was too small. As a result, someone proposed to design a small reverberation box. Maryland University designed a small reverberation box based on the traditional theories and experience [5]. However, there were certain defects existing in the practical application for the traditional theories. In addition, it had a long design period and high cost. In order to solve this problem, simulation analysis on sound insulation performance of a compound structure through Statistical Energy Analysis (SEA) was proposed. And then the sound field distribution of the small reverberation box was simulated by Boundary Element Method (BEM). According to the simulation results, the model was optimized repeatedly. And finally a small reverberation box model with sufficient sound insulation performance and uniform sound field was obtained. The actual structure was made based on simulation model, and its sound characteristic was tested. The results showed that the small reverberation box had a excellent performance. BEM-SEA method was feasible to be used to design a small reverberation box.
2. Size of the small reverberation box
In order to design a small reverberation box with sufficient sound insulation performance and uniform sound field, the following points must be achieved. 1) Excellent diffusion effect. 2) Long reverberation time. 3) Sound field with uniform distribution.
The improper selection of the small reverberation box shape would lead to degeneration phenomenon, which could influence the sound field distribution and degree of diffusion [6]. As a result, a reasonable shape must be selected. In order to avoid occurring degeneration phenomenon, the ratio of length, width and height for the small reverberation box should be chosen as follows:
The ratio recommended by ISO was [6], and it was 1:1.26:1.59 after being converted into decimals. The ratio 0.9:1.2:1.4 was selected in this paper, after normalization, it was 1:1.33:1.55, which approached the ratio recommended by the ISO. The ratio was not designed completely according to the recommended value because the recommended value was a critical value at which would occur degeneration phenomenon. In actual design, the ratio always approached this value, but it could not be designed completely according to the value. Otherwise, the serious degeneration phenomenon would appear and influence design accuracy.
The size of the small reverberation box decided its volume while the volume had the following relation with its lower limit frequency [7]:
In the equation, referred to the lower limit frequency. was volume.
In addition, the maximum size had the followed relation with volume [7]:
The small reverberation box was confirmed as hexahedron with the size of 1.4 m×1.2 m×0.9 m by combining with Eqs. (1), (2), and (3).
The irregular shape of the small reverberation box would better realize the reverberation effect [8]. Because the unparallel surfaces would allow the incidence of sound wave from different directions, make it more random and obtain a better reverberation effect.
3. Structure of the small reverberation box
In order to guarantee excellent sound insulation effect, the following composite structure form was adopted. The interior layer and exterior layer of the small reverberation box body were all made of steel plates. The fibrous glass wool was filled as sound absorption materials between the interior layer and exterior layer. There was certain air layer left between the fibrous glass wool and the exterior steel plate. This kind of multi-layer structure could effectively improve transmission loss [9], as shown in Fig. 1. The optimal ratio was not given by ISO for this structure type. In the paper, SEA method was used to calculate sound insulation performance of this structure repeatedly. Finally, a structure with the relatively optimal sound insulation effect was obtained, and the detailed analysis process was as follows.
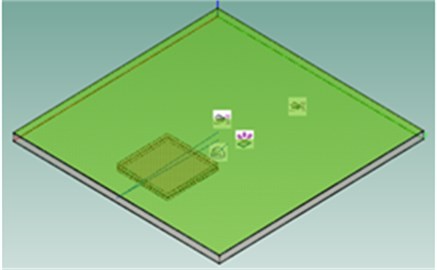
Analysis on transmission loss of the small reverberation box was made by SEA to guarantee that it had a high transmission loss. SEA model of the small reverberation box body was shown in Fig. 2, and the structure was showed in Fig. 1. The density of steel plate was 7800 kg/m3. Young modulus was 210 GPa. Poisson ratio was 0.3125. And loss factor was 0.01. The air density was 1.21 kg/m3. The sound velocity was 343 m/s. The density of the fibrous glass wool was 30 kg/m3 and its flow resistance was 25000 N·s/m4. The porosity rate of the fibrous glass wool was 0.95, its loss factor was 0.05 and Young module was 14000 Pa. Diffusion sound field was loaded in the inside of the model, and the interior and exterior steel plates were clamped boundary conditions. Surface connection existed among different layers of the structure.
The boundary conditions were changed gradually based on SEA model, and its influence on transmission loss was researched. Finally, the sizes of each layer for the structure were decided, and the detailed process was as follows.
Fig. 1Structure of the small reverberation box body
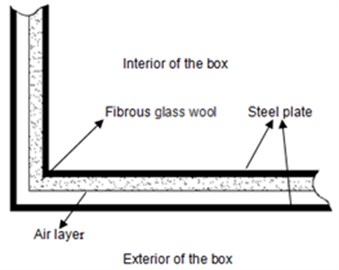
Fig. 2SEA model of the small reverberation box body
3.1. Thickness of the incidence side steel plate
Thickness of the incidence side steel plate was changed from 1 mm to 5 mm, and the step size was 1 mm. Then, transmission loss of the structure under different conditions was obtained, which was shown in Fig. 3.
Transmission loss would increase with thickness of steel plate within 50-1600 Hz. And it displayed a strong irregularity above 1600 Hz.
Fig. 3The influence on transmission loss by thickness of the incidence side steel plate
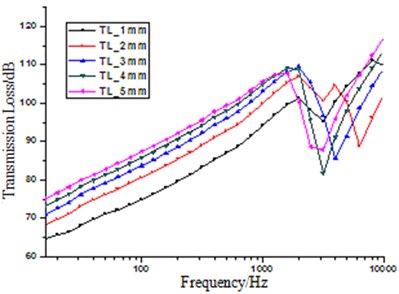
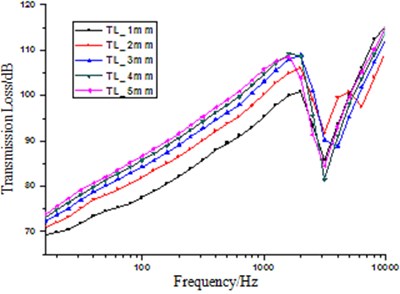
Fig. 4The influence on transmission loss by thickness of the transmission side steel plate
3.2. Thickness of the transmission side steel plate
Thickness of the transmission side steel plate was changed from 1 mm to 5 mm, and the step size was 1 mm. Then, transmission loss of the structure under different conditions was obtained, which was shown in Fig. 4.
The change tendency was similar to that of the incidence side steel plate. But the transmission side steel plate had a more large influence on transmission loss with the same thickness. As a result, the thickness of the transmission side steel plate should be larger than that of the incidence side steel plate.
3.3. Thickness of sound absorption materials
Thickness of sound absorption materials was changed from 3 cm to 7 cm, and the step size was 1 cm. Then, transmission loss of the structure under different conditions was obtained, which was shown in Fig. 5.
It could be seen from Fig. 5 that transmission loss would increase with the thickness increase of sound absorption materials within 50-1600 Hz, and it had no influence in other frequency bands.
Fig. 5The influence on transmission loss by thickness of sound absorption materials
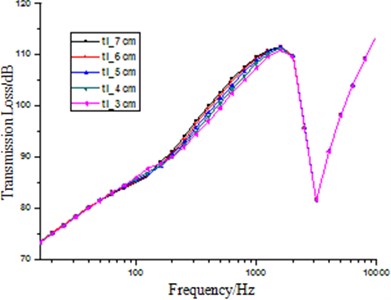
Fig. 6The influence on transmission loss by thickness of air layer
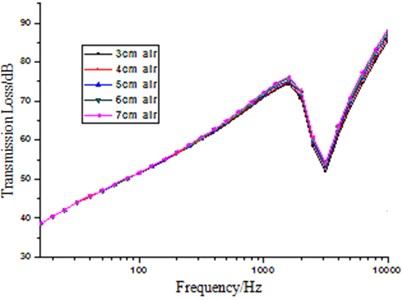
3.4. Thickness of air layer
Thickness of air layer was changed from 3 cm to 7 cm, and the step size was 1 cm. Then, transmission loss of the structure under different conditions was obtained, which was shown in Fig. 6.
In low frequency range, thickness change of air layer had little influence on transmission loss. However, when the frequency increased, the transmission loss would increase with thickness of air layer. But it was only a small increase degree which was nearly 1 dB.
According to the mentioned analysis, finally, the thickness of each layer for the compound structure was decided as follows. Thickness of the incident side steel plate was 3 mm. Thickness of the fibrous glass wool was 7 cm. Thickness of air layer was 3 cm. Thickness of the transmission side steel plate was 4 mm.
The small reverberation box with composite structure was designed based on the mentioned size. Transmission loss with each frequency was solved by SEA method as shown in Fig. 7.
Fig. 7Transmission loss of the small reverberation box body
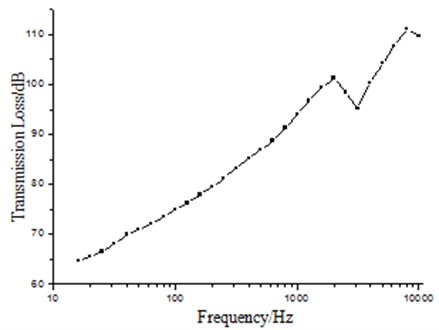
Seen from Fig. 7, it could be concluded that transmission loss was basically in linear relation with frequency within 50-1600 Hz, and the structure had a good sound insulation performance. There would be an obviously low point in Fig. 7 when the frequency was more than 1600 Hz, which was resulted from coincidence effect. As a result, the test should avoid coincidence effect.
4. Design of diffusers
Due to that each surface of the reverberation box was plane and the reflected angle of sound wave was single, it was difficult to guarantee excellent diffusion effects for each frequency band. As a result, the diffusion effects inside the small reverberation box should be improved.
Installing diffusers was a widely applied method to improve the diffusion effects. Considering that the small reverberation box had a small size, diffusers with different sizes were installed on the inside wall of the small reverberation box. As a result, they could guarantee that the sound wave under different frequencies could be well reflected from different directions. Finally, the sound energy density was equal in everywhere inside the small reverberation box, and the diffusion sound field was uniform.
Fig. 8Sound pressure distribution of three models
a) Rectangle reverberation box with semi-cylinder diffusers
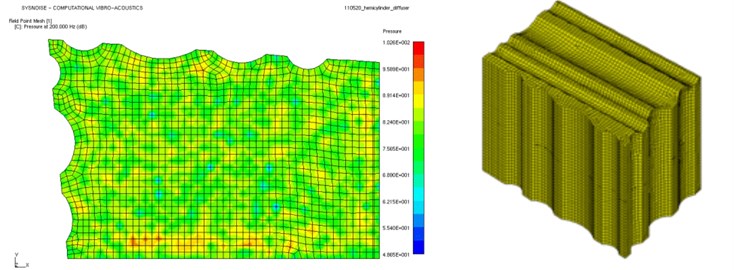
b) Dip angle formed by opposite sides of the small reverberation box with semi-cylinder diffusers
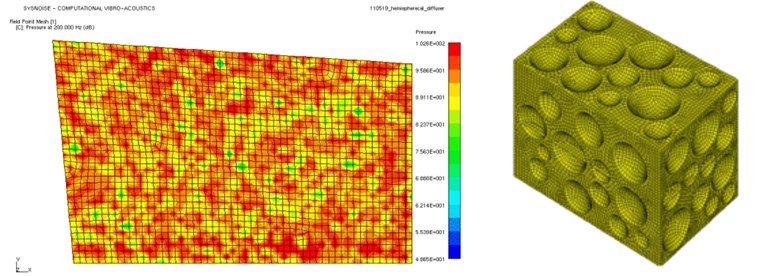
c) Dip angle formed by opposite sides of the small reverberation box with semi-spherical diffusers
4.1. Selection of diffusers
There were three kind of models for the small reverberation box in general, which were the rectangle reverberation box with half-cylinder diffusers, dip angle formed by opposite sides of the small reverberation box with half-cylinder diffusers, and dip angle formed by opposite sides of the small reverberation box with semicircle diffusers, respectively.
The sound pressure distribution and curve of three models were obtained by BEM method as shown in Fig. 8 and Fig. 9, respectively.
Fig. 9Sound pressure curve of three models
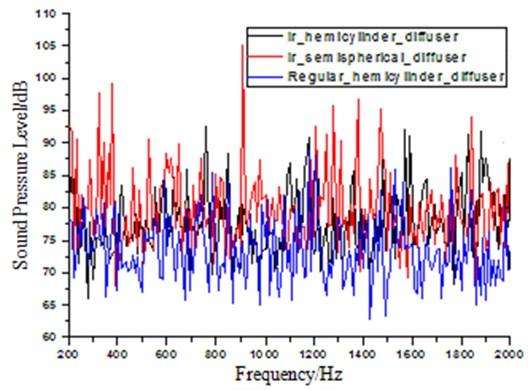
It could be seen from Fig. 8 and Fig. 9 that the small reverberation box with dip angle formed by opposite sides (semi-spherical diffusers) had better diffusion effects than that of the other models.
4.2. Dimensions and arrangements of diffusers
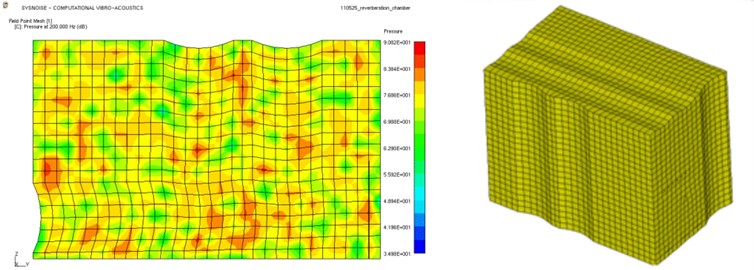
There were 5461 quadrilateral elements and 4817 nodes in BEM model, as shown in Fig. 10(a). Two unit point sound sources were applied to opposite angles of the model to set as the boundary condition. And the box body was deemed to be rigid surfaces. Due to its big thickness, the box body would not generate coupling effect with sound field in the box. Therefore, coupling effect was not taken into account during calculation. In addition, in order to observe sound field in the box, field point meshes which were close to the side surface and the middle surface were set up, as shown in Fig. 10(b). There were totally 2135 quadrilateral elements and 1685 nodes.
Due to that diffusers had relatively complicated quantities, dimensions and arrangements, optimization design could not be conducted to them through an optimization algorithm yet. In the paper, these parameters of diffusers were changed repeatedly to calculate sound field uniformity in the small reverberation box. If the sound field was uniform at one moment, quantities, dimensions and arrangements of diffusers were deemed to satisfy design requirements at this time. Such design might be not the optimal one, but it satisfied requirements of the actual engineering and was feasible.
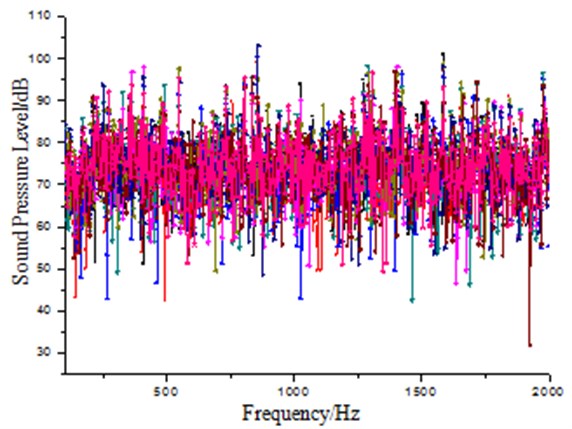
At one moment when BEM calculation was completed, sound pressure levels at 9 different nodes in Fig. 10(b) were extracted for comparison, as shown in Fig. 11. It was shown in the figure that the sound pressure levels had mutually small differences, and the sound field in the small reverberation box could be deemed to be uniform. Quantities, dimensions and arrangements of diffusers at this moment satisfied requirements, as shown in Fig. 12.
Fig. 10BEM model of the small reverberation box
a) BEM mesh model
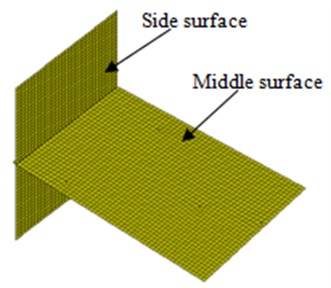
b) Field point mesh model
Fig. 11Sound pressure level of nine different locations in the small reverberation box
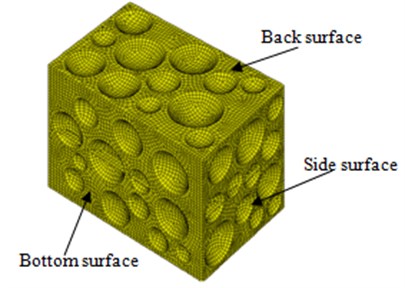
Four differently sized spherical diffusers made of reinforced concrete were used in the small reverberation box, of which the radius of curvature were 175 mm, 132 mm, 105 mm and 74 mm, respectively. The diffusers were fixed on two neighboring surface and the side face in an irregular arrangement, so that no pair of smooth face would face each other in the small reverberation box.
5. Experimental verification
The small reverberation box designed based on simulation analysis need to be verified by experiment about whether the sound field was uniform, whether the reverberation time was sufficient, whether the sound insulation effect was good. Experiment was finished in a half anechoic chamber without any other noise source, and background noise was 35.1 dB.
5.1. Reverberation time
In order to test the reverberation time, the frequency points 125 Hz, 250 Hz, 500 Hz, 1000 Hz, 2000 Hz, 4000 Hz and 8000 Hz were tested. And the test results are shown in Table 1.
It could be seen from Table 1 that the small reverberation box had a long reverberation time under different frequencies, and achieved the requirements.
Fig. 12Quantities, dimensions and arrangements of diffusers
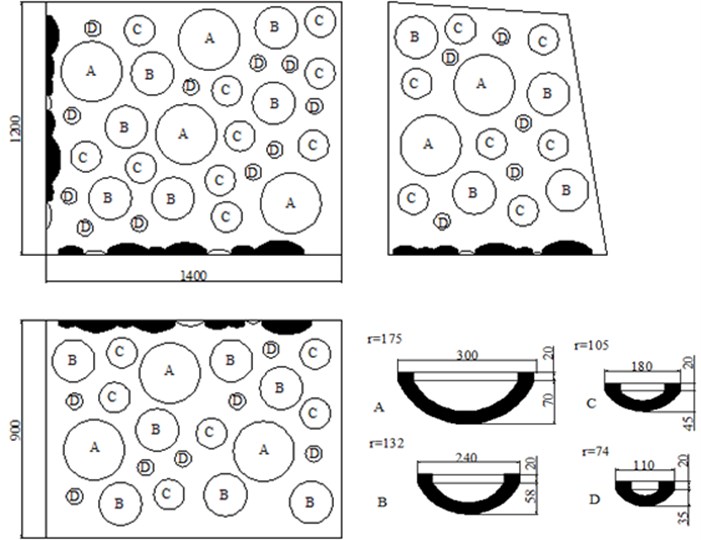
Table 1Reverberation time of each frequency
/ kHz | 0.125 | 0.25 | 0.5 | 1 | 2 | 4 | 8 |
/ s | 33.3 | 33.5 | 30.3 | 33.9 | 32.9 | 34.0 | 35.5 |
5.2. Transmission loss of the small reverberation box
In order to avoid the test error of transmission loss, it was tested many times through rationally changing the location of sensors. Transmission loss of two kinds of cases was shown in Fig. 13.
Fig. 13Transmission loss of two kinds of cases
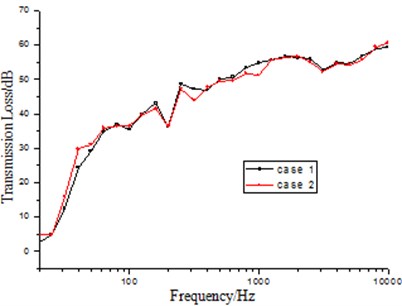
Fig. 14SPL of each sensor in the small reverberation box
It could be concluded from Fig. 13 that transmission loss of two kinds of cases was basically consistent. In addition, transmission loss of the small reverberation box were more than 50 dB when the frequency was more than 400 Hz, and it could obtain a good sound insulation effect.
The results in Fig. 13 were slightly different from that of SEA as shown in Fig. 7. The main reason was that SEA model was ideal. However, in the process of manufacturing the small reverberation box, the manufacturing technology was very difficult to achieve the ideal state. In addition, the factors like sound leakage through holes which were used to arrange wires would reduce transmission loss.
5.3. Uniformity of sound field in the small reverberation box
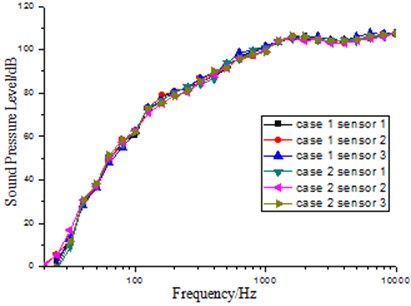
In order to verify whether the sound field distribution in the small reverberation box was uniform, the test results of SPL in the small reverberation box were compared by three sensors with different locations. Meanwhile, in order to guarantee the reliability of the test results, the location of sensors were changed many times and the test results of two conditions were shown in Fig. 14.
Fig. 14 showed the sound pressure distribution in the small reverberation box. It could be seen in the figure that the maximum difference value of SPL by three sensors was less than 3 dB under the same condition. However, the difference value between the maximum SPL and the minimum SPL was only 3.5 dB under the different condition. In addition, the difference value would be smaller under the different condition when the frequency was more than 1000 Hz. According to the analysis, the sound field distribution in the small reverberation box was uniform and the reverberation was also stable.
5.4. Engineering verification of the small reverberation box
Transmission loss experiment of magnesium alloy sheet was carried out by the small reverberation box in a half anechoic chamber. This experiment adopted reverberation-anechoic chamber method to test transmission loss. Magnesium alloy sheet was installed on the window of the small reverberation box, and the half anechoic chamber located at the transmission side. The size of magnesium alloy sheet was 464 mm×670 mm, and thickness was 4 mm. Elastic modulus was 4.5e10 Pa. Poisson’ ratio was 0.35. Density was 1750 kg/m3. Damping loss factor of magnesium alloy sheet was 9e-4. There were two white noise sources which were placed in the diagonal of the small reverberation box to generate reverberation sound field. The sound pressure signal , of the incident and transmission side were tested.
Transmission loss was defined as the difference value of sound pressure level between the incidence and transmission side for magnesium alloy sheet [10]:
The simulation results of transmission loss for magnesium alloy sheet was calculated by hybrid FE-SEA method, and material parameters were consistent with the experimental one. The model was shown in Fig. 15 with four parts which were subsystem, FE face, DAF (Diffuse Acoustic Field) and SIF (Semi-Infinite Field). The finite element model of magnesium alloy sheet was built by using quadrilateral meshes, and it included 816 elements and 689 nodes. FE face which covered on FE subsystem was connected by triangular meshes. Acoustic excitation and subsystem of receiving acoustic energy were also applied on FE face. FE face was actually a SEA subsystem. The small reverberation box was simulated by DAF and the half anechoic chamber was simulated by SIF in simulation analysis.
The calculation formula definition of transmission loss was obtained based on the relation between the incidence power and transmission power :
Transmission loss of simulation result was compared with that of the experimental one as shown in Fig. 16.
Fig. 15Hybrid FE-SEA model of magnesium alloy sheet
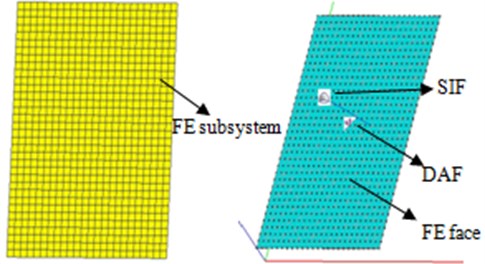
Fig. 16Comparison of transmission loss between simulation and experiment
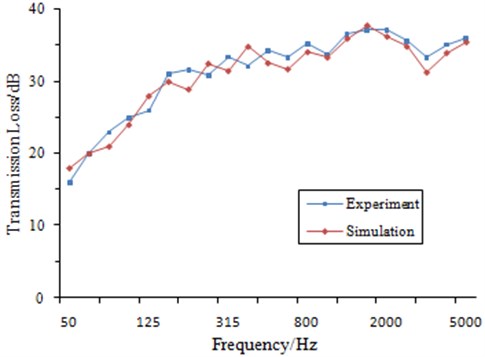
It could be seen from Fig. 16 that the overall peaks and troughs were similar between simulation and experiment, and the change trend was also same in the entire band. The maximum difference value between simulation and experiment was less than 3 dB when the frequency was more than 1000 Hz, and the error was in the range of the engineering requirements. Transmission loss was also close within 1000 Hz although it was limited by the experiment condition. According to the mentioned analysis, on one hand, the test by the small reverberation box was reliable. On the other hand, hybrid FE-SEA model could be used to predict transmission loss of magnesium alloy sheet.
6. Conclusions
The small reverberation box had the advantages of low cost and movable when it was compared with the reverberation chamber. The previous researchers designed the small reverberation box through the traditional experience and theory formulas which had long period and high cost. In order to solve the problem, SEA and BEM simulation technology were adopted to design the small reverberation box. The real structure was made and tested to verify the reliability of the small reverberation box, and the following conclusions were obtained.
1) Transmission loss of the small reverberation box body was more than 50 dB when the frequency was more than 400 Hz, which indicated that the structure was effective used to made the small reverberation box. It could also reduce the construction cost of the reverberation chamber.
2) The maximum difference value of sound pressure level in different locations was less than 3 dB, which showed that the sound field distribution of the small reverberation box was uniform and could be used to carry out the scientific experiments.
3) The test results of sound insulation performance, sound field distribution and reverberation time was very good. In addition, the designed reverberation box was also used to test transmission loss of magnesium alloy sheet, and the test results were compared with the simulation one, which had a very good consistency. The analysis showed that the structure was reliable.
The mentioned contents showed that design of the small reverberation box based on SEA and BEM method was feasible, and it could also provide a certain reference for design of the other similar structure.
References
-
Santos P., Tadeu A. A note on the acoustic insulation between two-dimensional acoustic spaces at low frequencies. Journal of Sound and Vibration, Vol. 261, 2003, p. 185-194.
-
Mathys J. Low frequency noise and acoustical standards. Applied Acoustics, Vol. 40, Issue 3, 1993, p. 185-199.
-
Berglund B. Sources and effects of low frequency noise. Journal of the Acoustical Society of America, Vol. 99, Issue 5, 1996, p. 2985-3002.
-
Santos P., Tadeu A. Acoustic insulation provided by a single wall separation two contiguous tunnels via BEM. Journal of Sound and Vibration, Vol. 257, Issue 5, 2002, p. 945-965.
-
Chung Y. T., Carl R. V., Jackson C. S. The design of small reverberation chambers for transmission loss measurement. Applied Acoustics, Vol. 9, Issue 3, 1976, p. 165-175.
-
Sun G. R., Hu C. N., Wu Q. X. Design Principle of Anechoic Chamber and the Reverberation Room. Science Press, Beijing, 1981, p. 61-62.
-
ISO 354. Acoustics-Measurement of Sound Absorption in a Reverberation Room. Geneva, 2003.
-
Xiang D. Q., Wang Z., Chen J. J. Acoustic design of a reverberation chamber. Applied Acoustics, Vol. 32, Issue 2, 1991, p. 83-91.
-
Panneton R., Atalla N. Numerical prediction of sound transmission through finite multilayer systems with poroelastic materials. Journal of Acoustical Society of America, Vol. 100, Issue 1, 1996, p. 346-354.
-
He L., Zhu H. C., Qiu X. J. Acoustic Theory and Engineering Applications. Science Press, Beijing, 2006, p. 168-169.
About this article

This research was supported by the National Natural Science Foundation of China (Project: 50975207, 51075304 and 51205292) and the Fundamental Research Funds for the Central Universities of China (Project: 20113145 and 20112548). The authors also would like to gratefully acknowledge the contribution and support of Shanghai Zhenhua Heavy Industries Co., Ltd.
