Abstract
This paper presents the results of research carried out on the basis of vibration analysis for propulsion systems of ships used on the same basin. Six propulsion systems, identical in terms of mechanics, placed on three seagoing vessels, have been analyzed. The considered files have been divided into catalogues, separately for each measurement point, each direction, each rotational speed, and separately for usable and unusable shaft lines. Thus, it was possible to obtain vibration time histories of particular shaft lines for every combination point/direction/rotational speed. The mean value and standard deviation have been calculated separately for usable and unusable shaft lines and for each combination and each calculated characteristic. Next, the characteristic of time histories was calculated in the time domain: integral, mean value, energy, mean power (rms squared), simple moment of I order, simple moment of II order, central moment of I order, central moment of II order, normalized simple moment of I order, normalized simple moment of II order, normalized central moment of I order, normalized central moment of II order, as well as the abscissa of the signal square gravity center, variance of the signal square, the signal equivalent diameter. It has been established that the characteristic for standard deviation lower than 15 % of the mean value is of concentrated type. On this basis the abscissa of the signal square gravity center, variance of the signal square and the value of normalized correlation function have been determined. A module and the sum of standard deviations have been calculated from the difference of mean values for usable and unusable objects for each combination and characteristic. Basing on this, it has been determined whether a given characteristic is reliable, that is, whether the module from the difference of mean values is higher than the sum of standard deviations.
1. Introduction
Noise and vibrations which occur in complex structures of ships are becoming more and more noticeable obstacle in ship construction [1, 2]. They are mainly produced by propeller systems of ships [3-5] which are the research objects of this study.
The tests were performed on base minesweepers of 207 P type – Fig. 1.
The objects of this type are used on the same basin and the research was performed in similar weather conditions with not more than 2° Beaufort at the sea as waves hitting the hull could cause significant changes in values of the recorded vibrations [6].
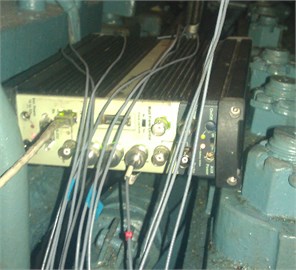
Three identical accelerometers (B&K 4514B) were used for measurements. They were mounted on three perpendicular axes. As there was no possibility to use a threaded joints the converters were fixed to the tested components of the propulsion system by means of glue – Fig. 2. Measurement tracks were calibrated before and after measurements. The whole procedure was carried out according to [8] and the branch norm. All the recorded signals were synchronized by means of a four-channel measurement card cage Fig. 3.
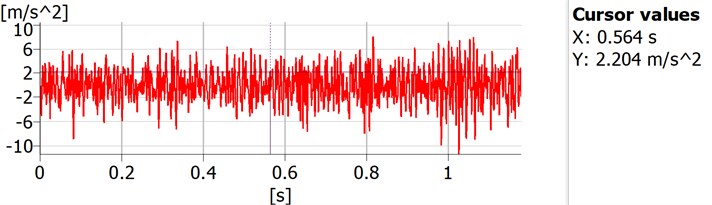
Vibration accelerations were recorded in the range of 3.2 kHz band and with sampling frequency 8192. The most common methods of vibration analysis used in navy are analysis obtained using CPB and FFT [9]. In many cases those methods are insufficient to determine the future technical condition of marine propulsion systems. In next chapters authors will focus on an untypical method of vibration parameters analysis [10-14].
Fig. 1Research object under tests [7]
![Research object under tests [7]](https://static-01.extrica.com/articles/16031/16031-img1.jpg)
Fig. 2Places on a resistance-carrier bearing where accelerometers were fixed with marking of measurement directions
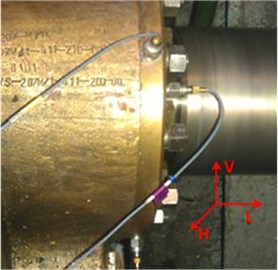
Fig. 3Apparatus used for measurements B&K 3560-B-120
2. Analysis of recorded data
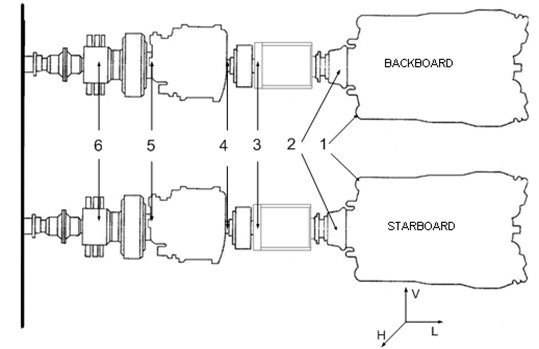
The frequency analysis of vibration signals can be effectively used for monitoring of the fault origination [15-21] and development in rotating machinery [22, 23]. The vibration accelerations were recorded for four vessels, two drive shaft lines of three vessels and one shaft line for one of them and six measurement points on each shaft line Fig. 4.
Fig. 4Fragment of vibration acceleration history recorded during measurements
Measurement points were localized on the most important components of shaft lines (Fig. 5), that is, two on the main engine (01, 02), one on a hydro-kinetic clutch (03), two on a reverse reduction transmission (04, 05) and one on a resistance – carrier bearing (06).
Fig. 5Scheme of the studied ships propulsion system: 1 – engine foundation; 2 – power end of engine; 3 – hydro-kinetic clutch; 4 – bearing on the reverse reduction transmission inlet; 5 – bearing on the reverse reduction transmission outlet; 6 – resistance carrier bearing
Additionally, the recording was performed for four rotational speeds and in three axes, separately. Six shaft lines were in the state of usability and one was unusable. Each of the received data is quantitative information on the quality of the tested circuit from the viewpoint of the concerned criterion [24].
In result of the recording and the initial analysis of the recorded signals 252 csv files for the line shafts being in usability state and 68 files for the line shafts being unusable were obtained for each combination – measurement point-vibration axis-rotational speed (PP-OD-PO). Each file contained the same number of measurement results equal to 1024.
It was found that each time history of recorded vibrations was a discrete signal expressed in the time domain. Thus, to analyze the signals recorded for each of them, described by , the following characteristics were calculated: integral the signal [], mean value of the signal <>, energy of signal , signal mean power (rms squared) , simple moment of I order , simple moment of II order , central moment of I order , central moment of II order , simple normalized moment of I order , normalized simple moment of II order , normalized central moment of I order and II order , abscissa of the signal square center of gravity , variance of the signal square and the signal equivalent mean value [25, 26].
Moreover, it was found that the characteristic was concentrated if the standard deviation of the characteristic value in PP-OD-PO group was lower than 15 % of the mean value Eq. (1):
where: – the characteristic of signal , – PP-OD-PO group of signals.
It was also accepted that if the analyzed characteristic of signals was to be considered as characteristic unequivocally defining a shaft line reliability state it needs to be a concentrated characteristic and the absolute value of the difference in the characteristic mean values for signals from the group of shaft lines being in usability state and mean values of the characteristic for signals from the group of shaft lines being unusable must be higher than the sum of standard deviations of the signals characteristics for the two groups. This characteristic is referred to as an unequivocal one Eq. (2):
where: – characteristic of signal , – group of signals of shaft line being in inability state, – group of signals of shaft lines being in ability state.
Next, the mean value and the standard deviation were calculated for each PP-OD-PO group of signals for both shaft lines (usable and unusable). Sample results for a selected group of signals for lines of useable and unusable shafts are included in the below Table 1.
Table 1Results for a selected group of signals for lines shafts in ability and inability state
Characteristic | Line shafts – ability state | Line shafts – inability state | ||
Mean value | Standard deviation | Mean value | Standard deviation | |
[] | –0.22393 | 123.382 | –11.4532 | 162.6791 |
<> | –0.00022 | 0.12049 | –0.01118 | 0.158866 |
1180398 | 424768 | 5304218 | 586579.4 | |
1152.732 | 414.8125 | 5179.9 | 572.8314 | |
–1716.63 | 83198.47 | –8242.53 | 117694.5 | |
–1427536 | 83924578 | –5683411 | 1.19E+08 | |
–7851078 | 14374029 | –1.4E+07 | 31992375 | |
–3.3E+11 | 3.55E+12 | –1.6E+12 | 1.07E+13 | |
551.6144 | 4041.813 | –3425.82 | 30283.92 | |
492605.5 | 4010389 | –1760880 | 16612434 | |
–2,4E–11 | 6,23E–10 | 5,61E–08 | 4.45E–07 | |
–1.6E+07 | 1.26E+08 | –9.2E+08 | 7.23E+09 | |
512.9525 | 36.52164 | 516.8032 | 30.33512 | |
85590.06 | 13983.15 | 85850.59 | 12221.32 | |
–22.8706 | 290.845 | 0.752316 | 11.16063 | |
Table 2Calculation results
Characteristic | Number of groups PP-OD-PO meeting the condition of concentration total (%) | Number of groups PP-OD-PO meeting the condition of unequivocality (%) |
[] | 0 | 1,47 |
<> | 0 | 1,47 |
76,47 | 58,82 | |
76,47 | 58,82 | |
0 | 0 | |
0 | 0 | |
0 | 0 | |
0 | 0 | |
0 | 0 | |
0 | 0 | |
1,47 | 0 | |
0 | 0 | |
98,52 | 0 | |
76,47 | 0 | |
0 | 0 |
The number of groups with signals meeting the condition of concentration and the number of groups with signals meeting the condition of unequivocality were defined on the basis of the calculation results. The results are presented in Table 2.
The values presented in Table 2 were calculated from a set of the signals recorded during the operational research conducted on four real objects. The cardinality of the set was equal to 113760. Therefore, the result of the analysis can be treated as a general conclusion.
3. The idea of the signals characteristics implementation
Analyzing the results of the carried out studies it was found that among the fifteen calculated characteristics it was only the energy and the signal mean power that fulfilled the condition of concentration and unequivocality. Unfortunately, they meet the conditions only partially, so cannot be used as the only criteria to identify the inability state of the main engine shafting systems. To increase the accuracy of the inability state identification there can be distinguished characteristics which fulfil the concentration condition to a relatively high degree. These are the signal energy, the signal mean power, abscissa of the signal square gravity centre and the signal square variance. The specified characteristics define the space in which, each of the registered signals can be treated as a point. In the case of the considered technical object it is the space is four dimensional (signal space) where the distinguished characteristics act as dimensions.
Basing on the values calculated in the previous part of the study, each dimension () can be divided into two ranges: the range of the values indicating the inability state of the system () and the range of the values indicating the ability state of the system ().
Fig. 6Partitioning of the dimension: Xi – the domain of the characteristic no. i, XiIA – the range of the values of the characteristic no. i indicating the inability state, XiA – the range of the values of the characteristic no. i indicating the ability state, ximax – the maximum values of the characteristic no. i, xib – the boundary value of the characteristic no. i
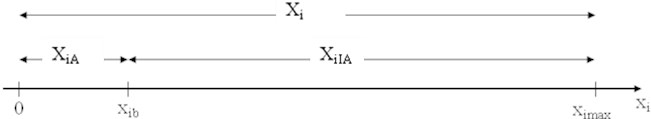
For each specified characteristic, specific values were calculated from Fig. 6. The minimum value was equal to zero. The maximum value was equal to maximum value calculated for a given characteristic. The boundary values were calculated according to the following Eq. (3):
where: – mean value of the characteristic no. calculated over group of signals of shaft line being in inability state, – mean value of the characteristic no. calculated over group of signals of shaft line being in ability state, – mean value of the standard deviation of the characteristic no. calculated over group of signals of shaft line being in inability state, – mean value of the standard deviation of the characteristic no. calculated over group of signals of shaft line being in ability state, – group of signals of shaft line being in inability state, – group of signals of shaft lines being in ability state.
The results of calculations are presented in Table 3.
Table 3Special values for characteristics – dimensions of the signal space
No. | ||||
1 | <> | 0 | 1170345,8 | 8798124 |
2 | 0 | 1142,916 | 8591,918 | |
3 | 0 | 514,1471 | 610,7768 | |
4 | 0 | 86122,61 | 101685,5 |
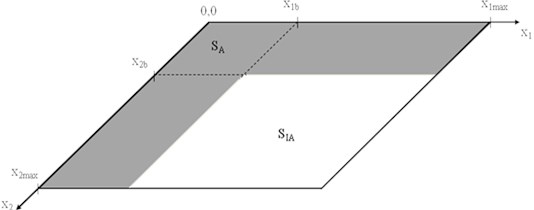
Partitioning of the characteristics domain, proposed above, implies creation of fields in the defined space. These are fields constructed by the points which are the representation of the registered signals. One of the fields consists of the points indicating the inability state of the system while the second field consists of points indicating the ability state of the system. First of them is named the field of a supposed inability state and the second the field of a supposed ability state. The exemplary position of these fields in two dimensional space is presented in Fig. 7.
In the introduced space it can be found that the signal indicates the inability state of the technical system if it fulfils the following Eq. (4):
where: – registered signal expressed in dimensional signal space, – the signal characteristic no. , – the field of supposed inability states, – the range of the values of the characteristic no. indicating the inability state.
Fig. 7The exemplary position of the fields of supposed ability (SA) and supposed inability states (SIA)
It can be also defined that the signal indicates the ability state of the technical system if it fulfils Eq. (5):
where: – registered signal expressed in dimensional signal space, – the signal characteristic no. , – the field of supposed ability states, – the range of the values of the characteristic no. indicating the ability state.
In order to identify the state of the technical system the presented definitions take into consideration values of all significant characteristics at once, so implementation of the formulated definitions can increase the accuracy of the described cases.
To illustrate how the presented idea can be used to indicate a supposed inability state let us consider one of the signals recorded during the operational research. First, the values of the characteristics (dimensions of the signal space) are calculated for the signal. As a result the following values are obtained (the order according to the Table 3): 1120451,2; 1213,87; 553,15; 93399,5. Next, the values are analyzed. Because the calculated value is bigger than the boundary value () for each characteristic the signal (the point of the signal space) fulfils condition Eq. (5). Thus, the state of the propulsion systems is defined as a supposed inability state.
To check the accuracy of the presented method of the technical system considered in the studies for each of the recorded signal, the point of the introduced signal space was determined. It was accomplished on the basis of values of significant characteristics of each signal. Next, the position of the point was specified according to Eqs. (4) and (5). As a result of the method implementation over 75 % accuracy of the ability state of the line shafts identification was reached. In Table 4 the accuracy of identification of the line shafts ability state achieved for each measurement point is presented.
The numbers of the measurement points in the table above are the same as the numbers described in the previous chapter.
Table 4Accuracy of the identification of the line shafts ability state
Measurement point | 01 | 02 | 03 | 04 | 05 | 06 |
Accuracy of ability state identification [%] | 52 | 54 | 80 | 90 | 86 | 88 |
4. Conclusions
1) Analyzing the results of the carried out studies it was found that among the fifteen calculated characteristics it was only the energy and the signal mean power that fulfilled the condition of concentration and unequivocality.
2) Because the energy and the signal mean power meet the conditions of concentration and unequivocality only partially they cannot be the only criteria used to identify the inability state of the main engine shafting systems.
3) In order to identify the state of the technical system the definitions introduced in the paper take into consideration values of all significant characteristics at once, so implementation of the formulated definitions can increase the accuracy of the described studies.
4) As a result of the method implementation over 75 % accuracy of the ability state of the line shafts identification was reached.
5) The tests performed on real technical objects of the same type, though different in terms of age and mileage, provide the possibility of finding a strategy for their renovation to match the state indicated by measurements. However, when it comes to planning renovations of this type of propeller systems it should be said that in order to develop a mixed operational strategy, that is, such including current state assessment as well as a definite maximal resourse for performance of the next renovation it is necessary to combine all the tests results. This remains an important engineering issue.
References
-
Lin T. R., Pan J., O’Shea P. J., Mechefske C. K. A study of vibration and vibration control of ship structures. Marine Structures, Vol. 22, 2009, p. 730-743.
-
Biot M., De Lorenzo F. Noise and vibrations on board ships. 2nd International Conference on Marine Research and Transportation ICMRT, 2007, p. 93-100.
-
Zheng H., Liu G. R., Tao J. S., Lam K. Y. FEM/BEM analysis of diesel piston-slap induced ship hull vibration and underwater noise. Applied Acoustics, Vol. 62, Issue 4, 2001, p. 341-358.
-
Murawski L. Shaft line alignment analysis taking ship construction flexibility and deformations into consideration. Marine Structures, Vol. 18, Issue 1, 2005, p. 62-84.
-
Skaar K. T., Carlsen C. A. Modelling aspects for finite element analysis of ship vibration. Computers and Structures, Vol. 12, Issue 4, 1980, p. 409-419.
-
Grządziela A., Muślewski Ł. High quality simulation of the effects of underwater detonation impact. Journal of Vibroengineering, Vol. 15, Issue 1, 2013, p. 106-117.
-
www.mw.mil.pl.
-
PN ISO 10816-1.
-
Lus T., Kluczyk M. The WOLA marine high speed marine engine diagnostic using vibroacustic methods. Journal of KONES Powertrain and Transport, Vol. 21, Issue 4, 2014, p. 225-230.
-
Dzitkowski T., Dymarek A. Active synthesis of machine drive systems using a comparative method. Journal of Vibroengineering, Vol. 14, Issue 2, 2012, p. 528-543.
-
Martin P., Strutt J. E., Kinkead N. A review of mechanical reliability modelling in relation to failure mechanisms. Reliability Engineering, Vol. 6, Issue 1, 1983, p. 13-42.
-
Szolc T., Tauzowski P., Stocki R., Knabel J. Damage identification in vibrating rotor-shaft systems by efficient sampling approach. Mechanical Systems and Signal Processing, Vol. 23, 2009, p. 1615-1633.
-
Bielawski P. Diagnostics of marine propeller shafts. Journal of Polish CIMAC, Vol. 6, Issue 2, 2011, p. 31-40.
-
Charchalis A., Grządziela A. Diagnosing the shafting of alignment by means vibration measurement. ICSV Congress Garmisch – Partenkirchen, 2000.
-
Matuszewski M., Łukasiewicz M., Musiał J. Application of spectral analyses for surface layer changes estimation of co-operating units with conformal contact. Journal of Polish CIMAC, Vol. 7, Issue 3, 2012, p. 191-197.
-
Kinal G., Musiał J., Shalapko J. I. The thermochemical treatment of the crankshaft journals for combustion engines: analysis, possibilities and wear resistance. Logistyka, Vol. 6, 2014, p. 5440-5448.
-
Grządziela A., Musiał J., Muślewski Ł., Pająk M. A method for identification of non-coaxiality in engine shaft lines of a selected type of naval ships. Polish Maritime Research, Vol. 21, Issue 1, 2015, p. 65-71.
-
Burdzik R. Implementation of multidimensional identification of signal characteristics in the analysis of vibration properties of an automotive vehicle’s floor panel. Eksploatacja i Niezawodność – Maintenance and Reliability, Vol. 16, Issue 3, 2014, p. 439-445.
-
Burdzik R., Konieczny Ł., Figlus T. Concept of On-Board Comfort Vibration Monitoring System for Vehicles. Activities of Transport Telematics, TST 2013, CCIS 395, Springer, Heidelberg, 2013, p. 418-425.
-
Gurr C., Rulfs H. Influence of transient operating conditions on propeller shaft bearings. Journal of Marine Engineering and Technology, Issue 12, 2008, p. 3-7.
-
Pająk M. The technical states’ space in the modelling process of operation tasks of a complex technical system. Maintenance Problems, Vol. 1, 2014.
-
Łukasiewicz M., Kałaczyński T., Musiał J., Shalapko J. I. Diagnostics of buggy vehicle transmission gearbox technical state based on modal vibrations. Journal of Vibroengineering, Vol. 16, Issue 6, 2014, p. 3137-3145.
-
Burdzik R., Węgrzyn T., Konieczny Ł., Lisiecki A. Research on influence of fatigue metal damage of the inner race of bearing on vibration in different frequencies. Archives of Metallurgy and Materials, Vol. 59, Issue 4, 2014, p. 1275-1281.
-
Muślewski Ł. Evaluation method of transport systems operation quality. Polish Journal of Environmental Studies, Vol. 18, Issue 2A, 2009.
-
Izydorczyk J., Pionka G., Tyma G. Theory of Signals. Introduction 2nd Edition – Corrected and Amended, Helion, Gliwice, 2006.
-
Szabatin J. Signal Theory Fundamentals. WKŁ, Warszawa, 2007.
About this article

