Abstract
In this paper an effective method for structural damage identification via incomplete static response and artificial neural network is proposed. The presented method is based on the condensed stiffness matrices to formulate incomplete static responses as input parameters to the Feed-forward back propagation neural network. The performance of the proposed method for damage detection and estimation has been investigated using three examples, namely, two-span continuous beam, plane steel bridge and two story frame with and without noise in the static displacements containing several damages. Also, the effect of the discrepancy in stiffness between the finite element model and the actual tested system has been investigated. The obtained results indicate that the proposed method perform quite well in spite of the incomplete data and modeling errors.
1. Introduction
Structural damage detection and estimation becomes an important issue in aerospace, mechanical or civil engineering. The most of the damage detection methods are on the basis of the changes of dynamic characteristics and static responses [1-5]. Static damage identification methods are usually simpler than the dynamic ones, since the static equilibrium equation is only relevant with the stiffness properties of structures. Moreover, the equipment in static testing is comparatively cheaper and the techniques are advanced now. Then the accurate deformation or strain of the structure can be obtained rapidly and economically. Therefore, these methods have attracted much attention in the civil engineering field [6].
Recently, Erasmo et al. [7] presented an approach to parametric system identification and damage detection in truss structures by static tests. A novelty introduced by the proposed technique is the ability to take into account plane and three-dimensional structures when only a partial set of measurements is available. In other work, Abdo [8] study the relationship between damage characteristics (location and severity) and changes in displacement curvatures. The numerical results clarify that the displacement curvature, has the characteristic of localization at the damaged region. Also, Wang et al. [9] presented an improved interval analysis technique based on the measured static displacements for the structural damage identification. The numerical example shows that the wide intervals resulting from the interval operation can be narrowed by the improved non probabilistic approach.
Recently, many researchers have made efforts to develop ANN-based methods for identifying the location and the extent of damage in structures. Lee et al. [10] presented a neural networks-based damage detection method using the modal properties, which can effectively consider the modeling errors in the baseline finite element model from which the training patterns are to be generated. Mehrjoo et al. [11] presented a damage detection algorithm to detect and estimate damage in joints of truss bridge structure using back propagation neural network method. The natural frequencies and mode shapes were used as input parameters to the neural network for damage identification. Also, Ramadas et al. [12] proposed an algorithm to detect the location and depth of transverse cracks in a composite beam by combining damage features of Lamb wave and vibration based techniques in artificial neural network (ANN) environment. In other work, Bandara et al. [13] presented an artificial neural network–based damage detection method using frequency response functions, which can effectively detect nonlinear damages for a given level of excitation. Meruane [14] developed a real-time damage assessment algorithm using ANN and anti resonant frequencies. Anti resonant frequencies can be identified more easily and more accurately than mode shapes, and they provide the same information. Also, Park et al. [15] proposed a sequential methodology for damage detection in beams using time-modal features and ANNs. Natural frequencies were used to detect the location and depth of cracks in simply supported beams and also laboratory tests on free–free beams. Gonzalez et al. [16] presented a statistical approach for seismic damage identification method based on artificial neural networks and modal variables. Also, Srinivas et al. [17] presented damage identification method based on artificial neural networks and genetic algorithms (GA). The natural frequencies and mode shapes for the first few modes have been considered for this purpose. The efficacy of mode shape expansion in conjunction with GA is demonstrated for damage identification of reinforced concrete beam based on experimental modal data.
In this study, new method is introduced to detect and estimate damage in structures using incomplete static displacements of a damaged structure and Artificial Neural Networks (ANN). In the presented study finite element model reduction method has been used to condense stiffness matrices. The presented method for damage identification has been applied to three examples, namely a two-span continuous beam, plane steel bridge and two story frame with and without noise in the static displacements. Also, the effect of the discrepancy in stiffness between the finite element model and the actual tested system has been investigated. The obtained results show that the proposed methods perform quite well in spite of the incomplete data and modeling errors.
2. Methodology
In this section, the proposed method for structural damage detection and estimation are illustrated. First, the model reduction method is formulated. Then, the designed ANN is presented.
2.1. Model reduction method
The static equilibrium equation of a structure in a displacement based finite element frame work can be expressed as follows:
where, , and are undamaged stiffness matrix, the force and displacement vectors, respectively.
One of the simplest techniques to determine damage-induced alteration stiffness is the degradation in Young’s modulus of an element as follows:
where, and are the damaged and undamaged Young’s modulus of the th element in the finite element model, respectively; and indicates the damage severity at the th element in the finite element model whose values are between 0 for an element without damage and 1 for a ruptured element.
Moreover, it is assumed that no change would occur after damage in the mass matrix, which seems to be reasonable in most real problems.
From Eq. (1), the static equilibrium equation of a damaged structure can be obtained as:
where, superscript is noted as the damage state.
As the number of sensors used to measure static responses is normally limited and usually is less than the number of DOFs in the finite element model, either the model reduction method should be used to match with incomplete measured static responses or the measured responses must be expanded to the dimension of the analytical static responses. In this study, the first option is adopted, using the Guyan static reduction method. In fact, not all displacements in can be measured. Therefore, Eq. (3) is partitioned into the master and slave coordinates as bellow:
which, the subscripts and are the master and slave coordinates, respectively. The vector of slaved displacements is condensed out, following static condensation and Eq. (3) reduces to the following:
and:
where:
in which, and are the condensed stiffness matrix and the condensed load vector ofdamaged structure; respectively.
2.2. Feed-forward back propagation network
Feed-forward neural networks are currently the most commonly used neural networks in engineering applications. Multi-layer ANN can have more than one hidden layer; however theoretical works have shown that a single hidden layer is sufficient for ANNs to approximate any complex nonlinear function [18]. Therefore, in this study, one hidden layered ANN is used. A difficult task with ANNs involves choosing parameters such as the number of hidden nodes and the learning rate. Determining an appropriate architecture of a neural network for a particular problem is an important issue, since the network topology directly affects its computational complexity and its generalization capability [19]. There is no theory yet to tell how many hidden units are needed to approximate any given function [19]. So, the hidden layer node numbers of the studied models are determined after trying various network structures.
A three-layers feed-forward is shown in Fig. 1. Hidden layer contains 3 neurons and output layer has 2 neurons. Input of this network contains 2 entries and output has 2. In the back propagation algorithm [20] the artificial neurons are organized in layers, and send their signals “forward”, and then the errors are propagated backwards. Then network receives inputs by neurons in the input layer, and the output of the network is given by the neurons on an output layer. There may be one or more intermediate hidden layers. The back propagation algorithm uses supervised learning, which means that we provide the algorithm with examples of the inputs and outputs we want the network to compute, and then the error (difference between actual and expected results) is calculated. The idea of the back propagation algorithm is to reduce this error, until the ANN learns the training data. The training begins with random weights, and the goal is to adjust them so that the error will be minimal [21].
The tangent sigmoid and pure linear functions are found appropriate for the hidden and output node activation functions, respectively. For network type, training function and adoption learning function were used Feed-Forward-Back Propagation, TRAINLM (Levenberg-Marquardt algorithm) and LEARNGDM (gradient descent momentum) respectively. Also MSE (minimum square error) was chosen as performance function. ANN was implemented by using MATLAB software [22].
Fig. 1Three-layers feed-forward artificial neural network architecture
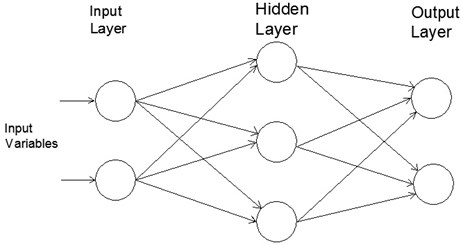
Table 1The best configuration for the ANN
Examples | Number of input layer neurons | Number of hidden layer neurons | Number of output layer neurons |
Two-span continuous beam | 8 | 30 | 10 |
Plane steel bridge | 7 | 30 | 11 |
Two story frame | 8 | 30 | 10 |
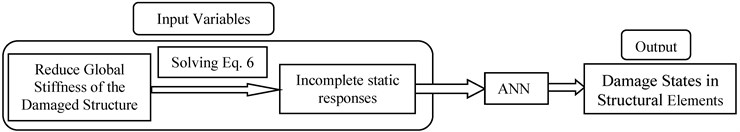
The best configuration for the network is obtained by trial and error, as listed in Table 1. Also, Figure 2 shows the Flowchart of the proposed method for damage detection and estimation in structural elements.
Fig. 2Flowchart of the damage detection method using ANN
3. Examples
In this section, the efficiency and effectiveness of the proposed method is evaluated through some numerically damage identification examples using incomplete static responses, which may be noisy or noise-free. Also, the modeling errors in the analytical model have been tested to check the proposed method. A two-span continuous beam, plane steel bridge and two story frame are chosen with two different scenarios of damage for each of them for this purpose.
3.1. Two-span continuous beam
A two-span continuous beam as illustrated in Fig. 3 with a finite-element model consisting of 10 beam elements and 11 nodes is considered. Also, two vertical point loads have been used. For the considered concrete beam, the material properties include Young’s modulus of 25 GPa, mass density of 2500 kg/m3. The cross-sectional area and the moment of inertia of the beam are 0.12 m2 and 0.0016 m4, respectively.
In this example, two damage scenarios are represented as the elements with reduction in Young’s modulus. The damage severity in each element is given by the reduction factor listed in Table 2. In this case, only 8 translational DOFs are selected as measured DOFs.
Fig. 3The two-span continuous beam with the finite element model
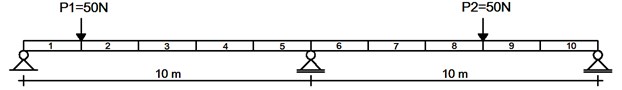
Table 2Damage scenarios for two-span continuous beam
Scenario 1 | Scenario 2 | ||
Element 7 | 0.2 | Element 2 | 0.25 |
Element 8 | 0.15 | ||
To generate training patterns, a significant number of associated structures with different static responses, using damage severity equal to 0 %; 30 %; 60 % and 0 %; 30 % for elements number 2, 8 and elements number 1, 3, 4, 5, 6, 7, 9, 10 were considered, and their responses were computed using numerical analyses. The total combination of the assigned damage severities was 2304. The results were used for training patterns. After training, the mean-square error (MSE) and Correlation Coefficient () of damage severity between each associated structure and the reference structure was then determined for which are given in Table 3. In the table, and represents the measured and modeling damage severity values, while and denote the mean of the measured and predicted values, respectively. represents the number of data sample. Correlation Coefficient () Values measure the correlation between outputs and targets. A Correlation Coefficient () value of 1 means a close relationship and zero value a random relationship. Mean Squared Error is the average squared difference between outputs and targets in which the lower values are better.
Table 3Expression of the statistical parameters used
Statistical Parameter | Expression |
Correlation Coefficient () | |
Mean Square Error () |
To be more suited with the real cases, an examination has been performed in which the measured displacements of damaged structure with 1 % noise are utilized to damage identification considering the same patterns mentioned before. To perform this, some random noise has been added to the theoretically calculated measured displacements. The contaminated displacement with noise can be obtained from the displacement without noise using the following equation:
where and are the measured displacements of damaged structure contaminated with noise and without noise, respectively. is the noise level (e.g., 0.01 relates to a 1 % noise level) and rand is a random number in the range [-1, 1].
Also, the modeling errors in the analytical model have been studied. It is assumed that the actual tested beam has perturbations of stiffness of 3 % and 2 % at elements 4 and 6; respectively.
Table 4 shows the ANN performance in Training, Validation and testing stages. Validation is used to measure network generalization, and to halt training when generalization stops improving. Testing has no effect on training and so provides an independent measure of network performance during and after training [21].
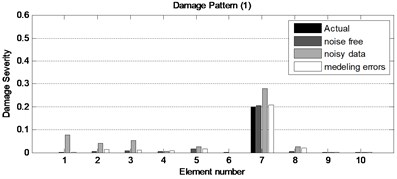
Figure 4 shows the results of damage identification in the two-span continuous beam for two damage patterns with and without noise in static displacements and modeling errors. It depicts that the proposed method is a robust and effective method in detecting and quantifying various damage patterns. Although, some undamaged elements are detected as damage by mistake in which value of damage is very low using noisy data.
Table 4Statistics for training, validation and testing for two-span continuous beam
Samples | |||
Training | 1612 | 3.206E-5 | 0.9995 |
Validation | 346 | 3.8567E-5 | 0.9994 |
Testing | 346 | 3.898E-5 | 0.9995 |
Fig. 4The obtained results for two damage patterns of the two-span continuous beam with incomplete noisy data and modeling errors
3.2. Plane steel bridge
A plane steel bridge as illustrated in Fig. 5 with finite-element model consists of elements 1 to 4 as beam-column elements; 5 to 8 as beam elements and 9 to 11 as column elements are considered. The uniformly distributed load 50 kN/m at the beam elements has been used. For the considered steel bridge, the material properties of the steel include Young’s modulus of 200 GPa. The cross-sectional area of the columns is: 150×10-4 m4. The moment of inertia, and cross-sectional area of the beam-columns are: 189813.3×10-8 m4 and 280×10-4 m2, respectively. The moment of inertia of the beams is: 189813.3×10-8 m4.
Fig. 5The plane steel bridge with the finite element model
Also, the damage severity in each element is given by the reduction factor listed in Table 5. In this case, only the last 7 DOFs of bridge are selected as measured DOFs in the process of damage detection and quantification.
Table 5Damage scenarios for plane steel bridge
Scenario 1 | Scenario 2 | ||
Element 2 | 0.3 | Element 4 | 0.3 |
Element 11 | 0.15 | ||
To generate training patterns, a significant number of associated structures with different static responses, using damage severity equal to 0 % and 40 % for all elements, and their responses were computed using numerical analyses. The total combination of the assigned damage severities was 2048.
Table 6 shows the ANN performance in training, validation and testing stages. According to Table 6, Correlation coefficient () values are close to 1 and Mean Squared Error () values are the low values.
Table 6Statistics for training, validation and testing for plane steel bridge
Samples | |||
Training | 1434 | 7.445E-4 | 0.9906 |
Validation | 307 | 1.085E-4 | 0.9863 |
Testing | 307 | 8.175E-4 | 0.9897 |
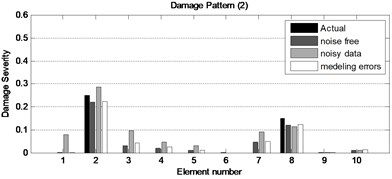
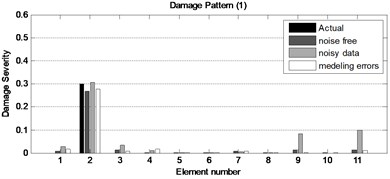
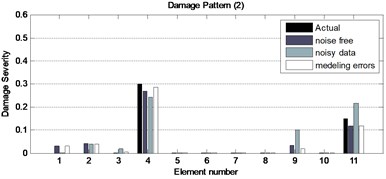
To be more suited with the real cases, another examination has been performed in which the static displacements with 1 % noise are utilized to damage identification considering the same patterns mentioned before. Also, the modeling errors in the analytical model have been investigated. It is assumed that the actual tested frame has perturbations of stiffness of 2 % and 3 % at elements 4 and 9; respectively. Figure 6 shows the efficiency and effectiveness of the proposed method considering the modeling errors and noisy data. It can be seen that the damage severity and locations are precisely obtained for two different patterns in spite of incomplete noisy data and modeling errors.
Fig. 6The obtained results for three damage patterns of the plane steel bridge with incomplete noisy data and modeling errors
3.3. Two story frame
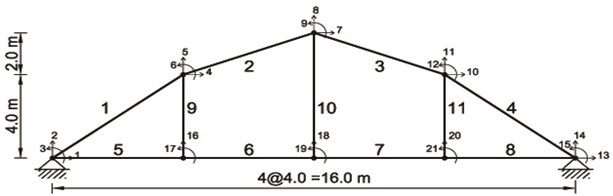
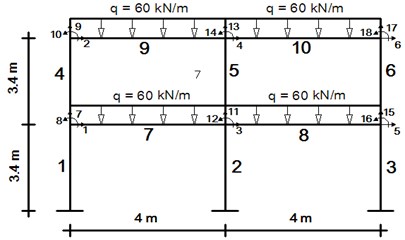
A two-story plane steel frame as illustrated in Fig. 7 with finite-element model consists of ten elements (six columns and four beams) and six free nodes are considered. Also, uniformly distributed load of 60 kN/m at the beam elements has been used. For the considered steel frame, the material properties of the steel include Young’s modulus of 200 GPa, mass density of 7850 kg/m3. The mass per unit length, moment of inertia, and cross-sectional area of the columns are: 117.75 kg/m, 3.3×10⁻⁴ m4 and 1.5×10⁻² m2, respectively; for the beams are: 119.71 kg/m, 3.69×10⁻⁴ m4 and 1.52×10⁻² m2.
Fig. 7The two story frame with the finite element model
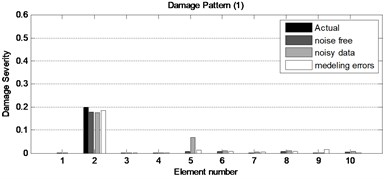
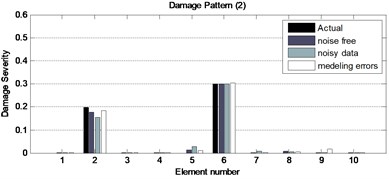
Also, the damage severity in each element is given by the reduction factor listed in Table 7. In this case, only the first 8 DOFs of bridge are selected as measured DOFs in the process of damage detection and quantification.
Table 7Damage scenarios for two story frame
Scenario 1 | Scenario 2 | ||
Element 2 | 0.2 | Element 2 | 0.25 |
Element 6 | 0.3 | ||
To generate training patterns, a significant number of associated structures with different static responses, using damage severity equal to 0 % and 30 % for all elements, and their responses were computed using numerical analyses. The total combination of the assigned damage severities was 1024.
Table 8Statistics for training, validation and testing for two-story steel frame
Samples | |||
Training | 716 | 4.967E-6 | 0.9998 |
Validation | 154 | 9.605E-6 | 0.9997 |
Testing | 154 | 8.554E-6 | 0.9998 |
To evaluate the efficiency of the proposed method another examinations has been performed in which the static displacements with 1 % noise. Also, It is assumed that the actual tested frame has perturbations of stiffness of 3 % and 2 % at elements 5 and 9; respectively. Figure 8 shows the capability of the proposed method for detection and quantification of damage in considering the modeling errors and noisy data. The obtained results indicated that the proposed method can be characterized as a robust and viable method for structural damage detection and quantification.
Fig. 8The obtained results for two damage patterns of the two story frame with incomplete noisy data and modeling errors
4. Conclusions
This study presented a new method for structural damage detection and estimation using incomplete static responses and artificial neural network. The proposed method can be localized and quantified the damage severity using condensed stiffness matrices to formulate incomplete static responses as input parameters to ANN. To verify the efficiency and applicability of the proposed method, a comprehensive study on the damage detection and estimation using incomplete and noisy data was conducted through simulated damage patterns. Also, the effects of perturbation in stiffness matrices were considered. The obtained results indicated that the proposed method is a strong and viable method to the problem of structural damage detection in spite of incomplete noisy data and modeling errors.
References
-
He Rong-Song, Hwang Shun-Fa Damage detection by a hybrid real-parameter genetic algorithm under the assistance of grey relation analysis. Engineering Application of Artificial Intelligence, Vol. 20, 2007, p. 980-992.
-
Kourehli S. S., Ghodrati Amiri G., Ghafory-Ashtiany M., Bagheri A. Structural damage detection based on incomplete modal data using pattern search algorithm. Journal of Vibration and Control, Vol. 19, 2012, p. 6821-6833.
-
Kourehli S. S., Bagheri A., Ghodrati Amiri G., Ghafory-Ashtiany M. Structural damage detection using incomplete modal data and incomplete static response. KSCE Journal of Civil Engineering, Vol. 17, Issue 1, 2013, p. 216-223.
-
Rasouli A., Ghodrati Amiri G., Kheyroddin A., Ghafory-Ashtiany M., Kourehli S. S. A new method for damage prognosis based on incomplete modal data via an evolutionary algorithm. European Journal of Environmental and Civil Engineering, Vol. 18, Issue 3, 2014, p. 253-270.
-
Kourehli S. S., Bagheri A., Ghodrati Amiri G., Ghafory-Ashtiany M. Structural damage identification method based on incomplete static responses using an optimization problem. Scientia Iranica, Vol. 21, Issue 4, 2014, p. 1209-1216.
-
Wang X., Hu N., Fukunaga Hisao, Yao Z. H. Structural damage identification using static test data and changes in frequencies. Engineering Structures, Vol. 23, 2001, p. 610-621.
-
Viola Erasmo, Paolo Bocchini Non-destructive parametric system identification and damage detection in truss structures by static tests. Structure and Infrastructure Engineering, Vol. 9, Issue 5, 2013, p. 384-402.
-
Abdo Mohamed Abdel-Basset Parametric study of using only static response in structural damage detection. Engineering Structures, Vol. 34, 2012, p. 124-131.
-
Wang Xiaojun, Haifeng Yang, Lei Wang, Zhiping Qiu Interval analysis method for structural damage identification based on multiple load cases. Journal of Applied Mechanics, Vol. 79, Issue 5, 2012, p. 051010.
-
Lee Jong Jae, Lee Jong Won, Yi Jin Hak, Yun Chung Bang, Jung Hie Young Neural networks-based damage detection for bridges considering errors in baseline finite element models. Journal of Sound and Vibration, Vol. 280, Issue 3, 2005, p. 555-578.
-
Mehrjoo Mohsen, Khaji Naser, Moharrami H., Bahreininejad A. Damage detection of truss bridge joints using artificial neural networks. Expert Systems with Applications, Vol. 35, Issue 3, 2008, p. 1122-1131.
-
Ramadas C., Balasubramaniam K., Joshi M., Krishnamurthy C. V. Detection of transverse cracks in a composite beam using combined features of lamb wave and vibration techniques in ANN environment. International Journal on Smart Sensing and Intelligent Systems, Vol. 1, Issue 10, 2008, p. 970-984.
-
Bandara R. P., Chan T. H. T., Thambiratnam D. P. Structural damage detection method using frequency response functions. Structural Health Monitoring, 2014.
-
Meruane V., Mahu J. Real-Time structural damage assessment using artificial neural networks and antiresonant frequencies. Shock and Vibration, Vol. 2014, 2014, p. 653279-14.
-
Park J. H., Kim J. T., Hong D. S., Ho D. D., Yi J. H. Sequential damage detection approaches for beams using time-modal features and artificial neural networks. Journal of Sound and Vibration, Vol. 323, Issue 1-2, 2009, p. 451-474.
-
Gonzalez M. P., Zapico J. L. Seismic damage identification in buildings using neural networks and modal data. Computers & Structures – Journal, Vol. 86, Issue 3, 2008, p. 416-426.
-
Srinivas V., Jeyasehar C. A., Ramanjaneyulu K. Computational methodologies for vibration-based damage assessment of structures. International Journal of Structural Stability and Dynamics, Vol. 13, Issue 8, 2013.
-
Haykin S., Cybenko G. Approximation by Superposition of a Sigmoidal Function Neural Networks, 2nd Edition. Prentice Hall, Englewood Cliffs, NJ, 1999, p. 303-314.
-
Roushangar K., Akhgar S., Salmasi F., Shiri J. Modeling energy dissipation over stepped spillways using machine learning approaches. Journal of Hydrology, Vol. 508, 2014, p. 254-265.
-
Rumelhart D. E., McClell J. L. Parallel distributed processing. Foundations. Vol. 1, MIT Press, 1986.
-
Gershenson C. Artificial Neural Network for Beginners. Formal Computational Skills Teaching Package, COGS, University of Sussex, 2001.
-
Matlab User Manual. Mathwork Inc. Lowell, MA, USA, 2013.
About this article

