Abstract
Due to locating on seismic belt and its seismic condition, Iran country, is very sensitive to earthquake. Because of estimating importance of damages and casualties through earthquake, many countries have selected different methods for seismic hazard analysis. Many of these methods are based on earthquake severity. Although damage function majority of these methods is based on seismic data, structural parameters are not considered. The objective of current study is to evaluate the seismic vulnerability buildings in Tabriz city based on the Hazus method and geographical information system (GIS) and level of damage and victims is calculated for different kinds of structures, separately, in the whole region of investigation. The open source software SELENA is applied to perform probabilistic loss estimates. Due to the lack of studies providing required information from structural point of view in our country, and the existence of similarity between structural codes of Iran and that of United States, HAZUS-MH (Hazard Us – Multi Hazard Loss) structures coefficients are used. The results indicated provides if an earthquake based on standard 2800 occurs, the number of casualties would be 91000 persons and economic losses are 74970864578.49914$.
1. Introduction
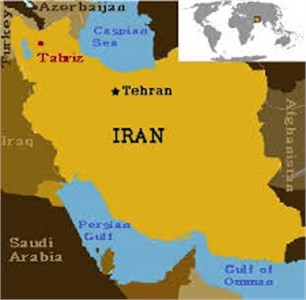
Iran is situated over one of the seismic zones of the world, the Himalayan-Alpide seismic belt. The occurrence of devastating earthquakes has imposed notable damages to the buildings and lifelines, and, unfortunately, has caused huge loss of human life. Robust assessment of seismic damage and loss for Tabriz, the capital city of Iran, is compulsory due to some major reasons:
• The population of Tabriz is over 1.5 million people, which makes it the center of main political, economic, social, and cultural activities in Iran.
• The results of previous seismic hazard analysis of region show the high probability of occurrence of severe earthquakes in future. Considering the historical background of earthquakes and the existence of major faults near and within the city, the probability of occurrence of an earthquake with a moment magnitude Mw greater than 7 is seriously high.
Tabriz is the most populated city in the northwest of Iran, one of the historical capitals of Iran, and the present capital of East Azerbaijan Province. Tabriz is located at an elevation of 1,350 meters above sea level in the Quru River valley between the long ridge of the volcanic cone of Sahand and Eynalimountain. The valley opens up into a plain that gently slopes down to the eastern shores of Lake Urmia, 60 kilometres (37 miles) to the west. With cold winters and temperate summers, the city is considered a summer resort.
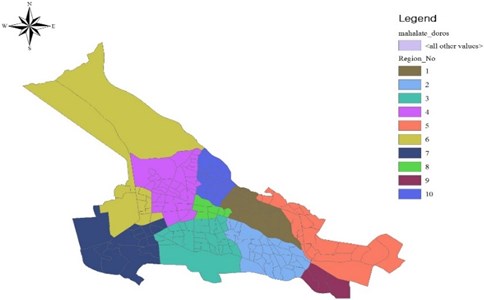
To quantify the region’s seismic hazard, a peak ground acceleration PGA of 0.35 g for a rock site corresponding to the 10 % probability of exceedance in 50 years (the return period of 475-year) is proposed by Iranian Code of Practice for Seismic Resistant Design of Buildings [1]. Tabriz is divided into 10 municipality zones as is sketched in Fig. 1.
We employ this zoning approach in the later processing of structural information and population data; however, some subdivisions on these zones may be used.
As it is mentioned earlier, the special conditions of Tabriz have caused rapid growth in population and construction. More than 95.4 % of structures in 2011 were in one of steel, concrete, and masonry categories [2]. Although the progress of substitution of masonry buildings with steel and concrete structures has been considerable, still, a large proportion of casualties in severity levels 3 and 4 are related to masonry structures.
Fig. 1Overview map of the city of Tabriz with 10 municipality zones
2. Compilations of data
2.1. Building inventory
Up to 2006, Iran’s population and housing census has been conducted every ten years [2]. The latest information is developed until 2011.
According to the HAZUS-MH classification of structures [5], there are 17 types of building in Tabriz, the characteristics of which are consistent with HAZUS-MH Structures. These structures are shown in Table 2. Structures are classified in three categories: steel, concrete, and masonry. Fig. 2 depict the area corresponding to each type of buildings. Since occupancy classes are reported in formal census in term of building area; In the present work, 6 major occupancy classes: residential, education, commercial (retail trade, personal and repair services), hospital and medical office, and government are considered. Since there is no information suggesting buildings age in previous censuses, all steel and concrete structures are assumed moderate-code buildings, while masonry structures are in low-code design level.
2.2. Demographic information and casualty model
Fig. 3 illustrates the distribution of population among different zones in 2011 [2]. We have used different occupancy classes to calculate MDR and economic losses. The population should be distributed using different zones and occupancy types. Due to the lack of sufficient formal data describing this distribution, probable earthquake casualties are calculated just in 2:00 a.m. One should keep in mind that the latter assumption means that the residential occupancy plays a significant role in the development of casualty model. The HAZUS methodology has been manipulated to estimate the probable earthquake casualties.
The applied methodology for calculating the number of human casualties, basically, follows the HAZUS approach but is somewhat simplified using the formulas given by Coburn and Spenceequation [4]:
where, is the number of casualties due to structural damage, is the number of casualties due to non-structural damage and is the number of casualties due to follow-on hazards such as landslides, fires, etc.
Equation can also be modified such that the level of injury (severity) is considered:
where represents the level of severity, ranging from light injuries, moderate injuries, heavy injuries to death.
A more detailed description of the severity levels is given in Table 1.
In order to consider several cases of occupancy which strongly depend on time of day (i.e., school occupied only during daytime), three different times are considered for prediction of the casualty numbers:
1) Nighttime scenario (called 02:00 am): i.e. earthquake striking during night time.
2) Daytime scenario (called 10:00 am): i.e. earthquake striking during day time.
3) Commuting time scenario (called 05:00 pm): i.e. earthquake striking during the commuting time.
Table 1Injury classification scale according to Hazus
Injury level | Description |
Severity 1 | Injuries requiring basic medical aid that could be administered by paraprofessionals. These types of injuries would require bandages or observation. |
Severity 2 | Injuries requiring a greater degree of medical care and use of medical technology such as -rays or surgery, but not expected to progress to a life threatening status. |
Severity 3 | Injuries that pose an immediate life threatening condition if not treated adequately and expeditiously. |
Severity 4 | Instantaneously killed or mortally injured. |
Fig. 2Built area of steel, concrete, and masonry structures in Tabriz’s regions in 2011 (square meters) [2, 3]
![Built area of steel, concrete, and masonry structures in Tabriz’s regions in 2011 (square meters) [2, 3]](https://static-01.extrica.com/articles/16073/16073-img3.jpg)
Fig. 3Population of Tabriz’s regions in 2011 [2]
![Population of Tabriz’s regions in 2011 [2]](https://static-01.extrica.com/articles/16073/16073-img4.jpg)
Table 2Model building types [5]
No. | Label | Description | Height | |||
Range | Typical | |||||
Name | Stories | Stories | Meter | |||
1 | S1L | Steel moment frame | Low-rise | 1-3 | 2 | 8 |
2 | S1M | Mid-rise | 4-7 | 5 | 20 | |
3 | S1H | High-rise | +8 | 13 | 52 | |
4 | S2L | Steel braced frame | Low-rise | 1-3 | 2 | 8 |
5 | S2M | Mid-rise | 4-7 | 5 | 20 | |
6 | S2H | High-rise | 8+ | 13 | 52 | |
7 | S4L | Steel frame with cast-in-place concrete shear walls | Low-rise | 1-3 | 2 | 8 |
8 | S4M | Mid-rise | 4-7 | 5 | 20 | |
9 | S4H | High-rise | 8+ | 13 | 52 | |
10 | C1L | Concrete moment frame | Low-rise | 1-3 | 2 | 8 |
11 | C1M | Mid-rise | 4-7 | 5 | 20 | |
12 | C1H | High-rise | 8+ | 13 | 52 | |
13 | C2L | Concrete shear walls | Low-rise | 1-3 | 2 | 8 |
14 | C2M | Mid-rise | 4-7 | 5 | 20 | |
15 | C2H | High-rise | 8+ | 13 | 52 | |
16 | URML | Unreinforced masonry bearing walls | Low-rise | 1-2 | 1 | 5 |
17 | URMM | Mid-rise | 3+ | 3 | 11.6 | |
2.3. Development of economic loss model
In recent years, many public and government buildings have been retrofitted in Iran. Therefore, the costs of rebuilding of structures in earthquake-stricken areas have been estimated. These costs vary according to the type and height of structures. Table 3 presents a summary of mentioned costs. Retrofitting and rehabilitation of buildings after earthquake differs based on damaged level. In practice, costs of retrofitting equal 10, 20, 40, and 60 percent of those of rebuilding procedure for slight, moderate, extensive, and complete damage levels, respectively.
Economic loss for building renovation (and for reconstruction, in the case of complete damage) is computed based on the following equation [4]:
where is the number of occupation types, presents the number of building types and is the number of damage states. In this equation, , is regional cost multiplier (currently is set to 1.0, but can have different values for each geographical region in order to take into account the geographic cost variations); is the area of building type with type occupancy (in m2); is the damage probability of a structural damage type (slight, moderate, extensive or complete) in the building type and is the cost of renovation or reconstruction (per m2) for structural damage in building type with occupancy.
3. Definition of seismic loss scenario for Tabriz
Generally, risk is defined as the expected physical damage and the resulting economic losses that are computed from the convolution
of probability of occurrence of hazardous events and the vulnerability of the elements exposed to certain hazard [6]. According to the McGuire the seismic risk entails a set of events (earthquakes likely to happen), the associated effects (damage and loss in the broadest sense), and the associated probabilities of occurrence over a defined period of time [7].
Thus, the seismic risk can be expressed as the combination of seismic hazard, exposure, vulnerability, and assets involved [6]. Earthquakes may cause huge economic losses, the majority of which is contributed to the structural damages; however, the nonstructural damages can impose considerable losses, especially, in industrial and hospital occupancy classes. It is worth pointing out that there are other sources causing economic losses after occurrence of earthquake, such as the debris collection. Since, the calculation of latter losses needs specific information related latter losses needs specific information related to the quality of roads and landfill distances, in this paper, we have focused only on structural losses.
Table 3New building construction cost (Dollars per square meter)
Occupancy | S1L | S1M | S1H | S2L | S2M | S2H | S4L | S4M | S4H |
Residential | 250 | 250 | 375 | 312.5 | 312.5 | 375 | 250 | 250 | 375 |
Commercial | 250 | 250 | 375 | 312.5 | 312.5 | 375 | 250 | 250 | 375 |
Hospital | 500 | 500 | 750 | 625 | 625 | 750 | 500 | 500 | 750 |
Repair Service | 250 | 250 | 375 | 312.5 | 312.5 | 375 | 250 | 250 | 375 |
Government | 325 | 325 | 487.5 | 406.25 | 406.3 | 487.5 | 325 | 325 | 487.5 |
Education | 450 | 450 | 675 | 562.5 | 562.5 | 675 | 450 | 450 | 675 |
Occupancy | C1L | C1M | C1H | C2L | C2M | C2H | URML | URMM | – |
Residential | 250 | 250 | 375 | 312.5 | 312.5 | 375 | 187.5 | 187.5 | – |
Commercial | 250 | 250 | 375 | 312.5 | 312.5 | 375 | 187.5 | 187.5 | – |
Hospital | 500 | 500 | 750 | 625 | 625 | 750 | 375 | 375 | – |
Repair Service | 250 | 250 | 375 | 312.5 | 312.5 | 375 | 187.5 | 187.5 | – |
Government | 325 | 325 | 487.5 | 406.25 | 406.3 | 487.5 | 243.8 | 243.75 | – |
Education | 450 | 450 | 675 | 562.5 | 562.5 | 675 | 337.5 | 337.5 | – |
3.1. Damage and loss assessment method and applied software
In general, two approaches are available to estimate the earthquake damage suffered by a certain building. Traditional approach uses empirical parameters, such as macro seismic intensity or peak ground acceleration, to represent ground motion, whereas the more recent analytical method employs the entire response spectra, preferably, in the spectral acceleration-spectral displacement domain [8]. The capacity spectrum method has been applied to compute iteratively the inelastic spectral lateral displacement demand , which is a measure of damage extent. In order to estimate the possible damage to the building stock of Tabriz, the analytical risk and loss assessment tool SELENA has been applied [4]. In SELENA, three user-selectable methods are incorporated to compute the damage: the traditional capacity spectrum method proposed in ATC-40 [9], a recent modification called the modified acceleration-displacement response spectra (MADRS) method, and the improved displacement coefficient method IDCM [10]. In the present study, we select the MADRS procedure. As mentioned above in this study we manipulated 17 types of HAZUS buildings. Capacity curves of these buildings are showed in Fig. 4.
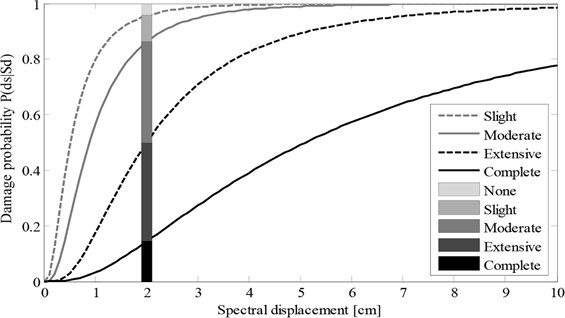
The probability of being in or exceeding a given damage state is modeled as a cumulative lognormal distribution. For structural damage, given the spectral displacement, the probability of being in or exceeding a damage state, is modeled as:
where: – median value of spectral displacement at which the building reaches the threshold of damage state , is the standard deviation of the natural logarithm of spectral displacement for damage states, is the standard normal cumulative distribution function. Refer to HAZUS-MH technical manual to get Coefficients [5]. Probability of each damage level could be obtained from fragility curve. In Fig. 5 a typical fragility curve has been illustrated.
Fig. 4Capacity curves for selected model building types in the city of Tabriz
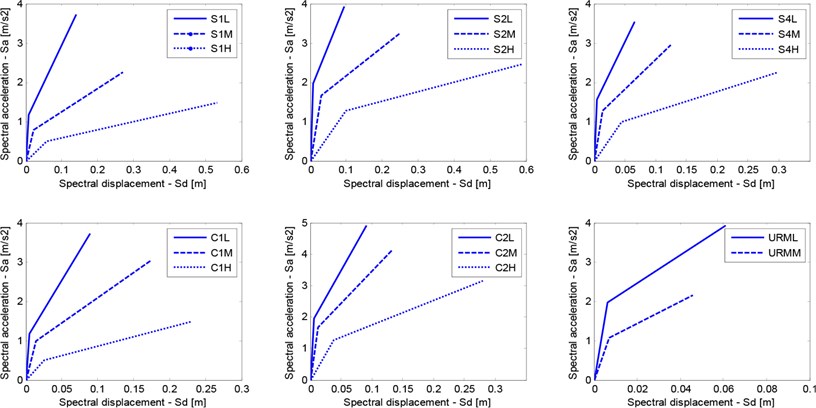
Fig. 5Typical fragility curve and damage probability
3.2. Probabilistic earthquake scenarios for Tabriz
In this article, an evaluation of the seismic risk of Tabriz is provided. There are several major faults surrounding Tabriz, each of which has caused at least one severe earthquake. These faults have the potential to generate high magnitude ground motions. Having a review of seismic risk of Tabriz, we can conclude that we cannot choose a specific fault for subsequent steps of our study, so, a probabilistic scheme is used. According to the Iranian Code of Practice for Seismic Resistant Design of Buildings [1], Tabriz is situated in a region with high seismic risk in Iran (Fig. 6).
3.3. Probabilistic seismic hazard parameters of Tabriz
According to Iranian Code of Practice for Seismic Resistant Design of Buildings [11], the peak ground acceleration proposed for seismic design of structures in Tehran as a high-risk region is 0.3 g. The methodology characterizes ground shaking using a standardized response spectrum shape as given in IBC-2006 [11], which consists of four parts:
PGA, a region constant spectral acceleration at periods from zero seconds to , a region of constant spectral velocity between periods from to ; and a region of constatnt spectral displacement for periods of and beyond. In general, the elastic design spectrum is defined by the following equations:
The period is based on the intersection of the region of constant spectral acceleration and constant spectral velocity and its value varies depending on the values of spectral acceleration that define these two intersecting regions:
The period representing the left corner period of the spectral plateau can be determined as follows:
Fig. 6a) Iran’s probabilistic seismic hazard map [2], b) distribution of Tabriz’s faults [4]
![a) Iran’s probabilistic seismic hazard map [2], b) distribution of Tabriz’s faults [4]](https://static-01.extrica.com/articles/16073/16073-img7.jpg)
a)
![a) Iran’s probabilistic seismic hazard map [2], b) distribution of Tabriz’s faults [4]](https://static-01.extrica.com/articles/16073/16073-img8.jpg)
b)
The constant spectral displacement region has spectral acceleration proportional to and is anchored to the spectral acceleration value at the period , where constant spectral velocity transitions to constant spectral displacement. The period is based on the reciprocal of the corner frequency , which is proportional to stress drop and seismic moment:
where, is the corner frequency.
The response spectrum which is usually in terms of versus is converted to versus . By definition, the values of are calculated from the following formula:
Eq. (12) gives the spectral displacement:
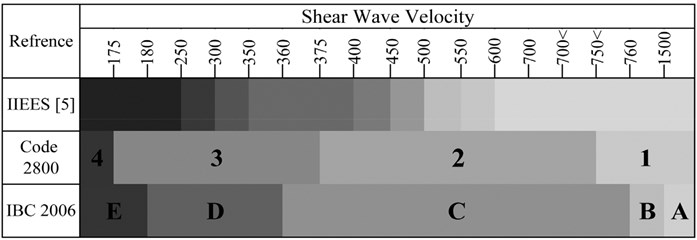
where: – design basis acceleration over bedrock (suggested value is 0.35 g for the entire Tabriz region), – the response factor representing both the amplifying effects of soil deposit and the structural response, simultaneously. Soil type is determined using the average shear wave velocity
Spectral accelerations for city of Tabriz for four different soil types are presented in Fig. 7.
As it is obvious in Fig. 8, there is an acceptable agreement between the results of Iranian Code of Practice for Seismic Resistant Design of Buildings [11] and those of IBC-2006.
Fig. 7Spectral acceleration of four soil types
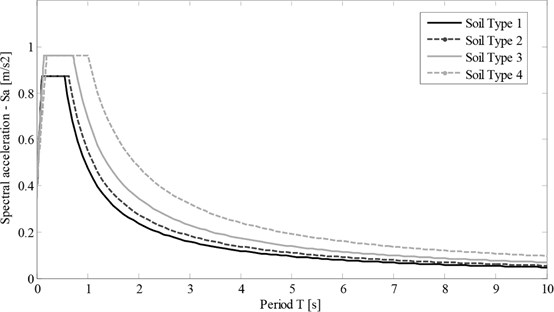
Fig. 8Shear wave velocity domain using three references
4. Probabilistic damage scenario
4.1. Introduction of a function describing building damageability
Since damage estimates are provided as disaggregated numbers for distinct damage states (in this paper: slight, moderate, extensive, and complete), a one-to-one comparison of damage results is not easy to visualize. Consequently, damage and loss estimates are represented by total economic loss as well as mean damage ratio. Both parameters allow a one-to-one comparison between the results.
MDR can be computed for a certain area and building typology. Several MDRs can be defined for different purposes. In this study we calculated three types of MDR which are according below.
1) MDR for each geounit and all building types:
where is the damage ratio of the model building type corresponding the damage state where for slight, for moderate for extensive and for complete. is the damaged built area corresponding to the damage state (, , , ) for the model building type at the geounit . is the total built area at the geounit . for all the model building types 1,…, .
This parameter helps us to compare different region in one city, and to determine which of regions must be in the top priority of rehabilitation process.
2) MDR for each model building types and all regions:
where is the total built area for the model building type and added to all the geounits 1,…, . Other parameters are according the above equation One of the criteria of city extension (both horizontally and vertically) is considering of its seismic vulnerability. This parameter demonstrates that between two years of study whether specific kind of structure has been built in less prone to earthquake area or not. Meanwhile, it can helps to authorities to determine the critical type of building for rehabilitation.
3) MDR for all model building type and all geounits:
This parameter which is only one number to the whole city, demonstrates the mean damage ratio of entire city. It could be useful to compare to different city; or one city in different years to demonstrate whether the rehabilitation policies would be affective or not.
4.2. MDR for regions of Tabriz in 2011
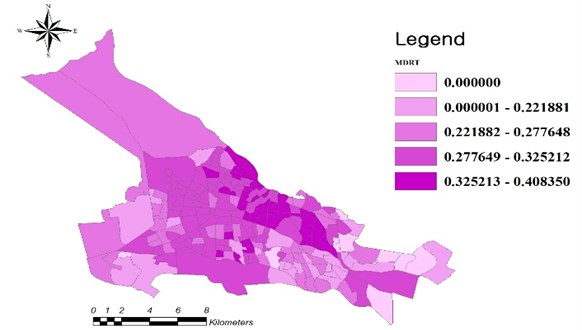
Mean damage ratio in each region in 2011 which are calculated through Eq. (11) are depicted in Fig. 9, respectively.
Fig. 9MDR of different regions of Tabriz in 2011
4.3. MDR for buildings of Tabriz in 2011
With reference to the Fig. 10, we can obtain mean damage ratio calculated for each type of building in Tabriz (According to Eq. (15)).
4.4. Monetary loss due to probable earthquake in Tabriz
A probable monetary loss due to the possible earthquake defined by Iranian Code of Practice for Seismic Resistant Design of Buildings [1] is presented in Fig. 11. Monetary loss has been computed for 2011 using the same currency unit.
Fig. 10MDR for each building type in Tabriz computed for 2011
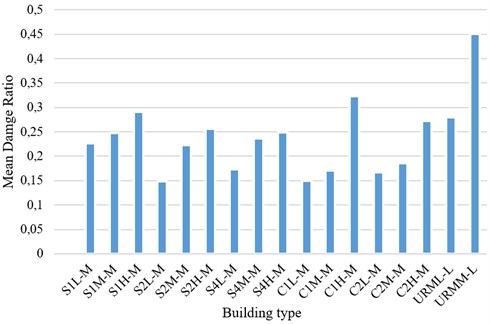
Fig. 11Monetary loss due to probable earthquake in Tabriz in 2011 (millions dollars)
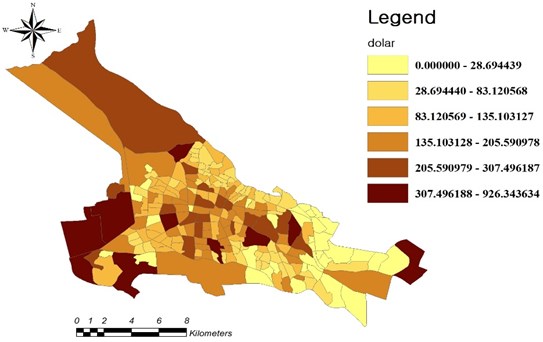
Table 4Cumulative number of casualties in Tabriz
Census year | Severity 1 | Severity2 | Severity 3 | Severity 4 |
2011 | 61857.2 | 20004.1 | 2841.4 | 5506.5 |
5. Conclusions
Analysis provides if an earthquake based on Std. 2800 occurs, the number of casualties would be 91000 persons and economic losses are 74970864578.49914 $.
Total MDR for entire of Tabriz in 2011 is 0.29.
Results show that the amount of casualties in parts of this zone are more than the others, because, these districts contain more dilapidated building than other districts. To examine the masonry structures, we should note that the percentage of masonry structures in region 5 and 4 is notable. On the other hand, the growth of construction in this region has been rapid.
The substitution of masonry structures with steel buildings and high percentage of this type of structures in middle and east parts of Tabriz have caused an increase in MDR for steel structures.
It should be mentioned that in these parts of the city the type of soil increases the seismic risk.
References
-
BHRC, Iranian code of practice for seismic resistant design of buildings, Standard No. 2800. 3rd Revision, Building and Housing Research Center, Tehran, Iran, 2005.
-
“Fact sheet: Atlas of Tabriz Metropolis. Tabriz Municipality, http://fava.tabriz.ir/?MID=21& Type=content&TypeID=1&ID=15, 2011.
-
Residential and Urbanization Office, GIS Map of Tabriz City. 2011-2012.
-
Molina S., Lang D. H., Lindholm C. D. SELENA – an open-source tool for seismic risk and loss assessment using a logic tree computation procedure. Computers and Geosciences, Vol. 36, Issue 3, 2010, p. 257-269.
-
Multi-Hazard Loss Estimation Methodology. HAZUS®MH Technical Manual. National Institute of Building Sciences and Federal Emergency Management Agency, Washington, D.C., 2003, p. 712.
-
Lang D., Molina-Palacios S., Lindholm C., Balan S. Deterministic earthquake damage and loss assessment for the city of Bucharest. Journal of Seismology, Vol. 16, Issue 1, 2012, p. 67-88.
-
McGuire R. K. Seismic Hazard and Risk Analysis, Oakland. EERI Publication No. MNO-10. Earthquake Engineering Research Institute, 2004, p. 221.
-
Crowley H., Pinho R., Bommer J. J. A probabilistic displacement-based vulnerability assessment procedure for earthquake loss estimation. Bulletin of Earthquake Engineering, Vol. 2, Issue 2, 2004, p. 173-219.
-
Seismic Evaluation and Retrofit of Concrete Buildings. Applied Technology Council, Report ATC-40, Redwood City, 1996, p. 346.
-
Improvement of Nonlinear Static Seismic Analysis Procedures. FEMA-440, Redwood City, 2005, p. 392.
-
International Building Code (IBC-2006). International Code Council, United States, 2006, p. 678.
About this article

