Abstract
In order to generate arbitrary mechanical displacements, i.e. acoustic signals of the microsecond range in dispersive waveguides, different existing signal processing techniques were analyzed and new techniques introduced. The proposed parameter Q was used for the comparison of the arbitrary waveform acoustic signal generation techniques. The arbitrary acoustic signal duration optimization parameter was introduced. The arbitrary waveform acoustic signal generation techniques were applied for the generation of the microsecond range duration acoustic signals.
1. Introduction
Determining the pulse response and frequency response characteristics of the low frequency acoustic emission transducers (AET) by the calibration process is one of the most important procedures in ensuring the traceability of the acoustic emission measurement results in the non-destructive testing (NDT). The demand for the novel and smart AET transducers and their calibration methods in the NDT market and among the AET producers are showing clear growth potential. The existing standardized AET calibration methods, such as the step-function calibration and the reciprocity calibration ASTM E1106 [1] and ISO 12713 [2], enable to acquire the frequency and pulse response characteristics using laboratory equipment.
The development of portable AET calibration equipment using standard methods is difficult yet not feasible due to big dimensions of the calibration block and requiring feedback channel for precise displacement measurement. During the development process of portable calibration equipment for the low frequency AET with the purpose to create the predefined arbitrary mechanical displacement waveforms in the AET aperture, a rod-shape solid bar type (steel or brass) waveguide was proposed as the acoustic waveguide.
Research results revealed that for the calibration of AET using longitudinal wave and rod-shape solid bar type (steel or brass) waveguide, its length needs to be from 0.5 m to 1 m. At this length, the waveguide’s dispersive properties becomes significant. The excitation signal, caused at one end of the waveguide and resulting the vibration at the other end of the waveguide are different because of dispersion. Acoustic signal depends on the waveguide’s length and diameter. Conventional acoustic signal excitation techniques do not allow to generate arbitrary type signals required for the calibration of AET.
The wave dispersion phenomenon is widely known in fiber optic communications [3], non-destructive testing [4, 5], submarine acoustics [6-8] and other fields. The existing solutions for eliminating the wave dispersion are based on the time reversal mirror implementation and deconvolution-based signal processing. The deconvolution based method is more complex and requires more processing power and time. The time reversal mirroring method is simpler and requires smaller amount of calculations, and both of these methods are applied in many fields, including acoustics and optics. The drawback of the existing solutions is that they can lead to additional noise and lack a parameter which would allow the quantitive evaluation of the acoustic signals.
This paper analyses and compares the existing signal processing techniques for the generation of arbitrary mechanical displacements of microseconds range in dispersive waveguides. The proposed parameter is used for the comparison of techniques. The new arbitrary signal generation techniques are introduced and analyzed, and the arbitrary signal duration optimization parameter is introduced. The application of these technologies allow to generate arbitrary waveform acoustic signals of the microsecond range, which are measured with an interferometer and a capacitive displacement measurement transducer.
2. Arbitrary signal generation methods
The analysis of time reversal and deconvolution based methods for arbitrary signal generation, as described in the other works, show satisfactory results under certain conditions. The time reversal method [9] can be expressed in time domain Eq. (1):
where is the calculated excitation signal sample, is the number of measured samples, is the signal sample number, is the measured waveguide response to the rectangular pulse excitation signal, considered as the transfer function.
The expression in frequency domain is given in Eq. (2):
where is a complex conjugate of waveguide transfer function .
The deconvolution-based method in frequency domain, which is described in [10], is realized according to the equation Eq. (3):
where is the excitation signal spectrum, is a constant, is the transfer function, is the complex conjugate of the transfer function, is the Fourier transform of the arbitrary signal.
Deconvolution-based methods require calculation of theoretical arbitrary signal or . The duration is limited by the transfer function’s bandwidth, which is determined by the type of a piezo-ceramic excitation actuator used, as well as the properties of the dispersive waveguide. In order to obtain the shortest possible acoustic signal, an arbitrary signal duration optimization parameter was presented. In order to calculate the optimization parameter , the set of time domain signals with the different time scale needs to be calculated:
where – number of signals, – signal index.
Signal spectrums are calculated according to Eq. (5):
When spectrums of are known, possible and spectrum overlappings are calculated according to Eq. (6):
where , , – numbers representing spectrum overlapping.
The minimal value of the parameter represents the optimum overlapping of the spectrums and . This parameter is obtained using the signal index Eq. (6), which then can be used for calculation of arbitrary signal Eq. (8):
The signal , calculated using the index , obtained from Eq. (7), represents the shortest possible signal duration in the system with the transfer function .
Since the ratio of the average and minimal value of can be in range of 60 dB, the division from causes problems in the fragments of the signal where the value of is relatively small. Moreover, some values of can be equal to zero and therefore, an unwanted signal spectrum noise can be induced.
Because of the limited resolution of the digital to analog converter and a limited excitation signal amplitude, the measured signal is different compared to the calculated signal . The main components of signal error are waveform distortions, signal duration deviations and noise.
A constant , which is added to in Eq. (3), was introduced as a solution for the noise generation problem. It solves the problem of division from values of equal to zero, but cannot completely solve the problem of big differences between the minimal and the average values. Therefore, the modified deconvolution Eq. (9) allows eliminating both of the issues:
where is a window function, , – 1,..., , number must be chosen according to the resulting value of Eq. (11).
Another solution developed during the research is the correction of spectrum samples amplitude based on the limit coefficient Eq. (10). The solution can be used alongside deconvolution or time reversal mirror methods:
where is the excitation signal spectrum frequency sample, , is the limit coefficient.
3. Arbitrary acoustic signal evaluation criteria
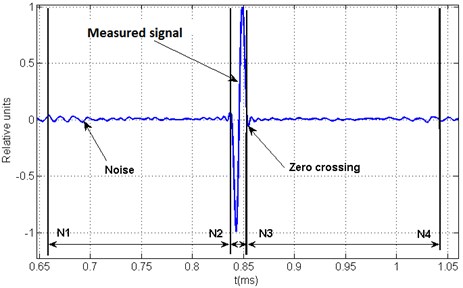
Methods for compensation of the dispersion in waveguides [2-8] do not present a criteria which would allow the evaluation of generated acoustic signal. Since the noise is induced using any dispersion compensation method, the acoustic signal evaluation criteria must reflect the ratio between the signal and the noise amplitudes. The three time windows that were proposed to be used for the acoustic signal evaluation are presented in Fig. 1.
Time windows - and - represent an interval where there is no signal and measured signal amplitude should be close to zero. Practically, there is always noise which is caused by the measurement equipment or the dispersion compensation method.
The time window - represents the arbitrary acoustic signal duration. Window selection, which is recommended in this paper and is used practically, was based on the signal zero crossings.
Fig. 1Time windows for arbitrary acoustic signal evaluation
Evaluation of the acoustic signal generation method is performed using a dimensionless parameter , which is related to the signal quality and is calculated according to Eq. (11):
where is a quality coefficient, , , , are sample numbers, is the signal sample.
The parameter was chosen as a ratio between average signal square values ratio at a sample range - and a noise in sample range - and -. Time windows selection depends on the arbitrary acoustic signal application requirements
4. Arbitrary acoustic signal generation equipment
The experimental research was performed using the equipment for the arbitrary acoustic signal generation techniques and their applications. The equipment connection diagram is presented in Fig. 2.
Fig. 2The block diagram of equipment connections
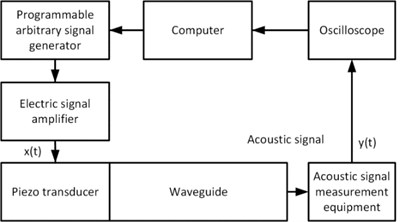
The acoustic signal measurement was performed using a Polytech OFV-512 interferometer (sensitivity 2 V/μm, speed sensitivity 5 mm/s/V). The electric signal from the acoustic signal measurement equipment was fed to the “Gwinstek” GDS-1052-U oscilloscope. The calculated excitation signal was generated using a “Tectronic” AFG3000C arbitrary signal generator and an EPA-104 linear piezo amplifier.
The piezo transducer was excited using a signal from the arbitrary waveform generator attached at the end of the steel bar, several of which were used in a variety of diameters. Measurements of the generated arbitrary waveform mechanical displacements were performed at the other end of the bar, where the exposed circular cross section of the waveguide allows calibrating the AET under load conditions.
5. Experimental results
According to the block diagram presented in the Fig. 2, the experiment data was acquired the waveguide impulse response characteristic was measured applying 10 V, 1 µs electrical pulse to the piezo transducers attached to the waveguides, an interferometer was used for the measurements of the mechanical displacements in the zone of waveguide aperture.
Fig. 3Impulse response of dispersive acoustic waveguides
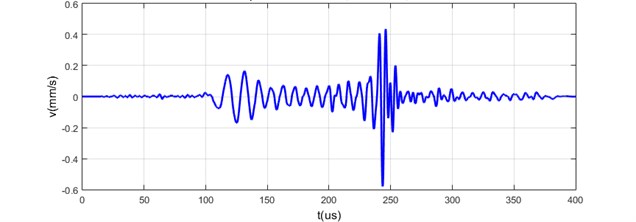
a) Measured on 24 mm diameter and 600 mm length steel bar

b) Measured on 24 mm diameter and 300 mm length steel bar
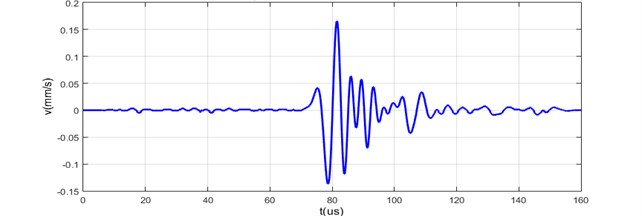
c) Measured on 5 mm diameter and 300 mm length brass bar
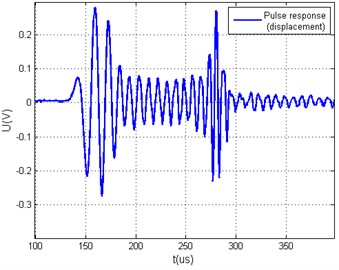
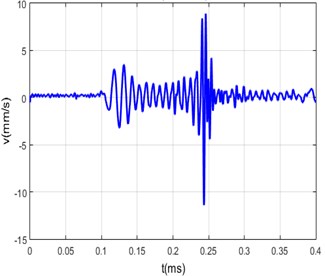
Arbitrary acoustic signal generation methods were evaluated by generating sinc square pulse acoustic signal at the end of the waveguide and using different excitation signal calculation algorithms. The 24 mm diameter and 600 mm long steel bar was chosen as a waveguide. Capacitive transducer was used for measurements that are directly proportional to the mechanical displacement. The acquired results are expressed in voltage units and presented in Fig. 4, Fig. 5 and Fig. 6. Measurement results are presented in Fig. 7.
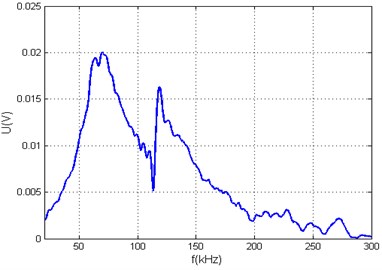
Piezo transducer attached to the waveguide was excited with 10 V and 1 µs signal. The measured impulse response is presented in Fig. 7(a) and calculated transfer function is illustrated in Fig. 7(c).
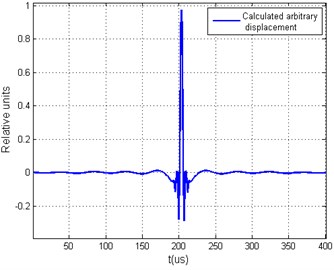
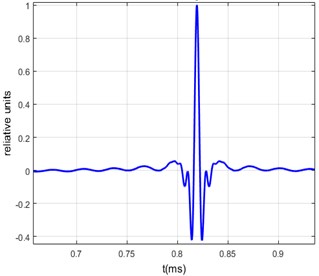
Arbitrary signal generation methods were compared by calculating the parameter , according to Eq. (11). The maximum theoretical value of the parameter for the chosen arbitrary acoustic signal was equal to 75.615. The value of the was calculated using theoretical signal presented in Fig. 4(b).
Arbitrary acoustic signal was generated in two cases. In one case the minimal and average ratio of values (MAR) did not exceed 20 dB as it is presented in Fig. 6. In another case, the MAR in frequency range from 0 kHz to 5 kHz exceeded 60 dB as shown in Fig. 5.
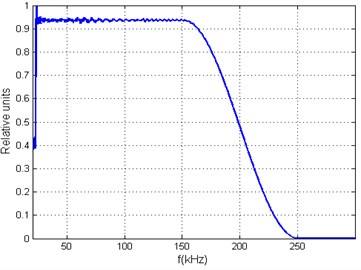
Fig. 4a) Measured waveguides impulse response signal, b) calculated theoretical arbitrary acoustic signal and parameter Q= 75.615, c) calculated transfer function signal spectrum, d) calculated theoretical arbitrary acoustic signal spectrum
a)
b)
c)
d)
Fig. 5Measured arbitrary acoustic signals yt and the calculated value Q using different xt calculation algorithms when ratio of hω minimal and average values are in the range of 60 dB: a) generated arbitrary signal yt using deconvolution method and its yω, b) generated arbitrary signal yt using deconvolution and limit coefficient methods and its spectrum yω, c) generated arbitrary signal yt using modified deconvolution method, d) generated arbitrary signal yt using modified deconvolution and limit coefficient methods
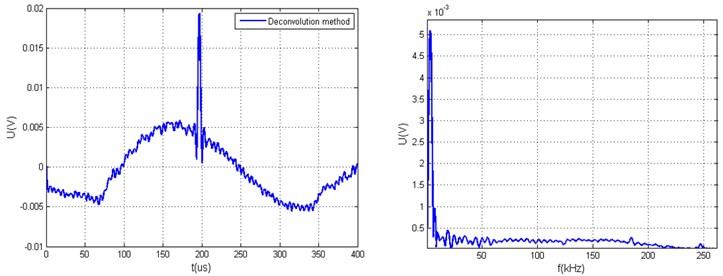
a)9.3926
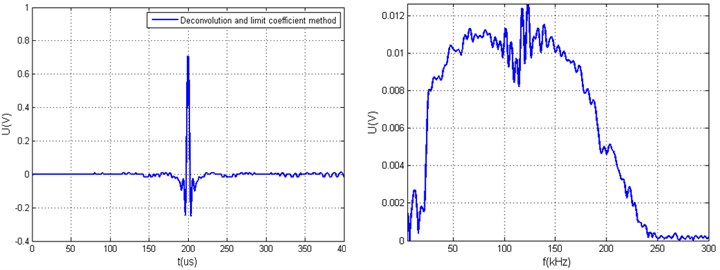
b)61.1501
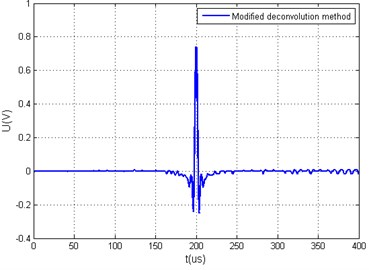
c) 65.8665
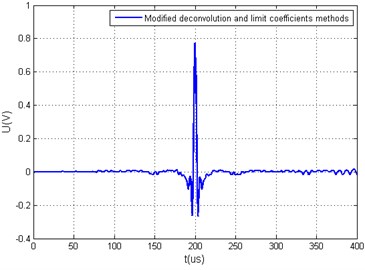
d)63.213
Fig. 6Measured arbitrary acoustic signals yt and the calculated value Q using different xt calculation algorithms, when ratio of hω minimal and average values is smaller than 20 dB, a) generated arbitrary signal yt using time reversal method and its spectrum yω, b) generated arbitrary signal yt using time reversal and limit coefficient methods and its spectrum yω c) generated arbitrary signal yt using deconvolution method, d) generated arbitrary signal yt using deconvolution and limit coefficient methods, e) generated arbitrary signal yt using modified deconvolution method, f) generated arbitrary signal yt using modified deconvolution and limit coefficient methods

a)21.8048

b)42.1036
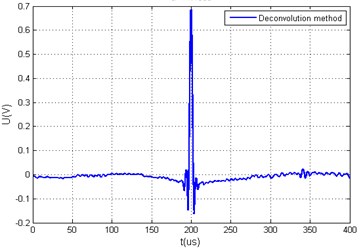
c) 71.1868
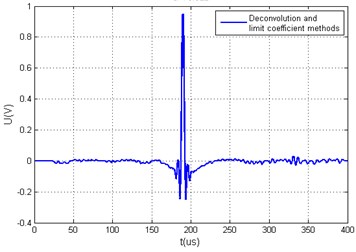
d)70.622
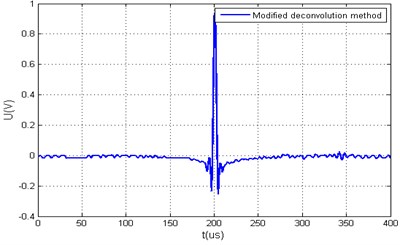
e) 68.2096
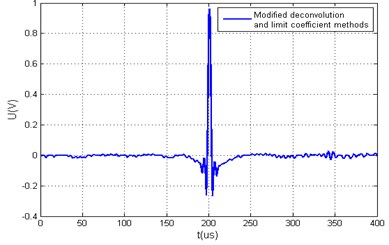
f) 86.2757
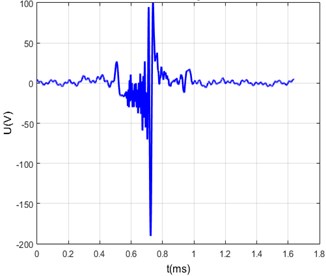
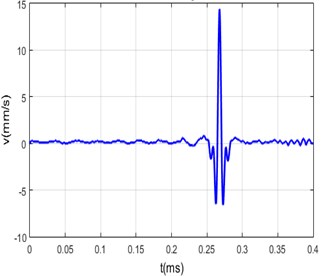
Since the squared function signal was generated on the 24 mm diameter and 600 mm length steel bar waveguide using modified deconvolution and limit coefficients method. The measurements were performed using the interferometer and are presented in Fig. 7.
6. Conclusions
Disadvantages of the time reversal method (Fig. 6) were proven by the research results. This method generates a high noise levels compared to deconvolution methods, as proven by the values of the parameter and measurement results, and has a limited signal waveform manipulation possibilities.
The possible arbitrary acoustic signal waveforms are influenced by the transfer function bandwidth. The usable bandwidth of can be evaluated using the proposed parameter in Eq. (6) and Eq. (7).
The advantages of the proposed deconvolution method and the limit coefficients method can be seen when the ratio between average and mean values reached 60 dB. Otherwise, when the ratio did not exceed 20 dB, the results obtained with the deconvolution-based methods yielded similar results.
Fig. 7a) Measured transfer function of the steel bar, b) excitation signal fed to the piezo-transducer, c) measured arbitrary signal, d) calculated arbitrary signal
a)
b)
c)
d)
References
-
ASTM Standard E1106-86: Standard Method for Primary Calibration of Acoustic Emission Sensors. Philadelphia, 1986.
-
ISO 12713: 1998(E) Non-Destructive Testing – Acoustic Emission Inspection – Primary Calibration of Transducers, 1998.
-
Kahlon N. H., Kaur G. Various dispersion compensation techniques for optical systems: a survey. Open Journal of Communications and Software, Vol. 1, Issue 1, 2014, p. 64-73.
-
Gangadharan R., Murthy C. R. L., Gopalakrishnan S., Bhat M. R. Time reversal health monitoring of composite structure using Lamb waves. American Institute of Aeronautics and Astronautics, 2009, p. 1-7.
-
Hayashi T., Won Joo Song, Rose J. L. Guided waves dispersion curves for bar with an arbitrary cross section, a rod and rail example. Ultrasonics, Vol. 41, 2003, p. 175-183.
-
Cobo P., Ranz C., Fernandez A., Cuesta M., Anthony D. K., Siguero M. Waveform shaping of sonar transducers for improving the vertical resolution in sub-bottom sediments profiling. Journal of Marine Geography Research, 2005, p. 87-95.
-
Kuperman W. A., Hodgkiss W. S., Akal T., Kim S., Edelmann G., Song H. C. Time reversal acoustics. Journal of Acoustic, 2000, p. 1-6.
-
Fink M., Prada C. Acoustic time reversal mirrors. Institute of Physics Publishing, Inverse Problems, Vol. 17, 2001, p. 1-38.
-
Watkins R., Jha R. A modified time reversal method for lamb wave based diagnostics of composite structures. Journal Mechanical Systems and Signal Processing, Vol. 31, 2012, p. 345-354.
-
Cobo P. Application of shaping deconvolution to the generation of arbitrary acoustic pulses with conventional sonar transducers. Journal of Sound and Vibration, Vol. 188, Issue 1, 1995, p. 131-144.
-
Swincer P., Nguyen B., Wood S. Method for the generation of broadband acoustic signals. Proceedings of Acoustics, Fremantle, Vols. 21-23, 2012, p. 1-8.
About this article
This research was supported by the European Social Fund and National budget of the Republic of Lithuania with the help of the Agency for Science, Innovation and Technology (MITA) under the project No. VP 1-3.1-ŠMM-06-V-01-003.
