Abstract
In a micro resonant gas sensor, the electrostatic excitation is used widely. For a micro resonant gas sensor with electrostatic excitation, four physical fields are involved. In this paper, for the micro resonant gas sensor, the four-field coupled dynamics equation is proposed. It includes mechanical force field, chemical density field, electrostatic force field, and the van der Waals force field. Using the method of multiple scales, the coupled dynamics equation is resolved. The effects of the four physical fields on the natural frequencies for the micro resonant gas sensor are investigated. Results show that the effects of the Van der Waals force on the natural frequencies of the micro resonant gas sensor depend on the mechanical parameters and the bias voltages; the sensitivity of the natural frequencies to the gas adsorption depends on the mechanical parameters, the bias voltages, and the Van der Waals force.
1. Introduction
The micro sensors are especially suitable for the fields such as aviation, space flight, weapon, automobile, biological engineering and medical treatment, etc. [1]. The resonant sensor outputs frequency signal which is suitable for the distant range transmission. The micro resonant sensors can be used as pressure sensors, acceleration sensors, gas sensors and biological sensors [2, 3].
A resonant gas testing system with heat exciting integrated on a chip was developed where Wheatstone bridge at the cantilever root was used to measure the cantilever vibration [4]. A resonant sensor for measuring volatile organic waste gas with piezoelectric excitation was designed and its detection accuracy to alcohol is 14×10-6 [5]. A low power loss resonant gas sensor with capacity measuring was produced and its detection accuracy to toluene gets to 50×10-6 [6]. The arrays of resonating microcantilevers were developed to perform the quantitative mass-binding measurements of the bacterial virus T5 at subpicomolar concentrations [7]. A chemical sensor resonant in-plane was proposed to reduce viscosity damping of the micro cantilever sensor in liquid and its quality factor was increased [8].
In a word, a number of studies were done for the micro resonant chemical sensors. However, a micro resonant gas sensor is in an environment of the coupled multi-physical fields. The dynamics performance of the micro resonant sensor under the coupled fields decides on its operation behavior. Therefore, a mechanical-chemical coupled dynamics equation was proposed and the time frequency property of the resonant cantilever during the gas adsorption reaction was predicted [9].
In a micro resonant gas sensor, the electrostatic excitation is used widely. For a micro resonant gas sensor with electrostatic excitation, four physical fields are involved. It is the four-field coupled dynamics problem including mechanical force field, chemical density field, electrostatic force field, and the van der Waals force field.
In this paper, for the micro resonant gas sensor, the four-field coupled dynamics equation is proposed. It includes mechanical force field, chemical density field, electrostatic force field, and the van der Waals force field. Using the method of multiple scales, the coupled dynamics equation is resolved. The effects of the four physical fields on the natural frequencies for the micro resonant gas sensor are investigated. A number of the results are obtained.
2. Coupled dynamics equation of the micro resonant gas sensor
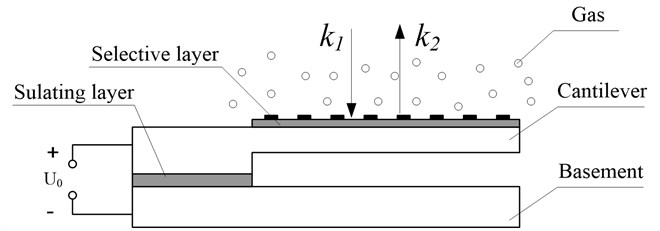
As shown in Fig. 1, a micro resonant gas sensor includes a resonant cantilever beam plus a basement. The micro beam is fixed on the basement. The gas sensitive material is coated onto the beam. Upon exposure to some kind of the vapor, the mass of the resonant beam increases due to the absorption of the gas molecules. It causes decrease of the resonant frequency of the cantilever beam. Besides it, the electrostatic force and the van der Waals force is also applied to the beam. This is a four-field coupled dynamics problem including mechanical force field, chemical density field, electrostatic force field, and the van der Waals force field.
The dynamics equation of the resonant cantilever is:
where is transverse displacement of the beam, is length coordinate of the beam, is time, is material density per unit length of the beam and the sensitive coating, is modulus of elasticity of the beam material, , it is the second moment of area of the beam, is the effective width of the beam, is the thickness of the beam, is the load per unit length on the beam.
Fig. 1Micro resonant gas sensor model
The load includes the electrostatic force and the van der Waals force. The electrostatic force per unit area is:
where is permittivity constant of free space, is relative dielectric constant of the insulating layer, is the initial clearance between the beam and fixed plate, is the voltage applied to the beam.
The van der Waals force per unit area between the beam and base plate is:
where is the Hamaker constant, 10-19.
Thus, the total force per unit area on the beam is:
The displacement y of the micro beam consists of a static component and a dynamic one :
The load of static () and dynamic () components as well:
where is the static bias voltage applied to the beam.
From , ones know:
The kinetic equation of the adsorption reaction between coatings and the measured gas can be described by:
where is density of the measured gas, it is constant under a given condition; is density of the sensitive coating, its initial value is ; is density of the adsorption assembly of the gas and the sensitive coating, its initial value is zero, is binding rate constant of the gas to the sensitive coating, and is dissociation rate constant of the gas from the sensitive coating.
The sum of the sensitive coating density adsorbing gas and the sensitive coating density without gas is constant (it equals to ), then:
Substituting Eq. (10) into (9), yields:
where is density of the adsorption assembly of the gas and the sensitive coating per unit length, , , , is section area of the sensitive coating, , is thickness of the sensitive coating.
Material density per unit length of the beam and the sensitive coating can be calculated as:
where is material density per unit length of the beam (it is constant).
Substitution Eqs. (4), (5), (7), (8), and (12) into Eq. (1), yields:
From Eq. (13), we obtain:
From Eq. (14), the static displacement of the beam can be given. Combining Eq. (15) with (11), the coupled dynamics equations of the micro resonant gas sensor are obtained.
3. Solution of the dynamics equation
Let , and substituting it into Eq. (15), yields:
where .
Thus, the solution of the first equation of Eq. (16) can be given by:
where constants are obtained by the boundary conditions of the beam.
Substituting Eq. (17) into (16), yields:
From Eq. (18), the solutions of the variable can be obtained. Thus, natural frequencies of the micro beam can be given:
From Eqs. (11) and (12), ones obtain:
The function can be written in power series form at 0. Letting and neglecting high order terms, ones obtain:
Letting:
Thus, the solution of the second equation of Eq. (16) can be written as:
Taking 2 in Eq. (23), ones obtain:
Substituting Eqs. (21) and (24) into the second equation of Eq. (16), letting sum of the coefficients with the same order power of the parameter equal zero, following equations can be given:
The solution of zero order equation can be given as:
where is the unknown function of complex variable, is its conjugate complex.
Substituting Eq. (26) into (25), yields:
where:
The function can be written as:
where and are the real functions of the time .
Substituting Eq. (30) into (29), yields:
where:
and , are the undetermined coefficients determined from the initial conditions.
Then:
Substituting Eqs. (26), (27), (28), and (33) into Eq. (24), yields:
Using Hilbert transform, the time frequency property of the gas sensor can be obtained:
where:
4. Results and discussion
Equations in the paper are utilized for the analysis of the effects of the four physical fields on natural frequencies of the micro gas sensor. Fig. 2 gives the effects of the van der Waals force on the natural frequencies of the micro gas sensor for various mechanical parameters (here, is the difference between the natural frequencies with/without the consideration of Van der Waals force). Results show:
1) With the consideration of Van der Waals force, the natural frequencies of the micro gas sensor are less than those without Van der Waals force. The difference between them increases significantly with increasing the beam length. As the length of the cantilever beam increases from 1 mm to 2 mm, changes of the resonant frequency of the cantilever beam caused by Van der Waals force increase from about 1000 rad/s to 3300 rad/s. It shows that effects of the Van der Waals force on the natural frequencies of the sensor increase when the beam length is increased. As the mode order number increases, the effects of the Van der Waals force on the natural frequencies of the sensor decrease obviously. For modes 1 and 2, changes of the resonant frequency of the cantilever beam caused by Van der Waals force are 3300 rad/s and 500 rad/s, respectively.
2) As thickness of the cantilever beam increases, changes of the resonant frequency of the cantilever beam caused by Van der Waals force first increase, get to a maximum value at some beam thickness, and then decrease. For mode 1, the maximum value corresponds to a larger beam thickness. It shows that the beam thickness has obvious effects on the changes of the first resonant frequency of the cantilever beam caused by Van der Waals in a larger thickness range. As the mode order number increases, the beam thickness corresponding to the maximum value decreases significantly, but the maximum frequency changes increase significantly. For modes 1 and 2, the beam thickness corresponding to the maximum value the beam thickness corresponding to the maximum value is about 10 μm and 5 μm, respectively, and the maximum frequency changes are about 18000 rad/s and 32000 rad/s, respectively. It shows that the beam thickness has obvious effects on the changes of the resonant frequency higher than order 2 of the cantilever beam caused by Van der Waals in a smaller thickness range, but the effects are more obvious than that for mode 1.
3) As thickness h1 of the sensitive coating on the cantilever beam grows, changes of the resonant frequency of the cantilever beam caused by Van der Waals decrease gradually. As the thickness of the sensitive coating increases from 0 to 10 μm, changes of the first resonant frequency of the cantilever beam caused by Van der Waals force decrease from about 3300 rad/s to 2800 rad/s. It shows that effects of the Van der Waals force on the natural frequencies of the micro sensor decrease when the thickness is increased. For modes 1 and 2, changes of the resonant frequency of the cantilever beam caused by Van der Waals force are about 300 rad/s and 100 rad/s, respectively at a thickness of 10 μm. It shows that thickness h1 of the sensitive coating has more obvious effects on the changes of the resonant frequency of the cantilever beam caused by Van der Waals for the first mode than those for the higher order modes.
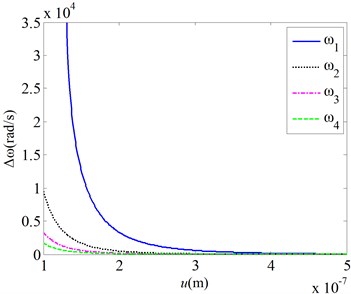
4) As the clearance between the cantilever beam and the base plate increases, changes of the resonant frequency of the cantilever beam caused by Van der Waals first decrease rapidly, and then decrease gradually. When the clearance is smaller than 0.2 μm, changes of the resonant frequency of the cantilever beam caused by Van der Waals force are obvious. Above 0.2 μm, changes of the resonant frequency of the cantilever beam caused by Van der Waals little change. As same as above, the clearance between the cantilever beam and the base plate has more obvious effects on the changes of the resonant frequency of the cantilever beam caused by Van der Waals for the first mode than those for the higher order modes.
Fig. 2Effects of the van der Waals force on the natural frequencies for various mechanical parameters
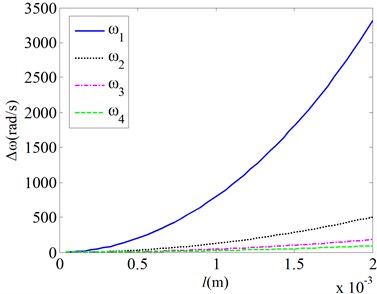
a) Length changes
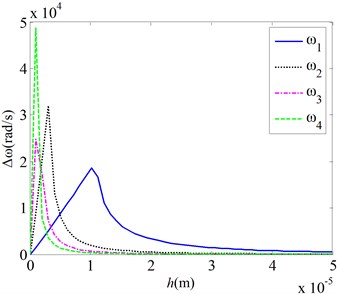
b) Thickness changes
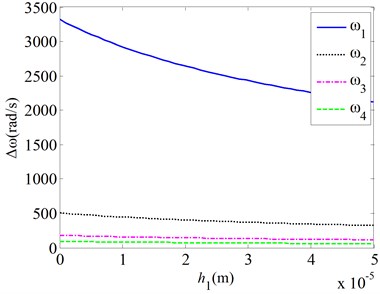
c) Thickness changes
d) Clearance changes
In a word, the effects of the Van der Waals force on the natural frequencies of the micro resonant gas sensor increase when the beam length is increased, or the thickness of the sensitive coating and the clearance between the cantilever beam and the base plate is decreased. As thickness of the cantilever beam increases, changes of the resonant frequency of the cantilever beam caused by Van der Waals force first increase, get to a maximum value at some beam thickness, and then decrease.
Fig. 3 gives the effects of the van der Waals force on the natural frequencies of the micro gas sensor for various bias voltages. Results show:
As the bias voltage applied to cantilever beam increases, changes of the resonant frequency of the cantilever beam caused by Van der Waals first increase gradually, and then increase rapidly. For this given parameters, changes of the resonant frequency of the cantilever beam caused by Van der Waals are relatively small when the bias voltage is smaller than 4 V. Above 4 V, changes of the resonant frequency become quite obvious. As same as above, the bias voltage has more obvious effects on the changes of the resonant frequency of the cantilever beam caused by Van der Waals for the first mode than those for the higher order modes.
Fig. 3Effects of the van der Waals force on the natural frequencies for various bias voltages
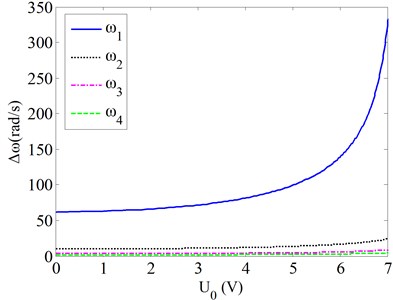
a) Modes 1-4
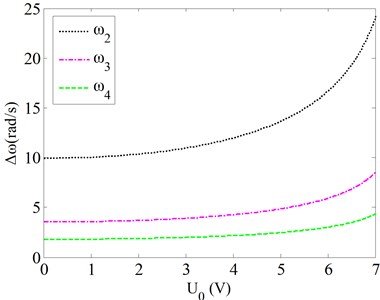
b) Modes 2-4
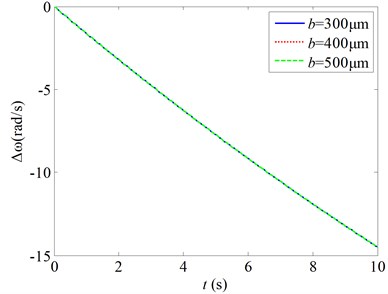
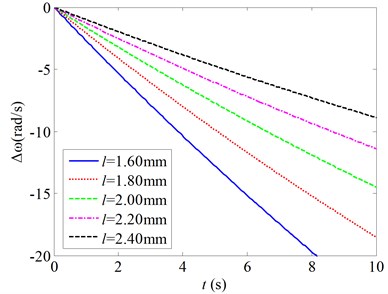
Fig. 4 gives the changes of the natural frequencies of the micro gas sensor as a function of the time for various mechanical parameters ( is the changes of the natural frequencies of the micro gas sensor when the mass of the resonant beam increases due to the absorption of the gas molecules). Here, the clearance between the beam and the basement is taken to be 5 μm, so that the effects of the Van der Waals force on the natural frequencies can be neglected. Thus, it can show the effects of the mechanical parameters on the relationship between the natural frequencies and the gas density. It shows:
1) As the time grows, the resonant frequency of the cantilever beam drops. It is because gas adsorption on the sensitive coating causes increase of the cantilever beam mass which reduces resonant frequency of the cantilever beam. When the gas density is given, the slope of the line is determined. The slope can show the relationship between the natural frequencies and the gas density.
2) As the width of the cantilever beam changes, the line slope of the resonant frequency of the cantilever beam is nearly not variable. It shows that the width of the cantilever beam has not effects on relationship between the natural frequencies and the gas density.
3) As the length of the cantilever beam drops, the slopes of the decrease lines of the resonant frequency of the cantilever beam become more obvious. As the length of the cantilever beam reduces from 2.4 mm to 1.8 mm, the slope of the decrease lines of the resonant frequency increases by nearly two times. So, the sensitivity of the beam to the gas adsorption is better for a smaller beam length.
4) As thickness of the cantilever beam increases, the slopes of the decrease lines of the resonant frequency of the cantilever beam become large. It shows that the sensitivity of the beam to the gas adsorption is better for a larger beam thickness.
5) As thickness of the sensitive coating on the cantilever beam grows, slopes of the decrease lines of the resonant frequency of the cantilever beam become large as well. As the thickness of the sensitive coating increases from 100 nm to 200 nm, the slope of the decrease lines of the resonant frequency increases by nearly two times. So, the sensitivity of the beam to the gas adsorption is nearly proportional to the thickness of the sensitive coating on the cantilever beam.
In a word, the width of the cantilever beam has not effects on relationship between the natural frequencies and the gas density. The sensitivity of the natural frequencies to the gas adsorption is better for a smaller beam length, or a larger beam thickness. The sensitivity is nearly proportional to the thickness of the sensitive coating.
Fig. 4Changes of the natural frequencies as a function of the time for various mechanical parameters
a) changes
b) changes
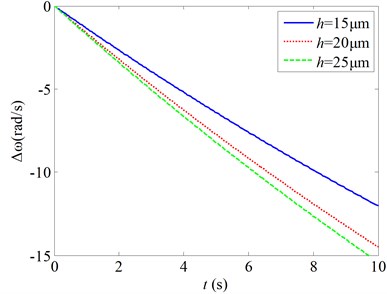
c) changes
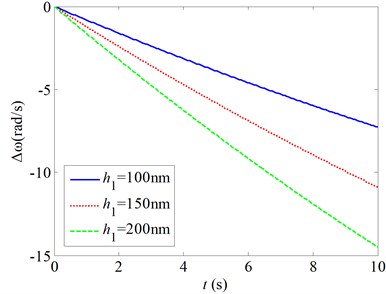
d) changes
Fig. 5 gives the changes of the natural frequencies of the micro gas sensor as a function of the time for various clearances between the cantilever beam and the basement ( is the changes of the natural frequencies of the micro gas sensor due to the absorption of the gas molecules). Here, the clearance between the beam and the basement is taken to be smaller than 1 μm so that the effects of the Van der Waals force on the natural frequencies are enough strong. Thus, it can show the effects of the Van der Waals force on the relationship between the natural frequencies and the gas density. Fig. 5 shows:
As the clearance between the cantilever beam and the basement drops, the slopes of the decrease lines of the resonant frequency of the cantilever beam become small. As the clearance is larger than 0.3 μm, the slope of the decrease lines of the resonant frequency little changes along with the clearances. As the clearance is less than 0.3 μm, the slope of the decrease lines of the resonant frequency changes significantly along with the clearances. So, the Van der Waals force has more significant effects on the relationship between the natural frequencies and the gas density for the clearance less than 0.3 μm than those for the relatively large clearance.
Fig. 5Changes of the natural frequencies as a function of the time for various clearances
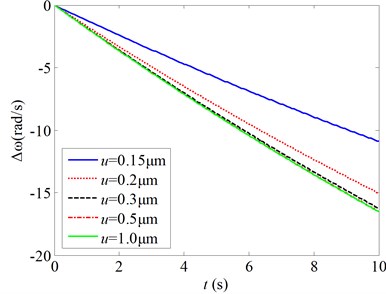
Fig. 6Changes of the natural frequencies as a function of the time for various bias voltages
a) Mode 1
b) Mode 2
c) Mode 3
d) Mode 4
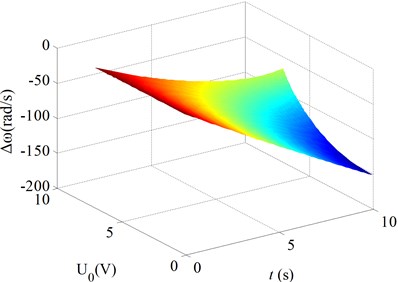
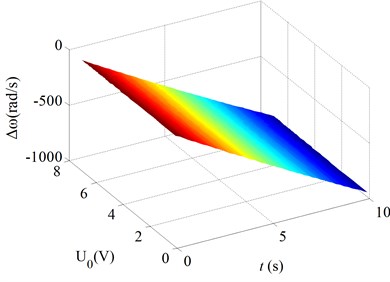
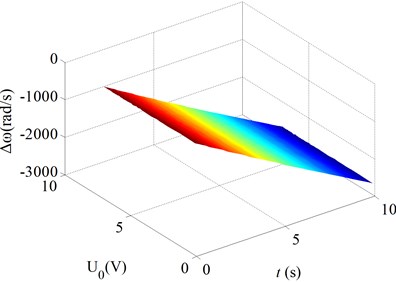
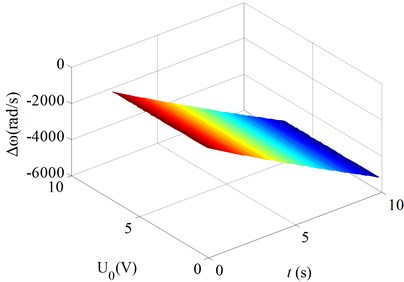
Fig. 6 gives the changes of the natural frequencies of the micro gas sensor as a function of the time for various bias voltages ( is the changes of the natural frequencies of the micro gas sensor due to the absorption of the gas molecules). Here, the clearance between the beam and the basement is taken to be 5 μm so that the effects of the Van der Waals force on the natural frequencies can be neglected. Thus, it can show the effects of the bias voltages on the relationship between the natural frequencies and the gas density. Fig. 6 shows:
As the bias voltage on the cantilever beam drops, the slopes of the decrease lines of the resonant frequency of the cantilever beam become large. For mode 1, the slopes of the decrease lines of the resonant frequency of the cantilever beam increase significantly with decreasing the bias voltage. For modes 2-4, the slopes of the decrease the slopes of the decrease little increase with decreasing the bias voltage. So, the bias voltage has more significant effects on the relationship between the natural frequencies and the gas density for the mode one.
It should be noticed that the sentivity of the natural frequencies of the micro gas sensor to the absorption of the gas molecules is more significant for the higher order modes. For instance, for mode 1, the decrease of the natural frequency is about 150 rad/s at 10 s; and for mode 4, the decrease of the natural frequency is about 5500 rad/s at 10 s.
In order to validate the analysis in this paper, the authors have compared the calculative value of the equation in this paper with the experimental results. The micro cantilever in the micro gas sensor and its measuring system are shown in Fig. 7. The micro gas sensor consists of a Si cantilever and Phthalocyanine copper layer. Parameters of the micro gas sensor are shown in Table 1.
Fig. 7Micro resonant gas sensor and its test system
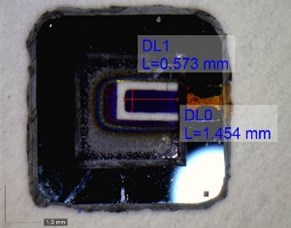
a) Cantilever
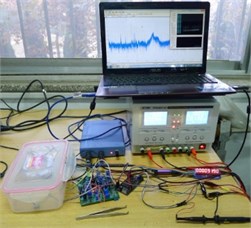
b) Test system
Table 1Parameters of the micro sensor
(mm) | (mm) | (μm) | (μm) | (GPa) | (kg/m3) |
1.454 | 0.573 | 22 | 0.2 | 190 | 2330 |
As shown in Fig. 7, the gas sensor consists of a basement and a resonant cantilever beam. The micro resonant cantilever beam is fixed on the basement. A Phthalocyanine copper layer is coated onto the cantilever beam. Upon exposure to a vapor, the mass of the resonant cantilever beam changes due to the absorption of analyte molecules. It makes resonant frequency of the cantilever beam decrease. By means of measuring the frequency shift of the resonant cantilever during gas adsorption reaction, the kind of the gas can be determined.
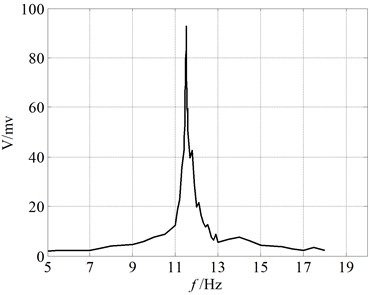
The resonant frequency and open-looped -factor of the micro resonant gas sensor are measured with above-mentioned measuring system. The open loop test results are given in Fig. 8. It shows that the resonant frequency of the gas sensor is about 11.522 kHz in air and the quality factor is 144. A high stability of the measured resonant frequency is obtained (here, the mean square error is 0.066 Hz).
Fig. 8Open loop test results
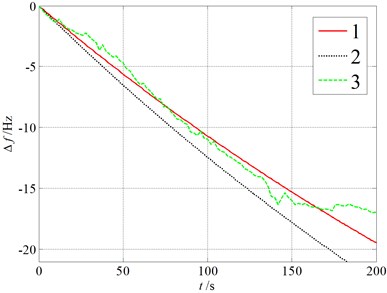
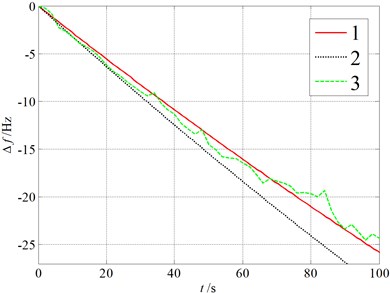
In order to obtain the sensor sensitivity to , the resonant frequency shift is measured when exposed to . The concentration of is controlled by adjusting quantity passing into an airtight container in which the sensor is placed. Here, an air valve is used to adjust the vapor quantity, and an concentration meter is used to monitor the vapor concentration. Fig. 9 gives the real-time resonant frequencies for an exposure of three different densities of . Here, line 1 is the calculated results with the consideration of Van der Waals force, line 2 is the calculated results without the consideration of Van der Waals force, line 3 is the experimental results. It shows that the resonant frequency drops about 2.5 Hz due to the diffusion of into the Phthalocyanine copper layer for 6.2 ppm . The results show that the detection accuracy to using the sensor is about 2.5 ppm per Hz shift. The results also show that the test results are consistent with the calculative values with the consideration of Van der Waals force for three different concentrations. It illustrates analytical results in the paper.
Fig. 9Real-time resonant frequencies
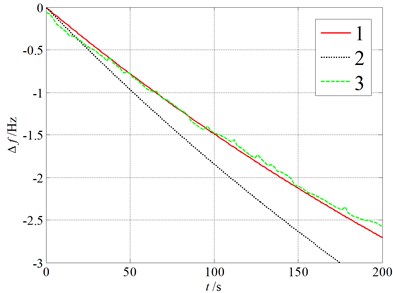
a) 6.2 ppm
b) 29.2 ppm
c) 41 ppm
The calculating errors of the model depend on three equations written in power series. They are the equations of the electrostatic force, the Van der Waals force, and the ratio between the initial density and the instantaneous density. The first two errors depend on the ratio of the vibrating amplitude of the micro beam to the initial clearance between the beam and base plate. The vibrating amplitude of the micro beam can be controlled by the amplitude of the voltage applied to the micro beam. By limiting applied voltage, the sensor is ensured to operate in linear operating range. So, the relative errors of the electrostatic force and the Van der Waals force in the study are quite small and can be neglected.
Thus, the calculating error of the model depends on the error of the ratio . The accuracy and approximate values of the ratio are shown in Fig. 10. Here, the accuracy values are calculated from Eq. (20), and the approximate values are calculated from Eq. (21) in which term number in power series is taken as three and four, respectively. Fig. 10 shows that the error mainly depends on the measuring time. The approximate values are in good agreement with the accuracy values when the time is smaller than 800 seconds for 4, and they are in good agreement with each other when the time is smaller than 500 s for 3. In our test, the measuring time is 200 s and 100 s, respectively. So, our calculating is in the credible time range.
Fig. 10Comparison of the accuracy and approximate values for the ratio ρl0/ρl(t)
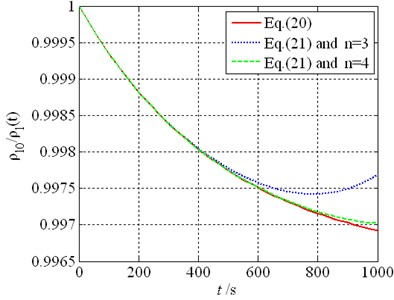
a) 4 ppm
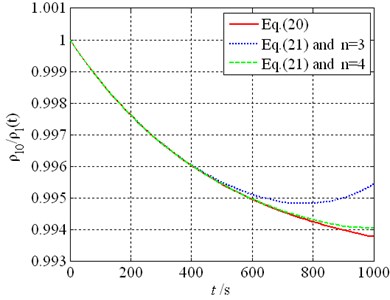
b) 8 ppm
5. Conclusions
In this paper, for the micro resonant gas sensor, the four-field coupled dynamics equation is proposed. It includes mechanical force field, chemical density field, electrostatic force field, and the van der Waals force field. Using the method of multiple scales, the coupled dynamics equation is resolved. The effects of the four physical fields on the natural frequencies for the micro resonant gas sensor are investigated. Results show:
1) The effects of the Van der Waals force on the natural frequencies of the micro resonant gas sensor increase when the beam length increases, or the thickness of the sensitive coating and the clearance between the cantilever beam and the base plate decreases. As beam thickness increases, changes of the resonant frequency of the beam caused by Van der Waals force first increase, get to a maximum value at some thickness, and then decrease.
2) As the bias voltage applied to the beam increases, changes of the resonant frequency of the beam caused by Van der Waals first increase gradually and then rapidly.
3) The sensitivity of the natural frequencies to the gas adsorption is better for a smaller beam length, or a larger beam thickness. The sensitivity is nearly proportional to the thickness of the sensitive coating.
4) The Van der Waals force has more significant effects on the relationship between the natural frequencies and the gas density for the clearance less than 0.3 μm. The bias voltage has more significant effects on the relationship between the natural frequencies and the gas density for mode one.
References
-
Lavrik N. Cantilever transducers as a platform for chemical and biological sensors. Review of Scientific Instruments, Vol. 75, Issue 7, 2004, p. 2229-2253.
-
Gerhard M., Sebastian B., Sumit P. Novel chemical sensor applications in commercial aircraft. Procedia Engineering, Vol. 25, 2011, p. 16-22.
-
Michihiro H. Realtime analysis of ligand induced cell surface and intracellular reaction of living mast cells using a surface plasm on resonance based biosensor. Analytical Biochemistry, Vol. 302, Issue 1, 2002, p. 28-37.
-
Lange D., Gleitner A., Ierlem A. Complementary metal oxide semiconductor cantilever arrays on a single chip: mass-sensitive detection of volatile organic compounds. Analytical Chemistry, Vol. 74, 2002, p. 3084-3095.
-
Fadel L., Lochon F., Du F. Chemical sensing: millimeter size resonant microcantilever performance. Journal of Micromechanics and Microengineering, Vol. 14, 2004, p. 23-30.
-
Amirola J., Rodriguez A., Castaner L. Micromachined silicon microcantilevers for gas sensing applications with capacitive readout. Sensors and Actuators B, Vol. 111, 2005, p. 247-253.
-
Thomas B., Murali K., Natalija B. Quantitative time-resolved measurement of membrane protein-ligand interactions using microcantilever array sensors. Nature Nanotechnology, Vol. 4, Issue 3, 2009, p. 179-185.
-
Tao Y., Li X., Xu T. Resonant cantilever sensors operated in a high-Q in-plane mode for real-time bio/chemical detection in liquids. Sensors and Actuators B: Chemical, Vol. 157, Issue 2, 2011, p. 606-614.
-
Xu L., Yang Q. Time frequency property for a micro resonant gas sensor. AIP Advances, Vol. 3, Issue 10, 2013, p. 102-112.
About this article

This project is supported by Key Basic Research Foundation in Hebei Province of China (13961701D).
