Abstract
Mg-doped TiO2 thin ceramic films prepared using e-beam deposition were characterized by energy-dispersive X-ray spectroscopy, X-ray diffraction (XRD), and impedance spectrometer. The influence of the concentration of Mg dopant and systematic investigation of the dynamics of electronic charge carriers’ transport in the thin films are provided. The dopants concentration affected structural properties and nonlinear behaviour of electrical conductivity of the thin films. XRD analysis revealed anatase structure of TiO2 thin films with the decrease of cristallinity by increasing the concentration of Mg dopant. Total conductivity and activation energy depend on Mg concentration and the ambient temperature. The highest total conductivities 6.17E-6 S/cm and 5.50E-4 S/cm were achieved using 1.2 mol % (873 K) and 2.5 mol % (1230 K) dopant concentrations respectively. The highest relaxation frequencies and shortest relaxation times of 4.92E-02 s at 833 K and 3.48E-05 s at 1230 K temperature are obtained for the same experimental points, whereas the longest relaxation times 3.18E-01 s at 833 K and 1.21E-04 s at 1230 K temperature were estimated for 8 mol % Mg-doped TiO2 films.
1. Introduction
Titanium is the 4th most abundant metal and the 9th most abundant element in Earth’s crust [1]. Moreover, the annual production of its oxide (TiO2) exceeds 4 million tons. This is one of the reasons of its wide applications range in various fields. Most important applications are: photocatalysis, sensor elements, electronic components, water/air purification, water/air disinfection, electrochromic devices, corrosion protection, medical implants, and medicament carriers [2-6]. There are also alternative applications, such as solar cells, water splitting, and solid oxide fuel cells [7-9].
The other reason of successful TiO2 use is its properties, especially structural, optical and electrical. Titanium dioxide has three phases: rutile, anatase, and brookite. The brookite and anatase structures are thermodynamically less stable while the rutile structure is very compact and is the thermodynamically most stable phase at all temperatures [10]. Moreover, phases influence some properties of titania. Rutile has tetragonal lattice with space group P42/mnm. The density of rutile is 4240 kg/m3, band gap – 3 eV (indirect), refractive index – 2.94 and dielectric constant ~80. Anatase has tetragonal lattice with space group I41/amd [11]. The density of anatase is 3830 kg/m3, band gap – 3.2 eV (indirect), refractive index – 2.57 and dielectric constant ~12-30 [12].
In addition, the properties of TiO2, especially electrical, depend on stoichiometry, dopant type and dopant concentration. The oxygen vacancies or titanium interstitials are created due to the deficit of oxygen in titanium dioxide. In this case, type conductivity predominates in the material. Moreover, if ambient oxygen pressure decreases, type conductivity increases. In contrast, the titanium vacancies or oxygen interstitials are created if there is excess of oxygen in titanium dioxide. This implies that the type conductivity dominates. In addition, type conductivity increases, if ambient oxygen pressure increases. On the other hand, the type of the conductivity can be changed by doping TiO2. If dopants have lower valence (acceptors) than titanium, the oxygen vacancies, titanium interstitials or holes can be created [13]. The titanium vacancies, oxygen interstitials, or electrons can be created if dopants have higher valence (donors) than titanium [13]. The doped materials usually exhibit the increase in the conductivity due to creation of the oxygen vacancies and other defects which facilitate the movement of the charges. Yet the doping with high concentration of the dopants until the solid solubility is reached may reduce the conductivity due to the blocking barrier at grain boundaries introduced by the solute interfacial excess and increased grain boundary resistance [14]. Investigation of the literature revealed the lack of the information on how the electrical properties changes by doping with lower valence dopants and changing their concentration.
The change of crystallographic structure, nature of conducting carriers and dopants create nonlinear processes in the material. Nonlinear conductivity may be observed by undergoing the phase transitions from TiO2 anatase to TiO2 rutile [15]. TiO2 is also known as mixed protonic electronic conductor under the reducing atmospheres and the protonic nature of conducting species give the influence on the nonlinear processes of the conductivity [16].
The aim of this work is to determine the influence of Mg dopant concentration on the structural properties and the electric charge carriers’ behaviour of Mg-doped TiO2 thin films under reducing conditions.
2. Experimental
TiO2 and MgO powders were used as initial material. The appropriate ratios of the powders were taken and mixed in order to obtain 0.5 mol %, 1 mol %, 1.5 mol %, 2 mol %, and 2.5 mol % Mg concentration in the mixture. After that the mixtures were pressed into the pellets with mechanical press. Finally, the prepared MgxTi1-xO2 pellets were used as evaporation material during evaporation process.
Thin films were deposited on SiO2, Alloy 600, and Al2O3 substrates. The substrates were cleaned in an ultrasonic bath in pure acetone. Cleaned substrates were placed into vacuum chamber and treated with Ar+ ion plasma (10 min) before deposition.
The deposition was carried out using e-beam physical vapour deposition system (Kurt J. Lesker EB-PVD 75). The deposition rate and substrate temperature were maintained for 0.2 nm/s and at 600 °C respectively.
The structure of the deposited thin films was investigated by X-ray difractometer (Bruker D8 Discover). Measurements were carried out in 20°-70° range, using Cu Kα ( 0.154059 nm) radiation. Lattice type and crystallite size were estimated by “EVA” and “TOPAS” software, using standard Scherrer’s equation [17].
The elemental composition was measured with energy-dispersive X-ray spectroscope “Bruker XFlash QUAD 5040”.
Ionic conductivity of the deposited thin films was investigated using impedance spectrometer (NorECsAS). Measurements were carried out using two-probe method. Frequency range was 0.1-1 MHz and measurement temperature was (200-600) °C. Pt electrodes were formed on SDC thin films before the electrical measurements. Distance between the electrodes was 10 mm and size was (3×10) mm.
3. Results and discussion
The XRD investigation of nonstoichiometric MgxTi1-xO2-y thin films showed that the thin films have anatase structure type with space group I41/amd. Characteristic peaks of (101), (004), (112), (200), (105), (211), (204), and (116) orientations proved it (Fig. 1). It was also noticed that the intensities of the peaks decreased with increasing Mg molar concentration indicating that there are less diffraction planes of the particular orientation. So, crystallinity decreases with increasing Mg concentration. EDS measurements showed that molar concentrations of magnesium in thin film were 0.3 mol % ÷ 8 mol % with the lack of oxygen (11.4 mol % ÷ 14.3 mol %). The lack of oxygen can be explained by formation of titanium and magnesium interstitials and creation of oxygen vacancies.
D. Eder et al. [18] determined the increased conductivity under reducing conditions due to the enhanced mobility of the charge carriers by the presence of water. The nonlinear behaviour of the conductivity is due to inhomogeneous distributions of charge carriers. This dynamic behaviour of the charge carriers is caused by the interactions between the TiO2 lattice and the imperfections created by the Mg dopants in the formed thin films. There are two different conductivity ranges: above and below 1000 K temperature (Fig. 2). MgxTi1-xO2-y thin films exhibit increased conductivity above 1000 K because of increased -type conductivity (increased number of the electrons below the conduction band in high temperature) and increased ionic conductivity. The extrinsic conductivity dominates at low temperature range (below 1000 K) and intrinsic conductivity at high temperature range (above 1000 K). In other words, electrons jump from valence band into acceptor levels below 1000 K and from valence band into conduction band above 1000 K. Furthermore, TiO2 has phase transition point from anatase to rutile above ~900 K and Mg dopant is predicted to promote the transformation of anatase to rutile [19]. It is also known that rutile exhibits higher ionic conductivity than anatase. So, it may be the other reason of increased total conductivity. Also, the residual H2 and Mg dopants in the TiO2 lattice act as donors and increase the number of free charge carriers in the material.
Fig. 1The XRD spectra of MgxTi1-xO2 thin films (SiO2 substrate)
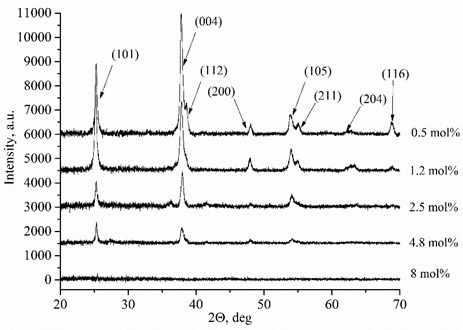
Fig. 2Arrhenius plots of Mg-doped TiO2 thin ceramic films under reducing conditions
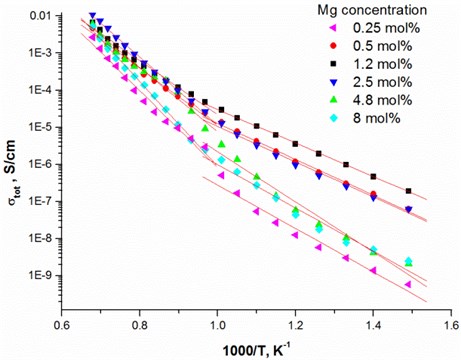
Total conductivity and activation energy depend on Mg concentration and the ambient temperature (Table 2). Thin films exhibit lower activation energies and conductivities below 1000 K temperature. The highest total conductivities 6.17E-6 S/cm and 5.50E-4 S/cm were achieved using 1.2 mol % (873 K) and 2.5 mol % (1230 K) dopant concentrations respectively (Table 2). Moreover, the lowest activation energies are obtained when the dopant concentrations in MgxTi1-xO2-y thin films are 0.50 mol % and 1.2 mol % respectively. Such behaviour of total conductivity and activation energy is related with temperature, oxygen vacancy formation, defect association, and space charge effects [20, 21].
Table 2The activation energy at different temperature ranges and total conductivity at 873 K and 1230 K temperatures
, mol % | Activation energy, eV | Total conductivity, S/cm | ||
Below 1000 K | Above 1000 K | 873 K | 1230 K | |
0.25 | 2.07 | 1.17 | 2.68E-8 | 5.00E-4 |
0.50 | 1.55 | 0.957 | 2.18E-6 | 2.67E-4 |
1.2 | 1.46 | 0.906 | 6.17E-6 | 4.49E-4 |
2.5 | 1.83 | 0.968 | 1.78E-6 | 5.50E-4 |
4.8 | 1.73 | 1.35 | 1.42E-7 | 3.19E-4 |
8.0 | 2.28 | 1.17 | 1.25E-7 | 1.37E-4 |
Fig. 3Nyquist plot and the equivalent circuit of 1.2 mol % Mg-doped TiO2 thin ceramic films at different temperatures
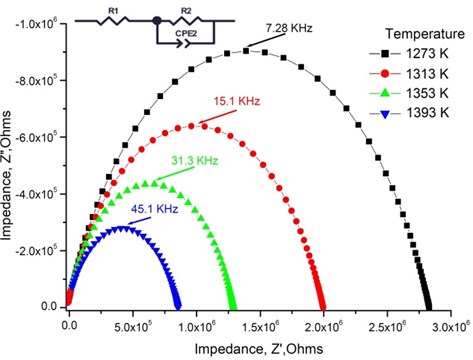
Table 3Electrical parameters of 1.2 mol % Mg-doped TiO2 thin ceramic films at different temperatures
1273 K | 1313 K | 1353 K | 1393 K | |
, Ω | 2.85 · 106 | 2.01·106 | 1.31·106 | 8.74·105 |
, F | 4.63 · 10-10 | 6.71·10-10 | 9.78·10-11 | 1.33·10-10 |
, Hz | 7.28 · 103 | 15.1 · 103 | 31.3 · 103 | 45.1 · 103 |
One completed semi-circular arc is seen from Nyquist plot [22]. The arc corresponds for total conductivity (Fig. 3). The impedance spectra were fitted by the equivalent circuit containing in series connected resistance with the parallel connected resistance and constant phase element (CPE).
The relaxation frequency is , where is the frequency of from Nyquist plot (Fig. 3) was obtained at different temperatures and it is seen that the relaxation frequency depends on the temperature. The relaxation frequency shifts to the higher frequency range from 7.28 · 103 Hz to 45.1 · 103 Hz with increasing temperature. The resistance decreases from 2.85 · 106 Ω to 8.74·105 Ω, respectively. The same effect was found in other authors results [23, 24].
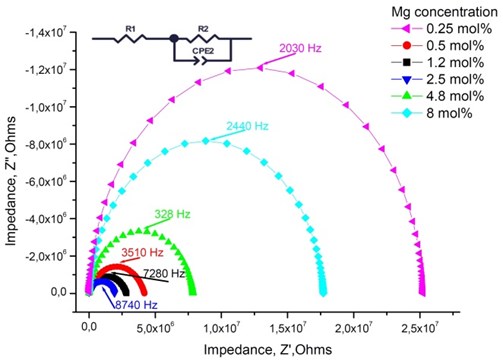
The highest relaxation frequencies 7.28 · 103 Hz and 8.74 · 103 Hz are obtained using 2.5 mol % and 1.2 mol % dopant concentration, respectively (Table 4). The largest number of charge carriers is at the concentrations that correlate with conductivity values (Table 3). Moreover, the thin TiO2 films doped with 2.5 mol % and 1.2 mol % Mg exbihit lowest values of ohmic resistance and relaxation time (Table 5).
Fig. 4Nyquist plot and the equivalent circuit of Mg-doped TiO2 thin ceramic films at different Mg concentration (T= 1273 K)
The relaxation time () of the thin ceramic films at different temperatures was calculated using the relation [25]:
where is the frequency (the value of frequency at maximum point of the imaginary part of impedance ).
Table 4Electrical parameters of Mg-doped TiO2 thin ceramic films at different Mg concentration
0.25 mol % Mg | 0.5 mol % Mg | 1.2 mol % Mg | 2.5 mol % Mg | 4.8 mol % Mg | 8.0 mol % Mg | |
, Ω | 2.53·107 | 4.20·106 | 2.85·106 | 1.93·106 | 7.86·106 | 1.77·107 |
, F | 3.26·10-12 | 4.49·10-10 | 4.63·10-10 | 1.01·10-10 | 1.27·10-10 | 4.93·10-12 |
, Hz | 2.03 · 103 | 3.51 · 103 | 7.28 · 103 | 8.74 · 103 | 3.28 · 103 | 2.44 · 103 |
Table 5Relaxation times of thin Mg doped TiO2 ceramics exhibiting highest and lowest conductivity values
833 K | 873 K | 913 K | 1150 K | 1190 K | 1230 K | |
2.5 mol % | 4.92E-02 | 3.25E-02 | 1.75E-02 | 1.21E-04 | 5.27E-05 | 3.48E-05 |
8.0 mol % | 3.18E-01 | 2.10E-01 | 7.45E-02 | 6.34E-04 | 2.77E-04 | 1.21E-04 |
The relaxation frequency shifts to the higher frequency side on increasing temperature indicating the increase of tangent loss and thermally activated dielectric relaxation process (Fig. 5). The relaxation time indicates the transition probabilities of the charge carriers along the conducting surface and is temperature dependent. The relaxation time was calculated for the thin films exhibiting marginal conductivity values. The shorter relaxation time value of 4.92E-02 s at 833 K temperature represents higher electrical conductivity for the thin films with 2.5 mol % Mg dopant concentration comparing to the 8 mol % Mg-doped thin films. The relaxation time becomes considerably shorter (3.48E-05 s) above 1000 K, when the increased electrical conductivity takes place.
Fig. 5Relaxation times of thin Mg doped TiO2 ceramics
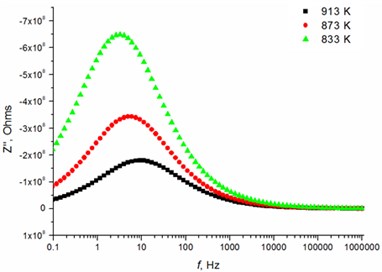
a) 2.5 mol % Mg-doped TiO2 at low temperatures
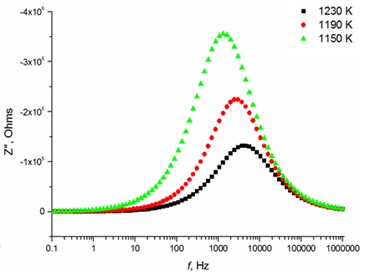
b) 2.5 mol % Mg-doped TiO2 at high temperatures
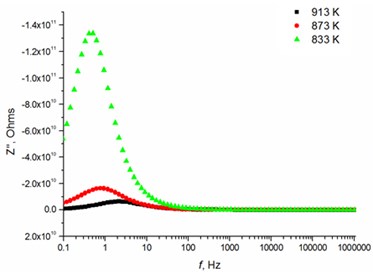
c) 8 mol % Mg-doped TiO2 at low temperatures
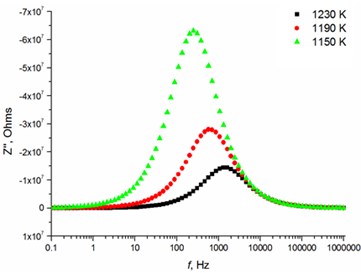
d) 8 mol % Mg-doped TiO2 at high temperatures
4. Conclusions
Thin Mg-doped TiO2 films were deposited using electron beam deposition. The structural properties and dynamics of carriers of these thin films were analysed. It was determined that Mg dopant decreases the crystallinity with increasing Mg concentration of the TiO2 thin films. The oxygen deficient films exhibited the increased conductivity under reducing conditions due to the enhanced mobility of the charge carriers by the presence of water and H2 and dopants acting as donors. The nonlinear conductivity could arise from increased mixed protonic electronic conductivity as a function of temperature. Total conductivity and activation energy depend on Mg concentration and the ambient temperature. The highest total conductivities 6.17E-6 S/cm and 5.50E-4 S/cm were achieved using 1.2 mol % (873 K) and 2.5 mol % (1230 K) dopant concentrations respectively. The highest relaxation frequencies and shortest relaxation times of 4.92E-02 s at 833 K and 3.48E-05 s at 1230 K temperature are obtained for the same experimental points, whereas the longest relaxation times 3.18E-01 s at 833 K and 1.21E-04 s at 1230 K temperature were estimated for 8 mol % Mg-doped TiO2 films.
References
-
Carp O., Huisman C. L., Reller A. Photoinduced reactivity of titanium dioxide. Progress in Solid State Chemistry, Vol. 32, Issues 1-2, 2004, p. 33-177.
-
Hashimoto K., Irie H., Fujishima A. TiO2 photocatalysis: A historical overview and future prospects. Japanese Journal of Applied Physics Part 1-Regular Papers Brief Communications and Review Papers. Vol. 44, Issue 12, 2005, p. 8269-8285.
-
Okuya M., Shiozaki K., Horikawa N., Kosugi T., Kumara G. R. A., Madarász J. Porous TiO2 thin films prepared by spray pyrolysis deposition (SPD) technique and their application to UV sensors. Solid State Ionics, Vol. 172, Issues 1-4, 2004, p. 527-531.
-
Bernik S., Daneu N., Rečnik A. Inversion boundary induced grain growth in TiO2 or Sb2O3 doped ZnO-based varistor ceramics. Journal of the European Ceramic Society, Vol. 24, Issues 15-16, 2004, p. 3703-3708.
-
Karunakaran C., Vijayabalan A., Manikandan G. Photocatalytic bacteria inactivation by polyethylene glycol-assisted sol–gel synthesized Cd-doped TiO2 under visible light. Research on Chemical Intermediates, Vol. 39, Issue 3, 2013, p. 1437-1446.
-
Zubillaga O., Cano F. J., Azkarate I., Molchan I. S., Thompson G. E., Skeldon P. Synthesis of anodic films in the presence of aniline and TiO2 nanoparticles on AA2024-T3 aluminium alloy. Thin Solid Films, Vol. 517, Issue 24, 2009, p. 6742-6746.
-
Cui C., Qiu Y., Zhao J., Lu B., Hu H., Yang Y. A comparative study on the quantum-dot-sensitized, dye-sensitized and co-sensitized solar cells based on hollow spheres embedded porous TiO2 photoanodes. Electrochimica Acta, Vol. 173, 2015, p. 551-558.
-
Zhang Z., Wang P. Optimization of photoelectrochemical water splitting performance on hierarchical TiO2 nanotube arrays. Energy and Environmental Science, Vol. 5, Issue 4, 2012, p. 6506-6512.
-
Li Y., Liu C., Liu Y., Feng B., Li L., Pan H. Sn-doped TiO2 modified carbon to support Pt anode catalysts for direct methanol fuel cells. Journal of Power Sources, Vol. 286, 2015, p. 354-361.
-
Cui Y., Sun J., Hu Z., Yu W., Xu N., Xu N. Synthesis, phase transition and optical properties of nanocrystalline titanium dioxide films deposited by plasma assisted reactive pulsed laser deposition. Surface and Coatings Technology, Vol. 231, 2013, p. 180-184.
-
Diebold U. The surface science of titanium dioxide. Surface Science Reports, Vol. 48, Issues 5-8, 2003, p. 53-229.
-
Khan A. F., Mehmood M., Durrani S. K., Ali M. L., Rahim N. A. Structural and optoelectronic properties of nanostructured TiO2 thin films with annealing. Materials Science in Semiconductor Processing, Vol. 29, 2015, p. 161-169.
-
Tilley R. J. D. Defects in Solids. Wiley-Interscience, 2008, p. 352-354.
-
Acton Q. A. Issues in Hydrogen, Fuel Cell, Eectrochemical, and Experimental Technologies. Scholarly Editions, 2013, p. 343.
-
Beg S., Haneef S. Electrical conductivity and phase transitions studies of TiO2-BaO system. Russian Journal of Physical Chemistry A, Vol. 89, Issue 1, 2015, p. 136-143.
-
Ekstrom H., Wickman B., Gustavsson M., Hanarp P., Eurenius L., Olsson E., Lindbergh G. Nanometer-thick films of titanium oxide acting as electrolyte in the polymer electrolyte fuel cell. Electrochimica Acta, Vol. 52, 2007, p. 4239-4245.
-
Patil B. B., Pawar S. H. Spray pyrolytic synthesis of samarium doped ceria (Ce0.8Sm0.2O1.9) films for solid oxide fuel cell applications. Applied Surface Science, Vol. 253, Issue 11, 2007, p. 4994-5002.
-
Eder D., Kramer R. Stoichiometry of “titanium suboxide”. Part 2. Electrical properties. Physical Chemistry Chemical Physics, Vol. 5, 2003, p. 1314-1319.
-
Hanaor D. H., Sorrell C. C. Review of the anatase to rutile phase transformation. Journal of Materials Science, Vol. 46, Issue 4, 2011, p. 855-874.
-
Helgee E. E., Lindman A., Wahnström G. Origin of space charge in grain boundaries of proton-conducting BaZrO3. Fuel Cells, Vol. 13, Issue 1, 2013, p. 19-28.
-
Stokes S. J., Islam M. S. Defect chemistry and proton-dopant association in BaZrO3 and BaPrO3. Journal of Materials Chemistry, Vol. 20, Issue 30, 2010, p. 6258-6264.
-
Aglzim EL-H., Bin Jamaluddin M., Chrenko D., Rouane A. Impedance spectrometer modelling in matlab/simulink for measuring the complex impedance of a fuel cell –EIS method. Journal of Clean Energy Technologies, Vol. 1, Issue 4, 2013, p. 255-259.
-
Shekharam T., Laxminarasimha R. V., Yellaiah G., Mohan K. T., Nagabhushanam M. AC conductivity, dielectric and impedance studies of Cd0.8−xPbxZn0.2S mixed semiconductor compounds. Journal of Alloys and Compounds, Vol. 617, 2014, p. 952-960.
-
Zhao L., Perry N. H., Sasaki K., Bishop S. R. Electronic and ionic conductivity of Eu0.2Ce0.8O2-δ. Solid State Ionics, Vol. 263, 2014, p. 75-79.
-
Intatha U., Eitssayeam S., Wang J., Tunkasiri T. Impedance study of giant dielectric permittivity in BaFe0.5Nb0.5O3 perovskite ceramic. Current Applied Physics, Vol. 10, 2010, p. 21-25.
About this article

This research is funded by the European Social Fund under the Global Grant Measure.
