Abstract
Propose to a method of gearbox fault diagnosis based on autocorrelation and HHT. The method of Empirical mode decomposition (EMD) separate gearbox vibration signal data into several intrinsic mode function (IMF). Through the autocorrelation analysis of each IMF component, which can effectively eliminate the noise component, rapidly and accurately screen out IMF component containing characteristic information of gear fault, and then transform it for Hilbert-Huang, and get the gearbox fault characteristic frequency. After testing real gearbox vibration signals, it shows that the method has higher engineering value.
1. Introduction
Gearbox is an important part of machinery and equipment, it is an essential role in the quality of machinery and equipment on working state. Traditional methods of gear fault signal analysis is Fourier transform, the method has a significant analytical effect to solve stationary and linear signal. However, when gear failure appears to fault, it often presents a nonlinear, non-stationary vibration signal, which is a big challenge for gearbox fault diagnosis. In 1998, the Chinese-American Norden E. Huang et al made deeply study on the concept of instantaneous frequency and proposed creatively concept of intrinsic mode function (IMF) as well as a new method of decomposing any signal into several intrinsic mode function (IMF), that empirical mode decomposition (EMD) [1], EMD not only apply to non-linear and non-stationary vibration signals, but also for the linear and stationary signals. In this paper used a method of autocorrelation combined with EMD to analysis the collected gearbox signal, this method can effectively improve the end effect of EMD, increasing the flexibility and accuracy of processing signals, at the same time, obtaining gear fault characteristic frequency by Hilbert transform, achieving successfully the fault diagnosis of gearbox
2. Basic principle of HHT [2]
HHT is a signal processing method of combing EMD with Hilbert spectrum. Firstly, decompose vibration signal by EMD, obtaining several IMF components .Secondly, use Hilbert transform to obtain to instantaneous frequency and amplitude. The method of EMD is highly efficient and adaptive features, we can’t pre-selected group functions, IMF component decomposed most practical physical meaning. So, the method of HHT has been applied and promoted in signal processing and analysis.
2.1. The method of EMD
The method of EMD decomposes the complex signal into the limited intrinsic mode functions (IMF) and has good completeness. IFM contains high to low frequency components of the signal, and can be changed as the change of the signal. It is orthogonal between each of the intrinsic mode function (IMF), so, IMF component obtained has very important implications for the instantaneous frequency. Intrinsic mode components must meet the following two conditions: (1) in the entire data series, the number of zero crossings and the number of extreme points must be equal to or the most difference is not greater than 1; (2) at any point in time, the mean value of local maximum values determine the envelope and local minimum envelope is the number of 0. The specific decomposition process of EMD is show in Fig. 1.
Fig. 1The decomposition process of EMD
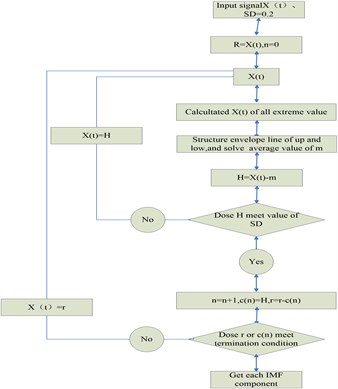
Fig. 2The process of Hilbert transform
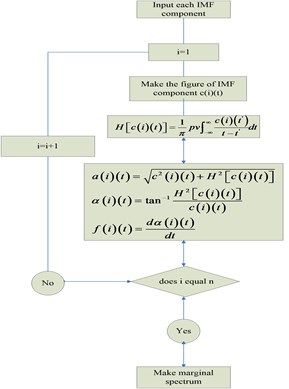
2.2. The principle of HHT
By the above method of EMD obtained several IMF component signals, then the Hilbert transform to each IMF and give each IMF component corresponding to the instantaneous frequency spectrum, all the IMF component of the instantaneous spectrum combined the Hilbert spectrum can be calculated out. Then make time points on the Hilbert spectrum and can get its marginal, finally, the gearbox fault characteristic frequency by marginal spectrum. The process is show in Fig. 2.
2.3. Autocorrelation analysis
Autocorrelation is the application of the signal cycle and the characteristics of random noise, based on the autocorrelation of the budget to achieve the purpose of noise reduction [3]. It is to understand own signal at a certain moment and the connection degree of another time, and does not change cycle of signal, but the signal phase can change, as long as the signal containing a periodic signal, then the autocorrelation function is also obviously periodic. However, while the noise signal is often random, the noise signal exhibits attenuation characteristic by autocorrelation analysis, the maximum value obtains at zero. This can effectively eliminate signal noise signal. The calculation formula of autocorrelation function to refers to [4].
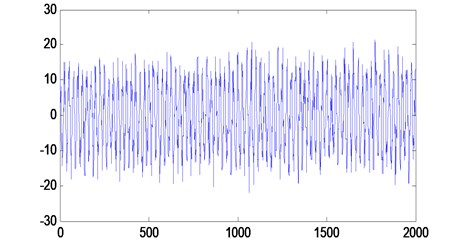
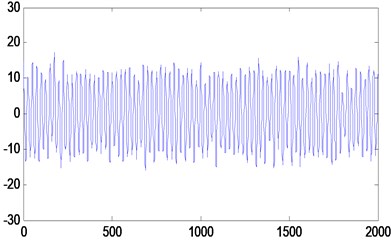
Fig. 3The time domain of signal
Observe gear vibration signal of acquisition, if vibration signal is under the condition of abnormal operation, the signal will appear in random periodic pulse. To take advantage of this feature can be autocorrelation analysis of random signal and eliminate noise in random signal, then make it Hilbert transform. This paper will combine the autocorrelation function with EMD, vibration signal decomposes into multiple components of the IMF by EMD first, making each IMF component for autocorrelation analysis, excluding noisy signal, screening effectively IMF component, making it Hilbert transform, Achieve the purpose of gear fault diagnosis.
3. Test of signal simulation
In order to verify the noise reduction effect of autocorrelation analysis, to construct a known signal to verify, two cosine functions and a noise signal as follows:
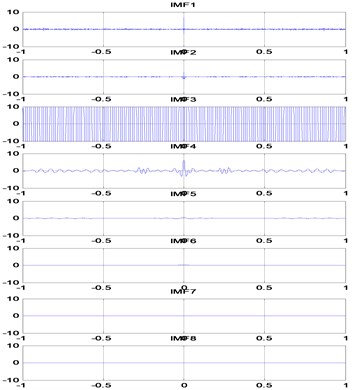
The sampling frequency of signal is 1000 Hz, data length is 2000, is 8, the simulation signal is decomposed into eight IMF components and a residual component by EMD, which follows a time domain of signal and each IMF component diagram Fig. 3 and Fig. 4.
Fig. 4The IMF components
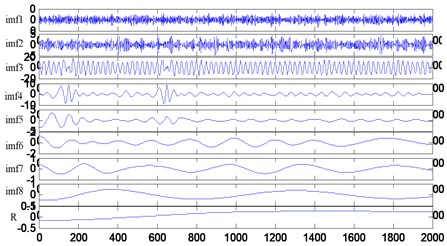
Make each IMF component of gain autocorrelation analysis, as Fig. 5 shows. According to the characteristics of the autocorrelation analysis, the first two and the last four components can be judged to relatively fast decay, it can be determined to the noise signal and be removed.
Fig. 5Autocorrelation analysis of the IMF
The remaining components of the IMF is reconstructed and gets the de-noise signal, as Fig. 6 shows. Comparing Fig. 3 of the time domain of signal with Fig. 6 of the de-noise signal, it shows that the noise reduction effect is obvious.
Fig. 6The signal of de-noise
4. Example of the engineering
Analyzing the HHT from the entire process, each IMF component is generated by signal, and has the character of self-adaption [5]. So it has a good time-frequency localization properties and high decomposition efficiency. When there is something wrong with the gear, the meshing process of the faulted teeth will produce greater load than the other teeth, and then will affect other gears. The vibration intensity of gear increases by the increases of the fault severity, which make the vibration energy produce large change in frequency and multiplier. Therefore we can use the frequency and amplitude of Hilbert spectrum to determine the state of the gear.
Using the method of self-correlation and Hilbert-Huang transform to analysis the broken tooth gear and gather the signal in the gearbox test rig, test bench structure has been shown in Fig. 7.
Fig. 7The test bench structure
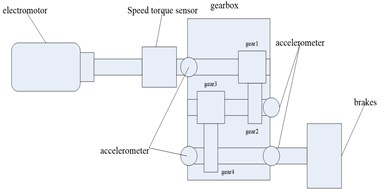
The two acceleration sensors are mounted on the skin of the planetary gearbox, sampling frequency of the test system is 20 KHz, time is 6 s, speed is 800 rpm, rated power is 4 kw. There are 2 gears in the planetary gearboxes, the meshing frequency of the first pair is 466.6667, and the meshing frequency of the second pair is 131.2500. The axis rotation frequency is shown below: 13.3333, 7.2917, 1.6204. In this paper, we use 2048 sampling points of experimental study to analysis. And using the above method to analysis the EMD decomposition and autocorrelation of the sampling points, eliminating the noise signal contained in the original signal. Comparing the original signal in Fig. 8 with the signal after noise reduction in Fig. 9, we can see the effect of noise reduction obviously.
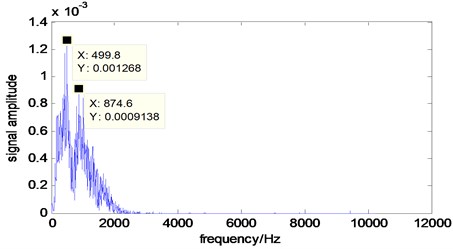
In order to diagnose the failure of planetary gear box, by further Hilbert transform on the signal after the noise reduction, the marginal spectrum is shown in Fig. 10. We can see the peak frequency is 499.8 Hz, 874.6 Hz from the marginal spectrum, which is about once and twice double of the gear frequency 466.6667 by gear 1 and gear 2, so you can judge that the first pair of gear is faulted.
Fig. 8The original signal
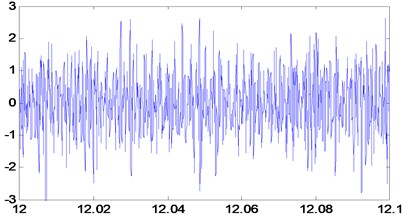
Fig. 9The signal of de-noise
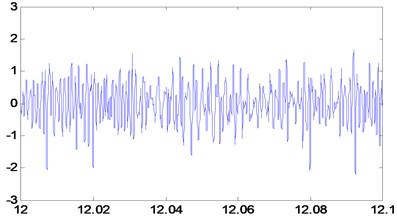
Fig. 10The marginal spectrum of signal
5. Conclusions
In this paper, we use the method of self-correlation and Hilbert-Huang transform to diagnosis the fault of gearbox, through the analysis of simulation signal, we know that self-correlation analysis can effectively reduce the signal noise. Combining this method with the HHT, we can obviously analyze the characteristic frequency of the gear box. To the non-linear and non-stationary signals produced by the processing of gearboxes, it has very good result and high practical value.
References
-
Sweldens W. The lifting scheme: a construction of second generation wavelet construction. SIAM: SIAM Journal on Mathematical Analysis, Vol. 29, Issue 2, 1997, p. 511-546.
-
He Zhengjia, Chen Jin, Wang Taiyong, Chu Fulei Mechanical Fault Diagnosis Theory and Application. Higher Education Press, Beijing, 2010.
-
Hu Jingsong, Yang Shixi Study on the autocorrelation-based vibration signal EMD decomposition method in rotating machinery. Mechanical Strength, Vol. 29, Issue 3, 2007, p. 376-379.
-
Liu Shulin, Zhao Haifeng Approach to weak signal extraction based on empirical mode decomposition and autocorrelation analysis. Journal of Daqing Petroleum Institute, Vol. 31, Issue 5, 2007, p. 81-85.
-
Yang Yu, Yu Dei jie, Cheng Junsheng Roller bearing fault diagnosis based on Hilbert marginal spectrum. Journal of Vibration on and Shock, Vol. 24, Issue 1, 2005, p. 70-72.
About this article

