Abstract
Diagnostics of rotating machinery relies on examining of many dozens of fault indicators that enable recognition of malfunction symptoms at the earliest stage possible. Unfortunately, in many industrial applications and especially in large machinery parks, the number of diagnostic features to monitor goes beyond the perception capabilities of responsible maintenance personnel. Therefore, there is need for a data reduction techniques that simplify and provide the most important information within the condition monitoring system, starting from a single kinematic element. In this paper it is proposed to employ a simple Euclidean distance that relates the object’s condition to the difference between the vibration-based indicators and the initial state. As an example, the authors examine the integration of diagnostic features used to identify localized and extended fault of rolling element bearings for simulated data and real industrial event that occurred at wind turbine’s generator bearing.
1. Introduction
The ongoing development of condition monitoring systems (CMS) results in situation, when responsible maintenance professionals are equipped with robust tools for fault detection at the early stage. This involves complex signal processing of residual signals [1], various knowledge-based methods [2, 3] or soft computing techniques [4]. There are also more practical applications that take into account data from SCADA systems [5].
In the same time, the rapid advancement of diagnostic capabilities causes the information overload. For example, in wind turbine industry, the maintenance engineer is obligated to analyze more than a hundred different diagnostic features that are calculated from raw vibration signals. Most popular ones are narrowband energies representing frequencies equal to gear mesh, shaft harmonics etc. There are also broadband features, which are less susceptible to noise and windowing effects and are considered more robust ones. Taking into account all indicators calculated from 6-8 vibration signals, for a wind park consisting of few dozens of wind turbines, the amount of information is overwhelming [6]. It is especially difficult for a classical comparative study, e.g. in trending, where values are plotted in time for the potential increase. In many industrial applications maintenance staff aids with control limits that provide information about significant increase of particular indicators. Unfortunately, sometimes it is insufficient since alarms may turn on at various indicators within a short time [7].
Therefore, the authors propose to integrate (fuse) information from diagnostic features related to a particular kinematic element, so that the end user receives a single normalized-like value representing condition of a bearing, gearbox or shaft. The intention is to provide a methodology that is simple and efficient for any industrial application.
The paper is organized as follows. After short introductory part the exemplary data reduction techniques are discussed. In Section 3 the proposed method is described. The established reasoning is presented in Section 4 on two examples: simulated and real life one. Finally, the paper is concluded along with description of further research in this topic.
2. Data reduction
Generally, any data reduction procedure aims at change of a given set of data into new, modified one, that simplifies or reveals new information [8]. This can be done via e.g. transforming, correlating or fusing measured phenomena. Additionally, it is desired to reduce the amount of observed data yet primarily to maintain the informativeness of the remaining part and to keep the preserve knowledge about the observed object.
A classic example of transformation of large set of data into smaller one is the signal processing algorithm commonly encountered in diagnostics of rolling element bearings (REB), namely calculation of the envelope spectrum. Insight into geometrical parameters of the analyzed bearing allow to transform raw vibration signal containing tenths of thousands frequency points (between 0 and 1/2 of sampling frequency) into four narrowband bearing indicators, i.e. BPFO, BPFI, BSF, FTF [9]. Another approach to feature integration is the correlation of spectral-domain components of a vibration signal. It can be applied for consecutive fault-related harmonics and provide correlated value instead of numerous singular ones, as described in [10]. Such correlation is not present within signal collected in healthy condition of the object, so the increasing correlation factor informs about arising malfunction.
There are also other methods, like Principal Component Analysis, that organize system’s information in order related to variance of its components, i.e. diagnostic features. In some applications it is also used to reduce dimensionality by excluding the signals with leased variability since it is concluded that it carries no or smallest amount of information. However, it can be concluded as drawback since it precludes message with the unknown value for the operator. If properly defined, some features might seem dormant in healthy conditions, therefore its variance is then limited. In turn, in presence of fault, they increase indicating of fault occurrence, so it is not suggested to exclude them from the monitoring process.
To overcome this imperfection, in [11] the authors proposed to employ Mamdani-type fuzzy interference engine. As was presented, it captures most valuable information about bearing condition via integrating information about localized fault of bearings and results in a single feature that indicates of a condition of a bearing in terms of a localized fault occurrence. The example of feature integration of rolling element bearing is followed in this paper.
3. Proposed method
In general, the condition monitoring process of this group of kinematic elements considers search for localized or extended fault [12]. The latter can be understood as more severe and follows the localized one but it does not have be a rule, so it is suggested to treat it independently. Another assumption is to justify the condition of an object as the continuum between the initial state and a damage state. If placed on a plane, one can calculate the distance between its current position and zero point, which can be interpreted as initial, ideal (when there are no vibration) or healthy condition calculated from the referential period of operation. Once using this methodology one may observe the behavior of the distance as it fluctuates over time representing deteriorating condition of the object, e.g. bearing.
For many critical kinematic elements the faults can be categorized into different groups, like for:
• bearings – localized and extended ones which manifest as an increase of a single narrowband features (as described above) and an increase of random frequencies resulting in the increase of the entire energy of the signal, respectively;
• gearboxes – as misaligned gears resulting as increase of GMF’s harmonics, and worn gears revealing in increase of GMF’s sidebands; broken tooth results as a combined phenomenon;
• shafts – imbalance as increase in 1x rotational speed and misalignment in 2x.
It should be stated that in each of the aforementioned cases the identification of a fault is important, but the upmost priority should be given to the general information about fault occurrence, which is delivered to the responsible maintenance professional at the first place. Therefore it is proposed to use an integrated feature that combine information from the diagnostic feature into a single feature for each kinematic element that is much simpler to observe than the multiple ones.
The fusion of the features is possible in the normalized-like domain, where information is observed in the range 0-1 for condition in between the initial and damaged, and above 1 for damaged with arising severity. It should be stated that it is not a simple task to figure out what is the maximal value that the indicator can take, e.g. it may be related to the maximal range of the sensor used to measure vibration. Therefore in the described approach authors suggest to normalize the feature so that the control limit is a breaking point equal to a unit. Intuitively, the indicator can reach beyond this point, but this simultaneously constitute, that the fault is present, and it develops above the critical point.
The distance can be calculated using simple Euclidean formula, as presented in Eq. (1):
Thanks to the division of the features by the upper control limits the integrated feature does not exceed the integrated control limit equal to 1 until at least one of the feature is above its limit, so that:
For instance, for three independent features, the general condition could be calculated just as a radius in spherical coordinate system. The control limits adjustment can be calculated using various techniques, e.g. using standards [13, 14] or statistical methods [15, 16]. For features with different importance for the entire object this method can be improved by applying appropriate weights , so that:
In the next chapter the proposed methodology is presented for rolling element bearing in two cases: simulated and the real life one.
4. Possible applications
4.1. Simulation example
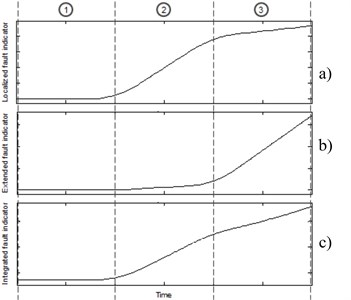
In the first case, the presented reasoning is limited to two key fault features, where one corresponds to localized fault, while the second one is related to the extended fault. The latter one is usually more severe, but for the simplification purposes it can be assumed that are treated with equal weight. The behavior of the integrated feature is analyzed in three stages, as described below and presented in Fig. 1.
• Stage 1: No damage is observed – there is no increase for each of the indications therefore the integrated feature remains stable at low level.
• Stage 2: Occurrence of a localized fault – an increase of a single indicators manifests as corresponding raise of the integrated features
• Stage 3: Extended fault occurs – integrated feature constantly increase.
Fig. 1Influence of a) localized and b) extended, c) fault indicators on the integrated one
4.2. Real life example
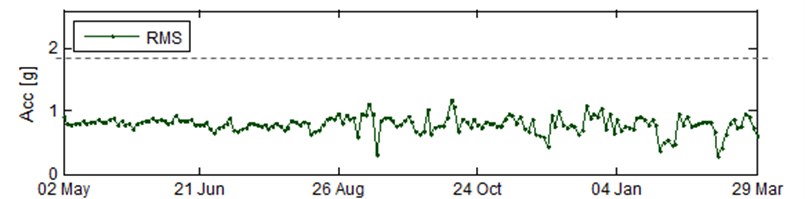
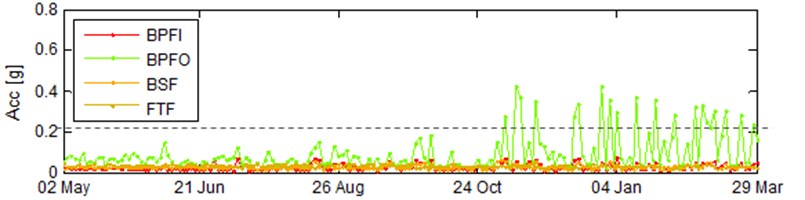
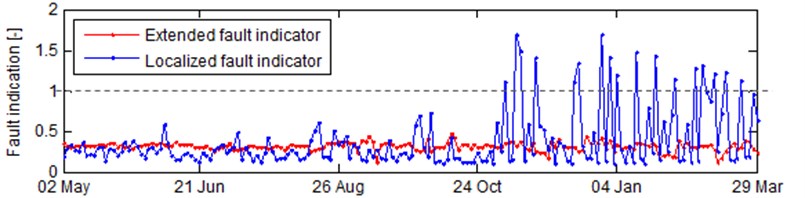
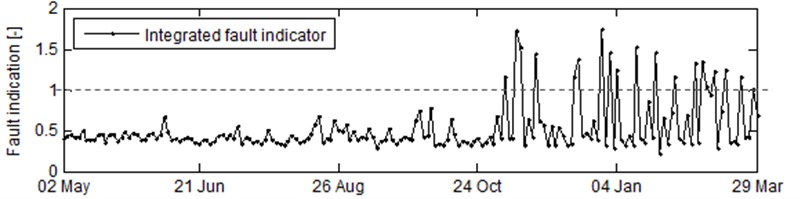
The utility of the described method is presented on the bearing’s outer race fault development. The bearing was located on the driven end of generator in the commercially used 1.5 MW wind turbine located in western Germany. In the analyzed example each parameter was acquired roughly every 24 hours from 10 s measurement. The vibration signals were collected with 25 kHz of sampling frequency. The behavior on REB was observed between May 2nd and March 29th of the following year. Due to the fact that the amplitude of features is highly susceptible to rotational speed [17], one needed to filter it for particular operation state [18]. This resulted in the established operational state with rotational speed at the generator shaft in the range of 950-1150 RPM. The narrowband features, that provided information about localized fault, were calculated using the methodology provided in [11], while the symptoms of the extended fault were captured using the energy of vibration signal, i.e. root-mean-square (RMS). This was obtained using formula from Eq. (4):
The observed feature were plotted in the form of trends (RMS at top plot and narrowband features at middle top plot of Fig. 2). In order to notify the CMS’s user about change in vibration feature’s amplitude, the UCLs were established using methodology provided by [15].
It can be seen that the condition of a bearing’s outer race changed shortly after October 24 that was simultaneously pointed by the integrated features of categorized types of faults and the integrated fault indicator at middle bottom plot and bottom plot, respectively. The latter one basically follows the BPFO, as it was the source of the observed fault. For the top-level view, the essential information is preserved and the information load is greatly reduced.
5. Conclusions
In this paper the authors discuss utility of diagnostic feature integration as a accessible method for simplification of diagnostic process in industrial application. The technique considers calculation of combined vibration-based diagnostic features and combining them into groups related to particular independent failure stages of an observed object. The methodology for an integrated feature is based on approximation of a distance between the current condition of an object and its ideal or initial state. The proposed method is presented for one of the most commonly used kinematic elements, namely rolling element bearings. It is discussed for in two simple cases: simulated and real life one. As shown, the observed integrated feature can substitute five major fault indicators and provide most important information about object’s condition in the monitoring process. Thanks to this approach, current condition of each kinematic element can be analyzed in much simpler form than it is provided in state-of-the-art condition monitoring systems.
In further research, it is planned to apply the proposed idea for other crucial elements of rotating machinery components such as gearboxes and shafts. In authors belief, it is possible to equip a system with the front layer consisting of only integrated features informing of a condition of a particular elements with limited or no distinction to the reason of such state.
Fig. 2Fluctuation of diagnostic features related to bearings: a) RMS, b) BPFO, BPFI, BSF and FTF, c) localized and extended fault indicators and d) the integrated one. The dotted line in each plot represents level of control limit
a)
b)
c)
d)
References
-
Barszcz T., Jabłoński A., Strączkiewicz M. New generation of condition monitoring systems for non-stationary machinery – proposal of the architecture. CM 2013 and MFPT 2013, Krakow, Poland, 2013.
-
Dong D. W., Hopfield J. J., Unnikrishnan K. P. Neural networks for engine fault diagnostics. Neural Networks for Signal Processing VII, New York, 1997, p. 636-644.
-
Lethe G., Kinne D., Terna I. Dynamic simulation of a wind turbine system calculating vibrations, loads, durability and acoustic response in a single CAE environment. European Wind Energy Conference and Exhibition, Marseille, France, 2009.
-
Zhang Zh., Wang K. Wind turbine fault detection based on SCADA data analysis using ANN. Advanced Manufacturing, Vol. 2, Issue 1, 2014, p. 70-78.
-
Yang W., Tavner P. J., Crabtree C. J., Wilkinson M. Cost-effective condition monitoring for wind turbines. IEEE Transactions on Industrial Electronics, Vol. 57, Issue 1, 2010, p. 263-271.
-
Barszcz T., Strączkiewicz M. Novel intuitive hierarchical structures for condition monitoring system of wind turbines. Diagnostyka, Vol. 14, Issue 3, 2013, p. 53-60.
-
Strączkiewicz M., Barszcz T., Jabłoński A. Detection and classification of alarm threshold violations in condition monitoring systems working in highly varying operational conditions. Journal of Physics: Conference Series, Vol. 628, 2015.
-
Ehrenberg A. Data reduction. Journal of Empirical Generalizations in Marketing Science, Vol. 5, Issue 1, 2000, p. 1-391.
-
Randall R. B. Vibration-based Condition Monitoring. Industrial, Aerospace and Automotive Application. John Wiley and Sons, 2011.
-
Strączkiewicz M., Klepka A., Staszewski W. J., Aymerich F. Triple correlation technique for damage detection in composite materials. Key Engineering Materials, Vol. 588, 2014, p. 302-309.
-
Strączkiewicz M., Czop P., Barszcz T. The use of a fuzzy logic approach for integration of vibration-based diagnostic features of rolling element bearings. Journal of Vibroengineering, Vol. 17, Issue 4, 2015, p. 1760-1768.
-
Singh S., Howard C. Q., Hansen C. An extensive review of vibration modelling of rolling element bearings with localized and extended defects. Journal of Sound and Vibration, 2015.
-
ISO 10816, Part I, Mechanical vibration – Evaluation of machine vibration by measurements on non-rotating parts – Part I: General Guidelines. International Organization for Standardization, Geneva, Switzerland, 1995.
-
VDI 3834, Part I, Measurement and Evaluation of the Mechanical Vibration of Wind Energy Turbines and Their Components. The Association of German Engineers (VDI), Düsseldorf, Germany, 2009.
-
Marhadi K. S., Skrimpas G. A. Automatic threshold setting and its uncertainty quantification in wind turbine condition monitoring system. International Journal of Prognostics and Health Management, Vol. 6, 2015, p. 1-15.
-
Cempel C. Limit value in practice of vibration diagnosis. Mechanical Systems and Signal Processing, Vol. 4, Issue 6, 1990, p. 483-493.
-
Zimroz R., Bartkowiak A. Two simple multivariate procedures for monitoring planetary gearboxes in non-stationary operating conditions. Mechanical Systems and Signal Processing, Vol. 38, Issue 1, 2013, p. 237-247.
-
Strączkiewicz M., Wiciak P., Jabłoński A., Barszcz T. Machinery in highly changing operations: on designation of operational states. CM 2015 and MFPT 2015, Oxford, UK, 2015.
About this article

The authors would like to acknowledge the financial support of AGH University of Science and Technology within the Program of Dean’s Scholarships (No. 15.11.130987).
