Abstract
Tool magazine and automatic tool changer (ATC) is used to store and change tools in a machining center, which plays an important role in automatic manufacturing. Therefore, the stability and reliability of tool magazine and ATC is very important to a machining center. Failures of tool magazine and ATC would increase ramp-up repair time and repair cost. So early warning system of failures for tool magazine and ATC becomes a research hotspot. The main vibration signals of tool magazine and ATC would occur obviously when the tool arm grasps a tool holder, draws a tool holder out of a tool into spindle or tool pocket and inserts a tool holder into spindle or tool pocket. To predict failures of tool magazine and ATC and improve the availability of machining center, a vibration test procedure and calculation method of vibration signal threshold of pull nails looseness which can lead to tool falling failures are proposed based on the vibration detection theory. Then, the vibration signals of tool changing are analyzed and the relationship between the maximum amplitude of vibration signals and the looseness severity of pull nails is also illustrated. The final experiment results show that the tool falling failure warning method is feasible to reduce the failures of tool magazine and ATC through the early warning system based on the threshold of vibration signals.
1. Introduction
Tool magazine and ATC (in this paper we call tool magazine and ATC as ATC for short) which stores tools to tool magazine and changes tools automatically is required in a machining center. It can reduce the non-cutting time and production costs, and also can increase productivity [1-3]. If an ATC fails, it would bring massive loss for users. According to some statistics, failures of ATC account for 15 % of the total failures of machining centers, so the reliability of ATC affects the performance of machining centers seriously. Therefore, various studies focused on improving the reliability and availability of ATC [4-5]. Yuanjun Wang studied the characteristics of tool changing movement and established an ATC reliability model [6]. S.W. Lee presented some of reliability evaluation methodologies to evaluate failure rate and MTBF (mean time between failures) for ATC [7]. In order to develop a reasonable and generalized reliability model, Bomin Meng proposed a reliability model whose time between failures follows to Weibull function and its parameters were estimated by adaptive genetic algorithm and correlation coefficient method [8]. To improve ATC availability, some research have been devoted to ATC preventive maintenance strategy. JN PAN proposed a mathematical model established by recursive algorithm [9].
Failure Mode and Effects Analysis (FMEA) has been successfully employed in ATC to find the weakness positions, and then to improve the design. Zhi Xu presented a reliability analysis method by GO method to verify the weakest positions [10]. For the purpose of eliminating the early failures and improving the availability, Yuanyuan Jin proposed an early screening test procedure [11]. Tian Ge presented a reliability growth test strategy and data analysis methodology based on Duane model theory and it could be instrumental for establishing various management decisions for ATC [12].
Among all failures of ATC, the tool falling failure is the most frequent failure, more than any other machining center part. Furthermore, it is the most serious failure, because when a tool falling failure occurs, the machine center or the operator may be hit by the falling tool. Among all the reasons, pull nails looseness is the most major reason for the failure of tool falling. Through failure analysis, tool falling failures caused by pull nails looseness of ATC account for 22 % of all the failures of machining center. Actually, each pull nail is fixed on a tool holder by screw thread. When the pull nails loosen in some degrees, it would lead to a mistake of the tool changing arm clamping position, so tool changing arm would not grasp the tool holder firmly, the tool holder and the tool installed into the tool holder would fall onto the test bed directly. However, this failure mode cannot be found easily by visual inspection.
In order to improve the reliability of ATC and reduce reliability test time, a fast reliability test bed of ATC is developed [13]. This reliability test bed can simulate the actual working conditions, so failures of ATC would be motivated under strengthen working loads in a short time, but the failure modes and failure mechanism would not change. If a pull nails loosen in different degrees, the vibration of ATC would be quite different. So if vibration sensors are installed on ATC, vibration thresholds generated by the pull nails looseness can be obtained. Therefore, ATC can be equipped with vibration sensors to prevent tool falling failures. Finally, the tool changing experiments prove that the installation of vibration sensors on ATC is useful to prevent tool falling failures of ATC effectively.
This study is devoted to establish an early warning system for ATC and develop a method of calculating vibration threshold for tool falling failures caused by pull nails loosen. The remainder of this paper is organized as follows: in section 2, the structure of the reliability test bed of ATC is presented. In section 3, procedures of contrast test of vibration is designed. Section 4 demonstrates analysis of vibration data. Section 5 concludes this paper.
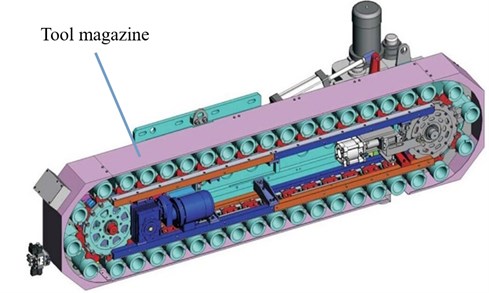
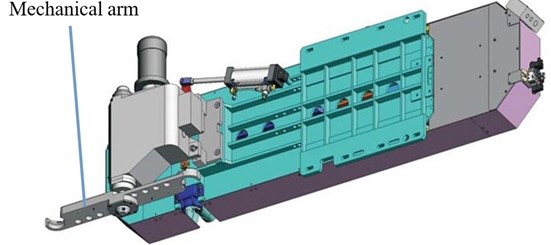
Fig. 1Structure of ATC
2. Reliability test bed of ATC
ATC consists of two main elements, one is tool magazine and the other is mechanical arm which also known as tool changing arm. The magazine part is driven to rotate with tool holders by a servo motor and used to store tool holders. The mechanical arm part equipped with a servo motor can accomplish the movement of tool changing. Fig. 1 illustrates the entire structure of ATC.
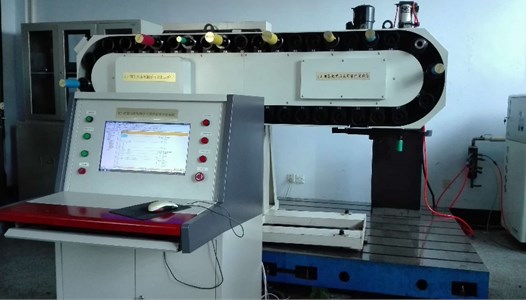
To evaluate the reliability of ATC in a short time, a reliability test bed of ATC is developed. The principle and composition of ATC reliability test bed are shown in Fig. 2 and Fig. 3. The test system consists of the following components: virtual spindle, which can simulate the spindle rotation and provide the position for tool changing; virtual spindle support mechanism, which is used to hold the virtual spindle; test bench support base, where ATC, virtual spindle and other parts are fixed; control system, which is used to control the movements of ATC and composed of PLC and IPC.
Fig. 2Schematic of ATC reliability test bed
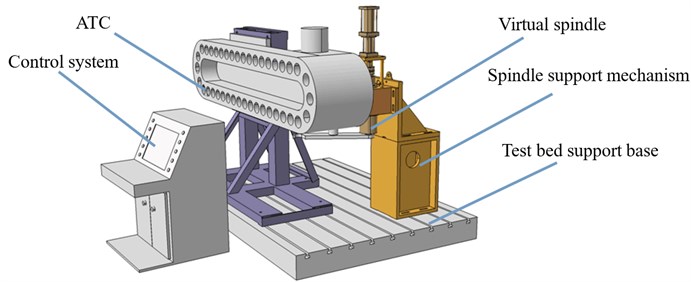
Fig. 3ATC reliability test bed
Accelerated life test of ATC can be conducted in this test bed according to the load spectrum of ATC. By comparison, this test bed can be adapted to many different types of ATC. Because of the similarity between the bench test and the field test, the vibration test of ATC conducted in this reliability test bed can response the vibration of ATC in normal conditions.
3. Vibration test of ATC
3.1. Working principle of ATC
The procedures of tool changing are as follows: firstly, the manipulator rotates 60 degrees anticlockwise for clamping the tool holder and moves 167 mm horizontally for drawing the tool holder. Then the manipulator grasps the tool holder to rotate 180 degrees clockwise and move back 167 mm for inserting the tool. At last, the manipulator loosens the tool and rotates backward 60 degrees to its original position. Through the above movements, the needed tool in the spindle is replaced automatically by the tool changing arm.
3.2. Vibration source
The movements of ATC include movements of geared motor of tool changing arm, grasping a tool holder, drawing a tool holder out of the tool pocket or virtual spindle, inserting a tool holder into the tool pocket or virtual spindle, tool changing arm rotating and returning to the original position. All the movements above would cause vibration. Movements of geared motor of tool changing arm, rotation of tool changing arm and the return to the original position are stable, so the vibration in this process will be slight. When the tool holder is grasped by the tool changing arm, there is a stiff impact between the tool changing arm and tool holder. When the tool holder is drawn from a tool pocket or virtual spindle, there also is a stiff impact between the tool changing arm and tool pocket or virtual spindle. Similarly, a stiff impact between the tool changing arm and spindle or tool pocket occurs when the tool holder is inserted into the spindle or tool pocket. So the vibration in these processes will be violent. Therefore, the vibration signals of ATC can be measured directly by vibration sensors fixed on ATC.
3.3. Installation of vibration sensors
Because the virtual spindle and tool pocket bear the impulse loads which would occur when the tool holder is inserted into or clamped from the spindle and tool pocket, there must be vibration source near the virtual spindle and tool pocket. So if the vibration sensor is fixed near the spindle or tool pocket, the signals would be obvious and the disturbance signals measured by sensors would quite small, which can be ignored.
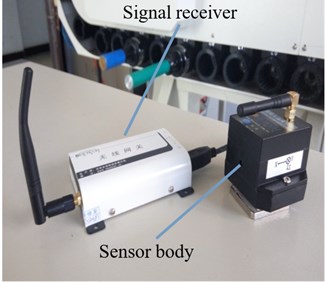
However, the virtual spindle and tool pocket have nothing contact each other, if a vibration sensor is fixed on the virtual spindle or tool pocket, it can’t measure the vibration completely. Fortunately, either virtual spindle or tool pocket can transmit vibration to tool changing arm through the tool holder during the process of tool changing. So if a vibration sensor is fixed on the tool changing arm, it can measure the vibration completely. Because the tool changing arm moves during the whole process, wireless sensor is employed and shown in Fig. 4. The wireless sensor consists of signal receiver which is connected to control system and sensor body which is fixed on the ATC. Taking the performance of ATC, cost and the sensors effect into account, the type of A302-EX is chosen. The mass of the sensor is 120 g and its scale is 3.5 cm×3 cm×4.5 cm and it is a 3-axial accelerometer. The sensitivity of the sensor is 10 μg and the bandwidth of the sensor is 0-200 Hz.
Fig. 4Wireless sensor
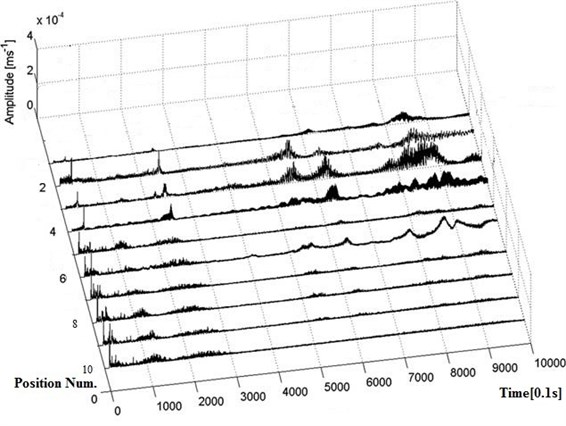
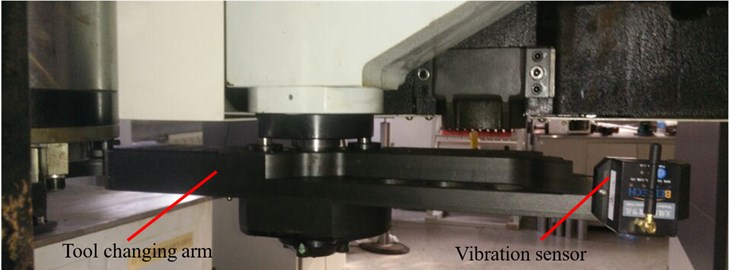
In order to find the effective position for installing a sensor on the tool changing arm, a simple test is conducted. Changing the tool holder from a tool pocket to the virtual spindle is the inverse process of changing the tool holder from the virtual spindle to a tool pocket. So in all the next tests, the vibration is measured only in the process of changing the tool holder from a tool pocket to the virtual spindle. Only one claw of the tool changing arm is used in the process, so the sensor should be fixed near this claw. As shown in Fig. 5, 10 positions near the claw are chosen to do vibration test in turn, each position is marked by Arabic numerals and the mark numbers increase with the distance between the positions for installing sensors and the claw. As seen from Fig. 6, because of the interference of the white noise, the vibration signals measured from different positions vary greatly [14, 15]. And in Fig. 6, the -axis expresses the sampling point. Vibration signals was sampled once per 0.1 seconds, so the scale of horizontal axis is 0.1 s. The test results show that the maximum amplitude of vibration signals increase with the inverted sequence of the sensors, what indicates that the nearer the sensor installation position to the claw, the more obvious the vibration is. So the sensor is fixed on No. 1 position in the next tests, as shown in Fig. 7.
Fig. 5Ten different positions where sensors fixed
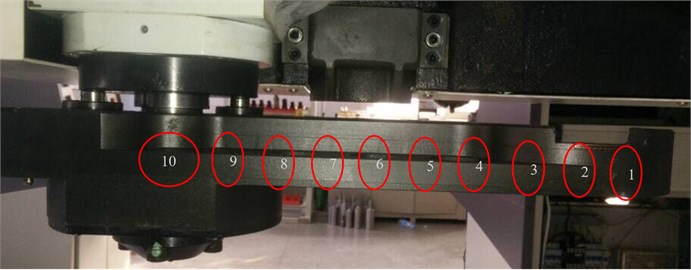
Fig. 6Vibration signals measured by vibration sensors fixed on different positions
3.4. Parameter settings of vibration sensors
During the process of changing the tool holder from a tool pocket to the virtual spindle, movements of geared motor of tool changing arm, grasping a tool holder, drawing a tool holder out of a tool pocket, inserting a tool holder into the virtual spindle, tool changing and returning to original position, are the main vibration reasons of ATC. The rotating speed of geared motor is 1420 r/min, in other words, the vibration frequency of geared motor is 23.67 Hz. The vibration frequency of geared motor is higher than that of the other movements. Only when the sampling frequency is double higher than the highest frequency of vibration signal, the original signal information can be reserved completely. So the sampling frequency of the sensor fixed on the system can be set as 50 Hz.
Fig. 7No. 1 position where the vibration sensor fixed when performing ATC vibration experiments
3.5. Vibration signals generated by tool changing
Fixing the sensor on the position mentioned above, vibration signals are measured during tool changing. Fig. 8 shows the vibration signals measured by the sensor in one circle and the scale of horizontal axis is 0.1 second. The vibration signals in Fig. 8 is measured from ATC whose pull nails don’t loosen.
The sampling time lasts long 16.2 seconds. Whereas, the tool changing arm needs about 3.5 seconds among the 16.2 seconds to complete one cycle of tool changing movement, which consists of grasping tool, drawing tool, tool arm rotating, inserting tool and tool changing arm returning to the original position. The period of vibration signals is about 14 seconds. In other words, the time between the beginning of tool changing and the value of vibration signals returning to original value is 14 seconds. For the reliability-testing system of ATC mentioned in this paper, the frequency of tool changing is set as 15 seconds longer than 14 seconds, so vibration signal of ATC would not be affected by the next vibration signal.
Fig. 8Waveform of the vibration signal generated during the procedure of tool changing
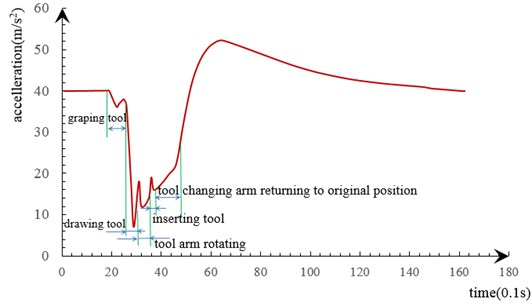
As seen in Fig. 8, the three inflection points occur at instants of grasping the tool holder, inserting tool and drawing the tool holder, what can be explained by that when the tool holder is grasped by the tool changing arm, there is a stiff impact between the tool changing arm and tool holder, when the tool holder is drawn from a tool pocket, there is a stiff impact between the tool changing arm and the tool pocket. Similarly, a stiff impact between the tool changing arm and the virtual spindle occurs when the tool is inserted into the virtual spindle. So three inflection points are generated during the procedure of tool changing. The curve of Fig. 8 illustrates the former analysis, exactly.
3.6. Procedure of contrast test
In view of the foregoing, vibration would be generated when ATC is running. For each tool holder, there are three variables what are known as the mass of the tool holder, the length of the tool holder, the severity of pull nails looseness. So questions are whether can we assume that there are some relationships between the vibration signals and the three variables respectively, whether can we find a threshold for predicting tools falling failure caused by pull nail looseness through the relationship and whether can we build a warning system for tools falling failure caused by pull nail looseness based on the threshold.
In order to calculate the correlation of the amplitude of the measured vibration signals with the mass of the tool holder, the length of the tool holder and the severity of pull nails looseness, the vibration tests are designed. The vibration test procedure used in the experiment is outlined as follows:
Before the test, the pull nails should be pre-tightened, which have the same severity looseness. And movements of tool changing should be conducted for 10 minutes before the vibration test, so the machine could be lubricated enough.
The test procedure of relationship between the vibration signals and the mass of the tool holder.
(1) Put the tools holders which have various masses into different tool pockets.
(2) Change a tool holder by tool changing arm, meanwhile, measure the vibration signals.
(3) Take another tool holder in tool magazine to the changing position, then repeat step (2), until all the tool holders are tested.
(4) Analyze the vibration signals.
The test procedure of relationship between the vibration signals and the length of the tool holder.
(1) Put the tools holders which have various lengths into different tool pockets.
(2) Change a tool holder by tool changing arm, meanwhile, measure the vibration signals.
(3) Take another tool holder in tool magazine to the changing position, then repeat step (2), until all the tool holders are tested.
(4) Analyze the vibration signals.
The test procedure of relationship between the vibration signals and the severity of pull nails looseness.
(1) In order to avoid dangerousness caused by tool falling, flying off and sticking, a tool holder whose length is the shortest and mass is the lightest is chosen to be the test subject.
(2) Change a tool holder by tool changing arm from the tool pocket to the virtual spindle then the virtual spindle to the tool pocket 10 times, meanwhile, measure the vibration signals.
(3) Take the pull nails to loosen in 90 degree, return the tool holder to the tool pocket manually, then repeat step (2).
(4) Repeat step (3) with the pull nails loosening in 90 degree increment until the severity of pull nails looseness is enough to lead to the tool holder falling onto the test bench support base.
(5) Analyze the vibration signals.
4. Vibration analysis
4.1. Analysis method
In this section, the vibration characteristics of ATC whose tool holders have different mass, different length and different severity of pull nails looseness are studied. The vibration characteristics are described by waveform , altitude , impulse and margin which are computed by Eqs. (1)-(4), respectively:
where:
where is the instant amplitude of vibration signals.
In order to compute the relationship between mass of tool holders or length of tool holders or the severity of pull nails looseness and waveform or altitude or impulse or margin , correlation analysis is needed. Correlation coefficient is computed as follows.
where is mass of tool holders or length of tool holders or the severity of pull nails looseness and is waveform or altitude or impulse or margin .
4.2. Vibration tests with different tool holder mass and tool holder length
4.2.1. Data analysis
Vibration characteristics are computed according to the method above. The waveform , altitude , impulse and margin of vibration signals of tool holders with different mass are shown in Table 1 and the waveform , altitude , impulse and margin of vibration signals of tool holders with different length are shown in Table 2.
Data in Table 1 are obtained through the following way. Take the first line as an example, when the tool holder is 1.18 kg, the vibration signals are measured. Then take the measured data into Eqs. (1)-(4), so , , and are obtained. If tool holder is changed, , , and would change.
Data in Table 2 are obtained through the following way. Take the first line as an example, when the length of the tool holder is 50 mm, the vibration signals are measured. The measured data are taken into the Eqs. (1)-(4), , , and are obtained. If tool holder length is changed, , , and would change.
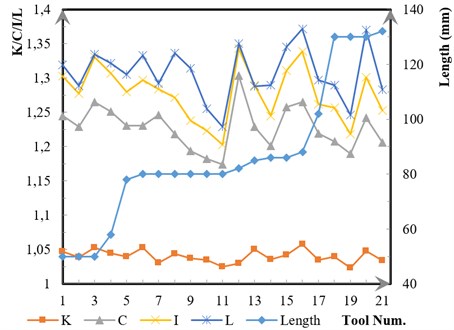
Fig. 9 and Fig. 10 show trends of vibration characteristics with different tool mass and length, respectively. In Fig. 9, the -axis of the right side represents the tool holder mass and the unit is kilogram, the -axis on the left side represents the values of , , and and the unit is 1. In Fig. 10, the -axis on the right side represents the tool holder length and the unit is millimeter, the -axis on the left side represents the values of , , and and the unit is 1.
Table 1Vibration characteristic indexes when performing ATC vibration experiments with different tool holder mass
Tool No. | Mass (kg) | Tool No. | Mass (kg) | ||||||||
1 | 1.18 | 1.047 | 1.245 | 1.303 | 1.319 | 12 | 1.72 | 1.024 | 1.174 | 1.203 | 1.230 |
2 | 1.18 | 1.039 | 1.229 | 1.277 | 1.289 | 13 | 1.78 | 1.030 | 1.304 | 1.342 | 1.350 |
3 | 1.18 | 1.053 | 1.265 | 1.331 | 1.335 | 14 | 1.96 | 1.050 | 1.229 | 1.290 | 1.288 |
4 | 1.20 | 1.045 | 1.251 | 1.307 | 1.322 | 15 | 2.18 | 1.058 | 1.265 | 1.339 | 1.372 |
5 | 1.68 | 1.040 | 1.208 | 1.257 | 1.290 | 16 | 2.22 | 1.036 | 1.201 | 1.245 | 1.290 |
6 | 1.68 | 1.023 | 1.190 | 1.217 | 1.246 | 17 | 2.39 | 1.035 | 1.219 | 1.262 | 1.297 |
7 | 1.72 | 1.053 | 1.232 | 1.297 | 1.333 | 18 | 2.5 | 1.040 | 1.231 | 1.280 | 1.305 |
8 | 1.72 | 1.030 | 1.246 | 1.284 | 1.292 | 19 | 2.8 | 10.02 | 1.258 | 1.310 | 1.345 |
9 | 1.72 | 1.044 | 1.218 | 1.272 | 1.336 | 20 | 2.88 | 1.039 | 1.206 | 1.253 | 1.283 |
10 | 1.72 | 1.037 | 1.194 | 1.238 | 1.314 | 21 | 3.82 | 1.048 | 1.242 | 1.301 | 1.370 |
11 | 1.72 | 1.035 | 1.182 | 1.223 | 1.255 |
Table 2Vibration characteristic indexes when performing ATC vibration experiments with different tool holder length
Tool No. | Length (mm) | Tool No. | Length (mm) | ||||||||
1 | 50 | 1.047 | 1.245 | 1.303 | 1.319 | 12 | 82 | 1.030 | 1.304 | 1.343 | 1.350 |
2 | 50 | 1.039 | 1.229 | 1.277 | 1.289 | 13 | 85 | 1.050 | 1.229 | 1.290 | 1.288 |
3 | 50 | 1.053 | 1.265 | 1.331 | 1.335 | 14 | 86 | 1.036 | 1.201 | 1.245 | 1.290 |
4 | 58 | 1.045 | 1.251 | 1.307 | 1.322 | 15 | 86 | 1.042 | 1.258 | 1.311 | 1.345 |
5 | 78 | 1.040 | 1.231 | 1.280 | 1.305 | 16 | 88 | 1.058 | 1.265 | 1.339 | 1.372 |
6 | 80 | 1.053 | 1.231 | 1.297 | 1.333 | 17 | 102 | 1.035 | 1.219 | 1.262 | 1.297 |
7 | 80 | 1.031 | 1.246 | 1.284 | 1.292 | 18 | 130 | 1.040 | 1.208 | 1.257 | 1.290 |
8 | 80 | 1.044 | 1.218 | 1.272 | 1.336 | 19 | 130 | 1.023 | 1.190 | 1.218 | 1.246 |
9 | 80 | 1.037 | 1.194 | 1.238 | 1.314 | 20 | 130 | 1.048 | 1.242 | 1.301 | 1.370 |
10 | 80 | 1.035 | 1.182 | 1.223 | 1.255 | 21 | 132 | 1.034 | 1.206 | 1.253 | 1.283 |
11 | 80 | 1.025 | 1.174 | 1.203 | 1.229 |
From Fig. 9 and Fig. 10, it can be seen that , , and approach a constant with the increase of mass or length of tool holders and that , , and are equal to each other when tool holder length is different. So we can suppose that there is almost no relationship between (, , ) and mass or length of tool holders in some degrees. In order to study the relationship carefully, correlation analysis should be developed.
Fig. 9Vibration characteristic indexes when performing ATC vibration experiments with different tool holder mass
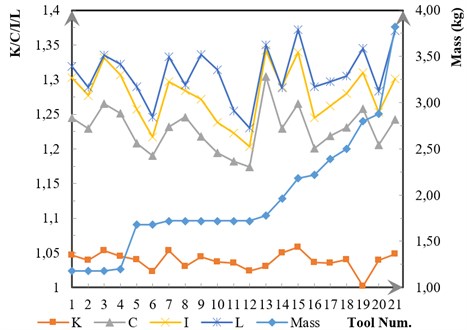
Fig. 10Vibration characteristic indexes when performing ATC vibration experiments with different tool holder length
4.2.2. Correlation analysis
Correlation coefficients between mass or length of tool holders and vibration characteristic (, , , ) can be computed by Eq. (5). Take as an example. Take all mass of tool holders and in Table 1 into Eq. (5), then can be obtained. The other characteristic indexes can be computed in the same method. All characteristic indexes are shown in Table 3 and Table 4, respectively.
As shown in Table 3 and Table 4, all correlation coefficients approach zero. Therefore, vibration signals of ATC whose tool holder mass within 1 kg to 4 kg and length within 50 mm to 132 mm are irrelevant to mass and length of tool holders. The correlation coefficients are so small, so vibration signals have nothing to do with the tool holder mass and tool holder length.
Table 3Correlation coefficients between mass of tool holders and vibration characteristic indexes
0.0001 | 0.0001 | 0.0001 | 0.0001 |
Table 4Correlation coefficients between length of tool holders and vibration characteristic indexes
0.0001 | 0.0001 | 0.0001 | 0.0001 |
4.3. Vibration tests with different severity of pull nails looseness
A tool holder of BT40-MTA3-70 type whose pull nails vary in different looseness are chosen to carry out the contrast tests. At the beginning of the test, the pull nail on the tested tool holder doesn’t loose, what is considered as in the normal condition. Then the pull nails are in different severity states (90 degrees increments according to the test procedure).
It must be explained in detail that how to choose the max value of the loosen degrees in the test. Take the severity of pull nails looseness which is enough to lead to a tool falling failure as a reference. Get the max value by the following way: observe whether or not the tool falls with the pull nails loosening in 90 degree increment step by step. Then find that when the pull nails loose in 0-450 degrees, tool falling failure would not occur; when the pull nail loosen 500 degrees which is increase 90 degrees on the base of 450 degrees, there is two times of tool falling failure in ten times of tool changing averagely; when the pull nail loosen 550 degrees, there is five times of tool falling failure in ten times of tool changing averagely which is so frequent. So we take 450 degrees as the end value which means the tool falling failure can’t but will occur. In other words, 450 degrees is the threshold for tool falling failure in the view of the severity of pull nails looseness. Therefore, vibration tests with different degrees of pull nails loosening is conducted from 0 to 450 degrees with the interval of 90 degrees.
The vibration signal waveform of a tool holder without looseness is shown in Fig. 11. Then the vibration signals waveform of tool holders with different severity of pull nails looseness are shown in Figs. 12-16 (from 90 to 450 degrees in order), respectively.
Fig. 11Vibration signal of the pull nail loosening 0 degrees
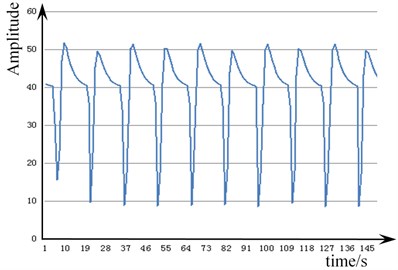
Fig. 12Vibration signal of the pull nail loosening 90 degrees
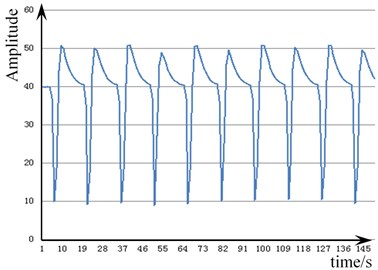
Fig. 13Vibration signal of the pull nail loosening 180 degrees
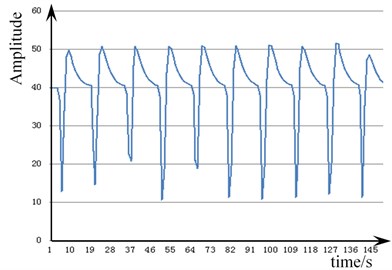
Fig. 14Vibration signal of pull nail loosening 270 degrees
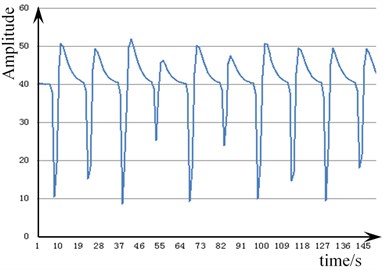
Fig. 15Vibration signal of the pull nail loosening 360degrees
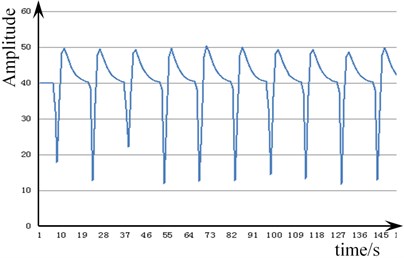
Fig. 16Vibration signal of the pull nail loosening 450 degrees
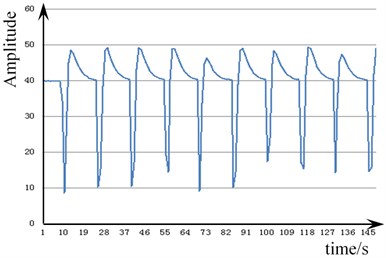
The vibration signal in Fig. 11 is obtained from ATC whose pull nails don’t loosen. The sampling time lasts 199 seconds. Because the frequency of tool changing is set as 15 seconds one time in advance, so there are about 13 circles in 199 seconds. Each circle contains steps of grasping tool, drawing tool, tool arm rotating, inserting tool and tool changing arm returning to the original position. The waveform of each circle of vibration signals in Fig. 11 is similar to the waveform in Fig. 8, three inflection points are generated during the procedure of tool changing and there is the maximum value and the minimum value in every circle.
The same situation appeares in Figs. 12-16 which show the vibration signals of the pull nail loosening 90, 180, 270, 360, 450 degrees, respectively. Seen from Figs. 11-16, the cycle and shape of waveforms are similar, because they are determined by the same procedure of tool changing. All signal periods in Figs. 11-16 are 15 seconds.
But there should be some differences in the maximum and minimum amplitude, because they are determined by the whole system. As long as there is a little different in the whole system, the maximum value and the minimum value must be different. As a matter of fact, the maximum value in Fig. 11 is 51.97, the maximum value in Fig. 12 is 50.98, the maximum value in Fig. 13 is 52.1, the maximum value in Fig. 14 is 50.21, the maximum value in Fig. 15 is 49.66, and the maximum value in Fig. 16 is 47.76. They are all different, because there are some differences in the severity of pull nails looseness.
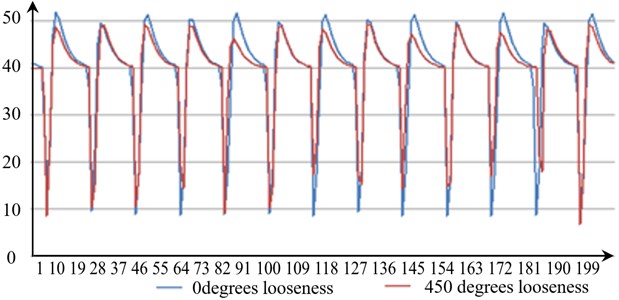
It can be seen from Fig. 11 to Fig. 16, when the pull nails loosen differently, the waveform and periods of vibration signal are the same as that in the normal condition, but the maximum amplitude changes obviously. Comparing the vibration signals of pull nails loosening 0 and 90 or 450 degrees seen from Fig. 17 and Fig. 18, the waveform of pull nails loosened 0 degree coincides with that of pull nails loosened 90 degrees, so the pull nails loosened 90 degrees has no or little influence on tool changing. While the maximum amplitude of pull nails loosened 450 degrees is obviously less than that of 0 degree, so the pull nails loosened 450 degrees has great influence on tool changing.
Fig. 17Comparison diagram of vibration signals with 0 and 90 degrees looseness
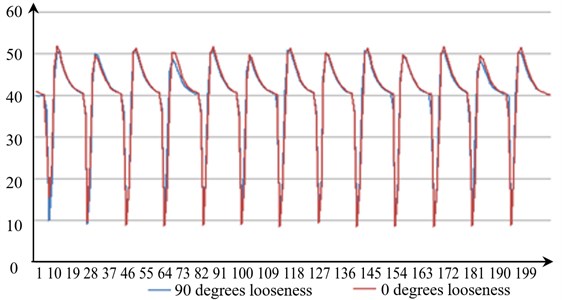
Fig. 18Comparison diagram of vibration signals with 0 and 450 degrees looseness
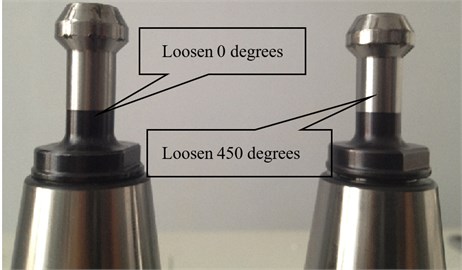
Comparing pull nail loosening 0 and 450 degrees, pull nail loosening 450 degrees has already loosened 1.25 (450/360) times of pitch, what can be seen from Fig. 19. The pull nail is M8 and the standard pitch is 1.25 mm, so the distance of pull nail loosening is about 1.56 mm. It is meaning that there will be an obvious mistake position when the tool changing arm clamps the tool holder, what is about to lead to the tool falling. So when the tool changing arm grasps the tool holder, it would not click into the neck of the tool holder correctly. But the sensor fixed on the tool changing arm still recognizes the tool changing arm in the correct place and the pulling signal is still sent to PLC normally. When PLC recognizes the pulling signal, it would perform subsequent actions. So the tool holder is still taken out from the tool pocket without grasped by the tool changing arm firmly. There is a hidden danger of tool falling. However, the severity of pull nail looseness cannot be found easily by the visual inspection. Fortunately, comparing Fig. 11 to Fig. 16, a fuzzy increase trend of the maximum amplitude with pull nails loosening from 0 to 450 degrees can be found. So there may be some relationship between the maximum amplitude and the severity of pull nails looseness. Therefore, the threshold of the severity of pull nails looseness can be replaced by the threshold of vibration signals. So the warning system of tool falling can be built based on the threshold of vibration signals.
Fig. 19Tool holder states when pull nails loosen 0 and 450 degrees
4.4. Vibration thresholds
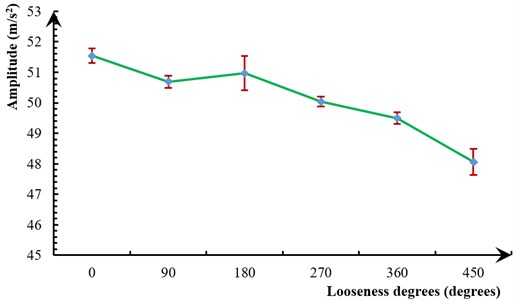
As is analyzed above, there are some relationships between the maximum amplitude of the vibration signal and the severity of pull nails looseness, so in this section, the relationship is developed with polynomial fitting method. In order to avoid accidental factors, the test is repeated 3 times according to the test procedure. Table 5 shows the maximum amplitude of vibration signals measured in three experiments with different pull nails looseness severity.
In addition, error analysis of three experiments is conducted. In the error analysis, the averages, standard deviations and standard errors of three experiments are calculated. The averages, standard deviations and standard errors are shown in Table 5 and the error bar of three experiments is shown in Fig. 20. This distribution of data values is often represented by showing a single data point, representing the mean value of the data, and error bars to represent the overall distribution of the data. The average is a way of summarizing a group of data and stating a best guess at what the true value of the dependent variable value is for that independent variable level. So we make averaging here. Take the values of the pull nail loosening 0 degrees for example, according to Table 5, we can state that, based on the measurements, the maximum amplitude of the vibration signal when the pull nail loosening 0 degrees is 51.54±0.24 m/s2. The ±0.24 value is the standard error and expresses how confident that the average (51.54) represents the true value of the average maximum amplitude of the vibration signal. Graphically represent this in error bars as is shown in Fig. 20. The error bars shown by the line graph represent a description of how confident that the average represents the true average maximum amplitude of the vibration signal. The measurements have a little error and the dispersion of values is too weak. So the measured results can be accepted. If the upper error bar for one pull nail loosening degree overlaps the range of the average maximum amplitude of vibration signal within the error bar of another pull nail loosening degree, there is a much lower likelihood that these two average maximum amplitudes of vibration signals differ significantly. Therefore, the average maximum amplitude of the vibration signal at 360 degrees is significantly greater than at 450 degrees in some confidence. We can also say the same of the average maximum amplitude of the vibration signal at 270 degrees from 360 degrees, 180 degrees from 270 degrees, 0 degrees from 90 degrees. However, we are much less confident that there is a significant difference between 90 and 180 degrees. It can improve confidence through taking more measurements and shrinking the standard error, but the varying tendency of vibration amplitude with the severity of pull nails looseness is very obvious through three experiments. So more times of experiments were not conducted in our research.
Table 5Maximum amplitudes of vibration signals with different looseness severity of pull nails
Looseness degrees / degree | 0 | 90 | 180 | 270 | 360 | 450 |
First experiment / m/s2 | 51.97 | 50.98 | 52.1 | 50.21 | 49.66 | 47.76 |
Second experiment / m/s2 | 51.49 | 50.78 | 50.49 | 49.7 | 49.11 | 48.91 |
Third experiment / m/s2 | 51.16 | 50.31 | 50.32 | 50.21 | 49.7 | 47.51 |
Average / m/s2 | 51.54 | 50.69 | 50.97 | 50.04 | 49.49 | 48.06 |
Standard deviation / m/s2 | 0.41 | 0.34 | 0.98 | 0.29 | 0.33 | 0.75 |
Standard error / m/s2 | 0.24 | 0.20 | 0.57 | 0.17 | 0.19 | 0.43 |
Fitting it with polynomials, the relationship between the average and the severity of pull nails looseness can be obtained. The relationship is shown as follows:
where represents the severity of pull nails looseness with the unit degree; is the average maximum amplitude of the vibration signal with the unit m/s2.
Fig. 20Error bar of three experiments
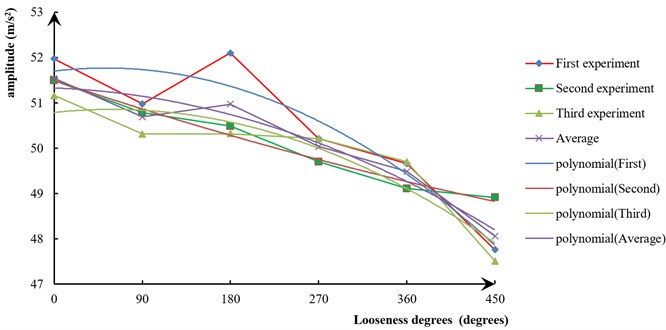
The relationship between the maximum amplitude of the vibration signal and the severity of pull nails looseness is determined and shown as Eq. (6). The relative coefficient is 0.95 which is greater than 0.8, so there is obvious relationship between the looseness severity of pull nails and the maximum amplitude of the vibration signal. On the whole, when the severity of pull nails looseness grows, the maximum amplitude of vibration signal decreases. The existence of tendency above is also proved by Fig. 21 shown as follows. Fig. 21 shows the varying tendency of three experiments and the average of three experiments together.
Trends (Fig. 21) are helpful to develop the vibration threshold if take the vibration signal as warning information of tool falling failures. It can be seen that when the severity of pull nails looseness gets serious, the maximum amplitude of the vibration signal decreases. It is also known to all that when the severity of pull nails looseness gets more serious, tool falling failures would occur. And the severity of pull nails looseness can be predicted through some signals which can be obtained by sensors easily. So we can take the maximum amplitude of the vibration signal as tool falling failures warning signals, then choose a less intercept as the threshold of the tool falling failure.
Fig. 21Trends of the average maximum amplitude of the vibration signal
In general, based on the relationship mentioned above, the average maximum amplitude of the vibration signal measured when the severity of pull nails looseness is 450 degrees can be developed as the threshold and the value should be 48.06. In order to ensure all tool falling failures caused by pull nails looseness can be predicted, the average maximum amplitude of vibration signals measured three times when the severity of pull nails looseness is 450 degrees can be developed as the threshold and the value should be 48.91.
Then, a simple warning system is developed with IPC in reliability test bed of ATC. In the warning system, set 48.91 as the vibration threshold of tool falling failure. The principle is that vibration signals measured by the sensor is imported into software in IPC, as long as the vibration signal measured by the sensor fixed near the claw of tool changing arm is more than 48.91, warning switch is triggered immediately, which means a tool falling failure would occur.
Using the reliability test bed of ATC, the reliability test is conducted for 5000 to 10000 hours (2 to 3 times of MTBF). Once the warning switch is triggered, operators are called to pre-tighten the corresponding pull nails. There is no tool falling failure caused by pull nails looseness occur. So the warning system is useful.
When the other tool holders are applied to the same experiment, their warning information can be computed in the same way.
5. Conclusions
This paper proposes a tool falling failure warning method based on the vibration detection theory, and introduces the installation of vibration sensors on ATC. In addition, vibration analysis is conducted. In this study, the relationship function of vibration characteristic indexes and severity of pull nails looseness is developed.
1) Vibration tests of ATC with different mass (length) of tool holders and different severity of pull nails looseness have been conducted in this paper. And tests show that there is no relationship between the vibration maximum amplitude and mass (length) of tool holders, but the severity of pull nails looseness.
2) The relationship of the average maximum amplitude of vibration signals and severity of pull nails looseness is determined by the polynomial fitting method and the multinomial coefficients are –0.111, 0.151 and 51.28.
Tests prove that it is useful to prevent tool falling failures of ATC effectively by installing vibration sensors on ATC. If the other failure modes account for a large proportion of all failures, the preventive signal thresholds can be got in the same way.
References
-
Yang Z. J., Chen C. H., Chen F., Hao Q. B., Xu B. B. Reliability analysis of machine tools based on the field data. Maintenance and Reliability, Vol. 15, Issue 2, 2013, p. 147-155.
-
Han D. C., Lee D., Song Y. T., Lee S. G. Development of control system of high-speed ATC of machining center. Journal of the Korean Society for Precision Engineering, Vol. 19, Issue 9, 2002, p. 125-132, (in Korean).
-
Obreja C., Stan G., Andrioaia D. Design of an automatic tool changer system for milling machining centers. Applied Mechanics and Materials, Vol. 371, Issue 69, 2013, p. 69-73.
-
Kim J. H., Lee M. J., Lee C. M. A study on the development of ATC test bench for BT40. Proceedings of the KSTEM Autumn Conference, 2010, p. 223-225.
-
Kim J. H., Choi J. Y., Lee C. M. A study on the development and performance evaluation of an ATC test bench. Journal of the Korean Society for Precision Engineering, Vol. 29, Issue 5, 2012, p. 489-493.
-
Wang Y. J., Qi Y., Hui Y., Zang T. G. Reliability and failure analysis of automatic tool exchange system in horizontal machining center. Manufacture Information Engineering of China, Vol. 7, Issue 7, 2010, p. 75-78, (in Chinese).
-
Lee S. W., Lee H. K. Reliability evaluation of ATC for high-speed line center. Journal of Korean Society for Precision Engineering, Vol. 23, Issue 6, 2006, p. 111-118, (in Korean).
-
Yang Zhiwei, Ren Gongchang, Meng Bomin Reliability analysis of failure mode for machining center. Modular Machine Tool and Automatic Manufacturing Technique, Vol. 56, Issue 10, 2011, p. 10-16, (in Chinese).
-
Pan J. N., Kolarik W. J., Lambert B. K. Mathematical model to predict the system reliability of tooling for automated machining systems. International Journal of Production Research, Vol. 24, Issue 3, 1986, p. 493-501.
-
Zhang Genbao, Xu Zhi, He Wenhui Research on Reliability enhancement testing method of NC rotary table. Chinese Journal of Mechanical Engineering, Vol. 22, Issue 8, 2011, p. 948-951, (in Chinese).
-
Jin Y. Y., Feng H. T., Li C. M. The early malfunction test and the analysis method of chain machine and the manipulator. Modular Machine Tool and Automatic Manufacturing Technique, Vol. 12, 2012, p. 72-75, (in Chinese).
-
Ge Tian, Li Chuanmei, Feng Hutian Study on reliability growth test method for disc tool magazine. Modular Machine Tool and Automatic Manufacturing Technique, Vol. 11, 2012, p. 11-14, (in Chinese).
-
Yang Z.J., Chen C. H., Chen F., Li G. F. Progress in the research of reliability technology of machine tools. Chinese Journal of Mechanical, Vol. 49, Issue 20, 2013, p. 130-139, (in Chinese).
-
Li Y., Zhang Y., Sun H. Dynamic characteristics and optimal design of the manipulator for automatic tool changer. Journal of Vibroengineering, Vol. 16, Issue 1, 2014, p. 134-146.
-
Koziol Mateusz, Figlus Tomasz Evaluation of the failure progress in the static bending of GFRP laminates reinforced with a classic plain-woven fabric and a 3D fabric, by means of the vibrations analysis. Polymer Composites, Vol. 15, Issue 7, 2015, p. 1-16.
Cited by
About this article

Our deepest gratitude goes first to the editors and reviewers for their constructive suggestions on the paper. We would like to thank the Important National Science and Technology Specific Projects of China (2014ZX04014-011), National Natural Science Foundation of China (51505186), China Postdoctoral Science Foundation (No. 2015M580245), Science Research Plan of Jilin Province ([2015]472) and Special Industrial Base Construction Projects of Science and Technology Development Plan of Jilin Province (20130302009GX).
Chuanhai Chen conceived the idea of using vibration sensor to predict failures of tool magazine and designed the study; Jianhai Zhang and Hailong Tian conducted the majority of the experimental work and discussed the results; Xiaohui Shi and Chuanhai Chen wrote the manuscript; Lei Chen and Jun Bao analyzed the experimental data; Wei Duan edited the manuscript and checked grammatical and spelling errors.
