Abstract
Industry 4.0 relies on the adoption of digital technologies to gather data in real time and to analyse it, providing useful information to the manufacturing system. In this paper, what solutions modern production plants that are aspiring towards compliance with philosophy of the Industry 4.0 have to adopt, monitor and analyse the vibration data of the manufacturing systems using existing process and tool monitoring solutions. In addition, detailed explanation of vibration level reading in order to increase the protection of the production sources (machines, devices etc.) against human errors and malfunctions in terms of Total Quality Management (TQM) and Total Productive Maintenance (TPM) with the concept’s levels TPM1(operator level) and TPM2(periodic conditional reviews etc.) will be giving with a Montronix system’s integration on a CNC milling machine. Besides, optimization and monitoring function of production process will be demonstrated with related graphs and tables with values of different scenarios.
Highlights
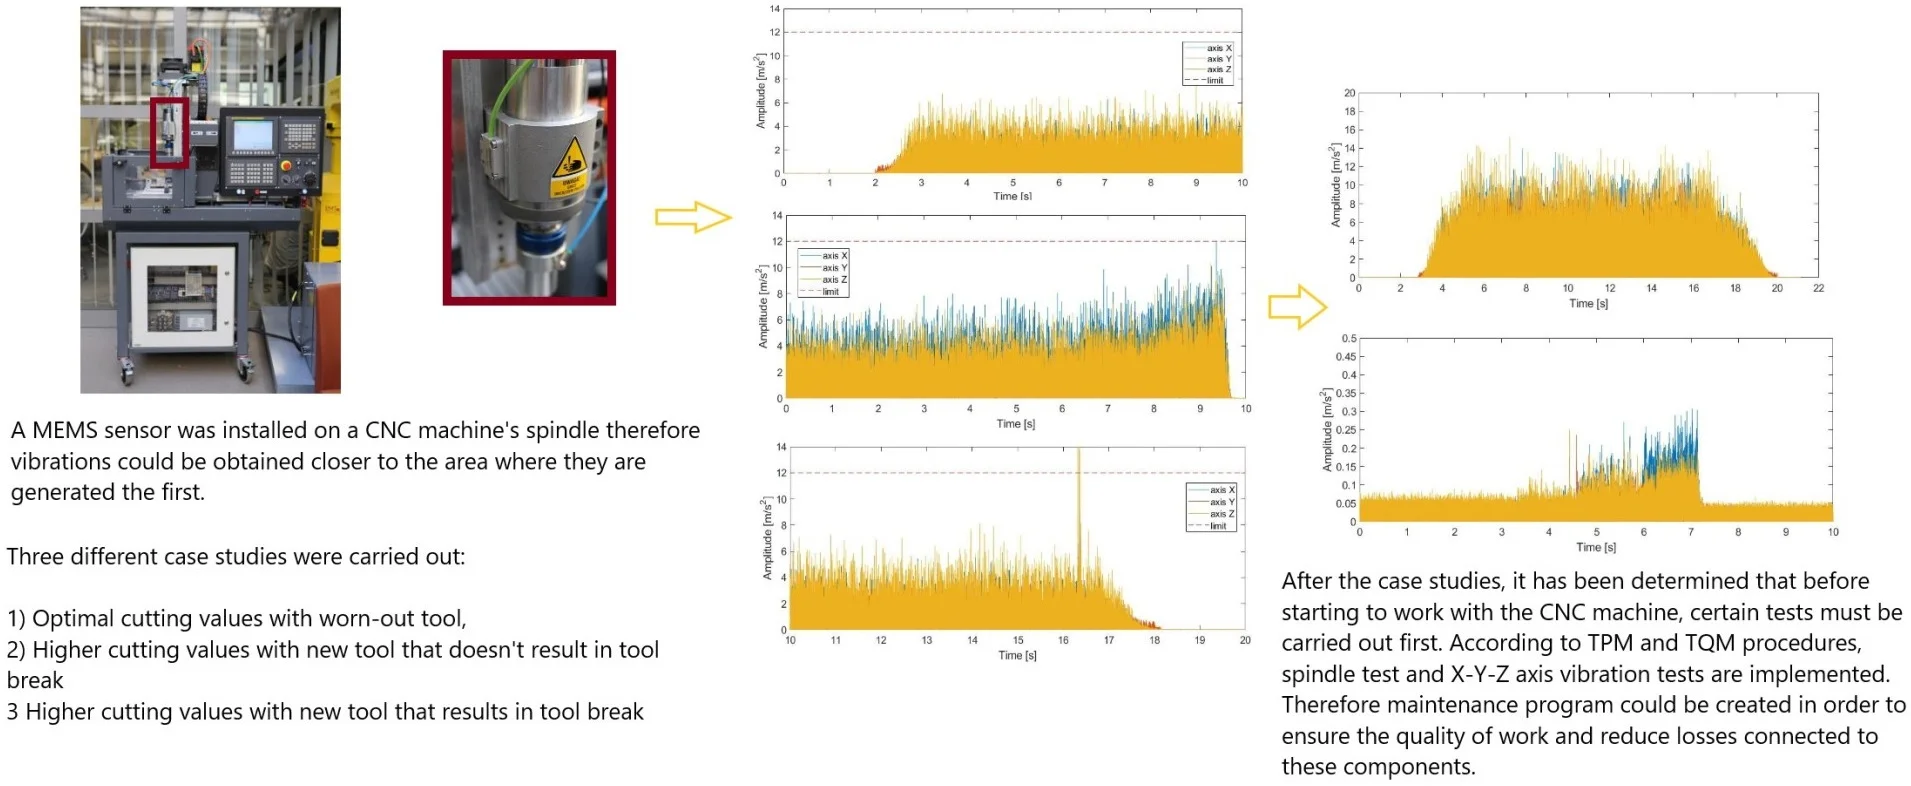
- A MEMS sensor has been installed on a CNC machine with Fanuc controller to measure vibrations for maintenance purposes.
- Several case studies such as using optimal cutting values with worn-out tool, higher cutting values with new tool has been performed and analyzed.
- After the analysis of case studies, a maintenance method has been chosen for according to TPM and TQM programs.
- According to the outputs, test results of the maintenance method has been shared.
1. Introduction
The concept of Industry 4.0 has been accompanying us since the early decades of the XXI. century. The concept of Industry 4.0 includes production technologies, process monitoring, storage of information, automation, computerization, data processing and sharing. It is based on the use of advanced monitoring and information transmission and management systems to optimize ongoing production processes [1]. The constant access to archival and current data as well as estimations regarding the duplication of processes in the future allows the optimal use of resources possible.
The idea included in Industry 4.0 allows, among other things, the implementation of the so-called predictive maintenance, or strategy for maintenance of machines and devices based on information and prediction. Distance sensors, temperature, pressure, vibration, torque power, flow rate, weight, deformation in real time – make measurements that make it possible to create a digital image of the production process. Each machine and device has their own internal and external sensors to control and assure the work which is being done. Information which is obtained from these sensors are stored and later processed to obtain necessary data to make predictions. When taking into consideration of CNC machines’ operation, it is possible to determine how many final parts will be machined from a given batch of material, how many cutting tools will be used to create a certain amount of parts, how many iterations later the machine tool should be replaced etc. These aspects effect the manufacturing process in an optimal or negative ways. Monitoring process makes it possible to modify it for an objective improvement.
Together with the increased requirements of precision in manufactured goods, machine tools and manufacturing systems are faced with constantly higher requirements [2]. It has been desired and often subject to researches to decrease the amount of all kinds of gradual failure of the cutting tools for such operations at high cutting speeds, high spindle rotation velocities and feed rates. It should be also taken into consideration that tools might be used for a large amount of material removals. Such cases will conclude in CNC machine to have chattering caused by self-excited vibrations. Having self-excited vibrations concludes undesired results such as precision errors, poor quality surface finish, tool wear and if not detected at the moment possible machine damages [3].
One of the major possibilities of protecting the CNC machine during the manufacturing process is to monitor the vibrations. When using vibration to observe machine health, the objective is to correlate observable vibration with typical wear-out mechanisms such as bearings, gears, chains, belts, brushes, shafts, coils and machine tools. In a typical CNC machine, at least one of these mechanisms and the tools require regular maintenance. Using actual observations such as vibration, provides an opportunity to take quick action when warning conditions are detected [4].
2. Architecture of the solution
Equipment vibration signal contains many important information in the system, parts and components such as wear, aging and fatigue caused by factors such as deterioration and failure etc. It is possible to monitor equipment running condition and fault type, fault source identification equipment. The vibration signal of the equipment is picked up and recorded by means of a variety of dynamic testing instruments. Later it is analysed and processed by the signal processing technology.
MEMS sensors have significant role in the acceleration measurements of today’s technology. Possibility to be produced in small sizes, need for lower power, the ease of their integration and their functionality enable innovation in gadgets such as smartphones, gaming controllers etc. The continuous advancement in functional integration and performance has also helped MEMS accelerometers and gyroscopes find their way into many different industrial systems [4].
Fig. 1Architecture of the vibration monitoring system
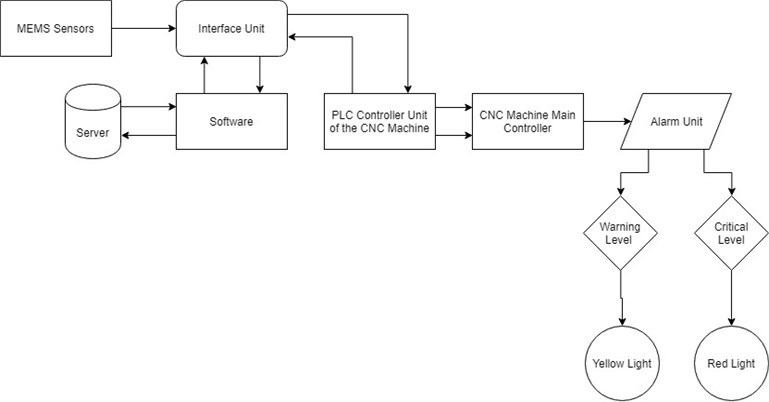
Vibration monitoring system works as a loop in a system. Integrated sensor sends vibration signals to the interface unit. Software, which is dedicated and connected with the interface unit, specifies the warning level and critical level values. The system analysis the spectrum and time waveforms when there’s any suspicion of a fault condition. The spectrum is a summary of the vibration within the machine. Fast Fourier Transform (FFT) uses the time waveform to calculate how much of each frequency is present and displays it in the line spectrum. The waveform is a record of what has occurred each moment as spindle works, motors try to move the axis, the gears mesh etc. For example, if there is damage on the inner race of a bearing, there will be an impact each time the ball or roller encounters the damaged area. It will be seen in the spectrum as harmonics of a frequency that is not a multiple of the shaft turning speed with sidebands. Impacts are also observable in the time waveform [5].
The sensor selection and signal-processing architecture depends on the application’s objectives. The signal chain shown in Fig. 1 continuously monitors the specific frequency band, provides warning and critical lights. In this paper, Montronix solutions is chosen to integrate to the machine. The features of Montronix systems enables to conduct the monitoring process as continuous vibration monitoring.
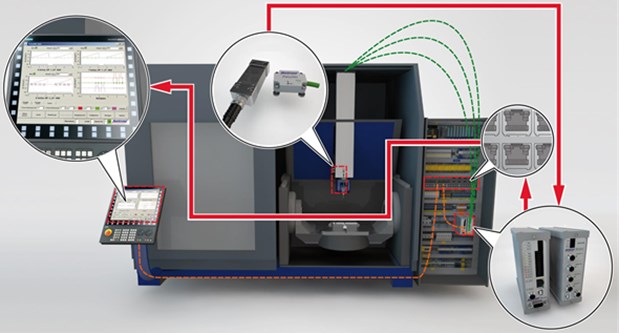
The following Fig. 2 illustrates how the integration is done.
The module consists of several parts:
a) MEMS Sensor (PulseNG).
b) IBU-NG Interface Bus Unit with rail attachment according to EN 50022.
c) Software which controls the unit (PulseNG –HMI).
Fig. 2An illustration of how the monitoring system is integrated to the CNC machine
2.1. MEMS sensor (PulseNG)
MEMS sensors have significant role in the acceleration measurements of today’s technology. Possibility to be produced in small sizes, need for lower power, the ease of their integration and their functionality enable innovation in gadgets such as smartphones, gaming controllers etc. The continuous advancement in functional integration and performance has also helped MEMS accelerometers and gyroscopes find their way into many different industrial systems [4].
As a type of MEMS sensor, PulseNG is a permanently installed diagnostic tool. After the installation of the sensor, it will be connected to the IBU-NG interface, which is housing of the electronic board via cable that will later be connected to the PLC controller of the machine to work simultaneously. PulseNG sensor consists of following specifications, shown in Table 1.
Fig. 3Montronix PulseNG MEMS sensor
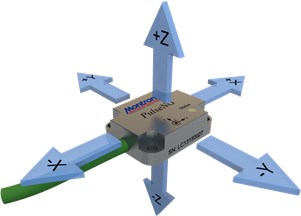
Table 1PulseNG MEMS sensor specifications table
Dimensions (H×W×D) | 30×40×11 mm |
Housing | Cast aluminium |
Weight | 100 g |
Protection class | IP67 |
Operation temperature range | 0 °C to 70 °C |
Storage temperature range | –40 °C to 70 °C |
Relative humidity | 0 to 100 % |
Connection | PUR cable with M8, 4-pin male plug |
Sensor type | MEMS |
Measurement range | ±60 m/s2 (± 6 g) |
Linearity | 0.1 % F.S. |
Interference | < 2 % |
Band width | 1350 Hz |
Resolution (± 2G / ± 6G) | 0,01 m/s2 / 0,03 m/s2 |
Signal sampling rate | 3248 values/second per axis |
Shock resistance | 9810 m/s2 |
Temperature sensor | 0 °C to 70 °C, absolute error 1 °C |
2.2. IBU-NG interface bus unit
The interface bus unit contains electronical components which reads the pulses from the MEMS sensor. After setting up the parameters in the software, the interface bus unit takes place after analysing the limitations and the vibrations which are read by the MEMS sensor.
Generally, in every facility production sources have their alarm units to inform users about the conditions that the machine is facing. In the case of detecting any type of over the limit vibrations, it can be arranged that in such cases machine will act and change the tool, or completely stop the machine and give user a red light in the alarm tower to indicate that a problem occurred during the process.
In this paper, the interface unit has specifications as stated by Table 2.
Table 3 explains each function that is stated on the interface bus unit.
Table 2IBU-NG interface bus unit specifications
Dimensions | 121×42×120 mm |
Protection class | IP40 |
Operation temperature range | 0 °C to 50 °C |
Storage temperature range | –20 °C to 70 °C |
Relative humidity | 0 to 95 % |
Voltage supply | 18-30 V DC |
Current consumption | 300 mA max. |
Reaction time | < 1 ms |
Inputs | 18-30 V DC, 20 mA |
Outputs | 30 V DC, 100 mA |
EMC (electromagnetic compatibility) | EN 61326-1:2006-5 |
2.3. PulseNG-HMI software
Software which comes together with the PulseNG kit is the key to access the monitoring function, set up the vibration limits, prepare scenarios such as collision, tool wear, tool breaks, rotating element errors, unbalanced machine elements errors etc.
As the MEMS sensor can diagnose vibrations in -- axis, there are three different sections dedicated to each one of them and another window dedicated to raw data which combines each axis vibrations in one window with different identification colours (Fig. 7).
By clicking to the “Config” option, the software enables users to make modifications in settings of the software. Scenarios, sensor selections and other service options are gathered in this window. When it is required to create scenarios for implementations, software allows access to following options:
– Diagnostic options (acceleration (m/s2) and velocity (m/s));
– Vibration limit (according to which diagnostic option is selected);
– Axis selection (Channel);
– Delay (ms);
– Limit type (lower or upper);
– Emergency stop option;
– Alarm suppress;
– HP (high pass) filter (Hz);
– Latching enabler;
– Alarm count value;
– Window size;
– DSP (Digital Signal Processor) (Peak to Peak, Average, Area, RMS);
– DSP scale value;
– Target value.
Possible limit values are in between 0.1 m/s2 and 150 m/s2. When the alarm suppress option is enabled, alarm outputs and emergency shut-off will not be triggered. There will only be entries into the event log. High pass filter value can be from 0 Hz to 1600 Hz. When latched option is activated, the outputs will be switched until the alarms are deleted. When deactivated, the outputs will be switched for the length of time specified in “Delay”. Low Pass filter value can be from 0 Hz to 1600 Hz. Emergency stop option determines whether exceeding the respective limit will activate the OUT4 (machine emergency stop) or not (Table 3).
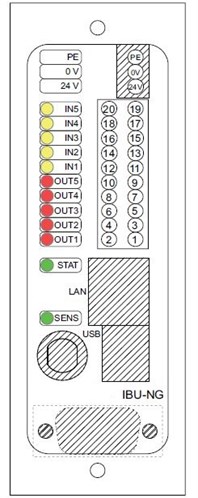
Fig. 4Interface bus unit labelling
3. Integration of the vibration monitoring system to the CNC milling machine
In Fig. 5, the vertical 3-Axis CNC milling machine, which is used to carry out the case studies for this paper is shown. The milling machine is designed by EMT-Systems Sp. z o.o. engineers and equipped with Fanuc Series 0i-MD controller. The main controller works together with Siemens Sirius PLC controllers. and axis is driven by Fanuc βiA128 motor, axis is driven by Fanuc βiS-2/4000 Servo motors. In order to make sure that axis linear guideways will function smoothly, lubrication process is done according to the instructions of the manufacturer.
Table 3Interface unit labelling and functions
PE | Ground |
0 V | GND voltage supply |
24 V | +24 V voltage supply |
IN5 | Reset, delete errors |
IN4 | Monitor Active |
IN3 | Bit 3 (Value 4) of scenario number |
IN2 | Bit 2 (Value 2) of scenario number |
IN1 | Bit 1 (Value 1) of scenario number |
OUT5 | Ready |
OUT4 | Machine Emergency Stop |
OUT3 | Limit 3 triggered |
OUT2 | Limit 2 triggered |
OUT1 | Limit 1 triggered |
STAT | LED for IBU-NG status |
SENS | LED for sensor status |
This CNC machine has been designed in order to provide trainings, perform small-scale milling jobs, process soft materials and carry out such experiments with vibration monitoring systems. For this reason, drives structures are minimized (15 mm thickness linear guideways).
Machine condition monitoring is an important part of condition-based maintenance, which is becoming recognized as the most efficient strategy for carrying out maintenance in a wide variety of industries. Machines were originally ‘run to break’, which ensured maximum operating time between shutdowns, but meant that breakdowns were occasionally catastrophic, with serious consequences for safety, production loss and repair cost. The first response was ‘preventive maintenance’, where maintenance is carried out at intervals such that there is a very small likelihood of failure between repairs. However, this result in much greater use of spare parts, as well as more maintenance work than necessary.
Fig. 53-Axis vertical CNC machine that is used to carry out this paper
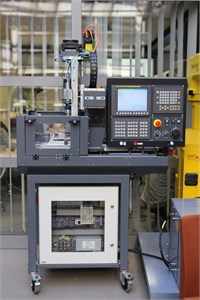
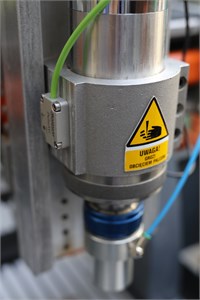
Fig. 6Machine spindle and the surface where MEMS sensor is mounted
Even when a machine is in a good condition, it generates vibrations. Many such vibrations are directly linked to periodic events in the machine’s operation, such as rotating shafts, meshing gear teeth, rotating electric fields etc. The frequency with which such events repeat often gives a direct indication of the source and thus many powerful diagnostic techniques are based on frequency analysis [6].
In order to monitor the vibrations, integration of the system is done according to the operating manual of the manufacturer. Firstly, the MEMS sensor is integrated to the place where it is optimal to obtain the vibration values. The spindle of the CNC machine is decided to be the ideal place to mount the sensor since the vibration which will be caused by incorrect working values will be firstly generated by the tool (Fig. 6). To be able to observe the closest values, the MEMS sensor is attached on the spindle housing which is made of cast aluminium material.
IBU-NG interface housing is mounted in the cabinet below the machine where the PLC and electronical controllers are placed (See Fig. 5). It is integrated with the Siemens Sirius PLC controllers to be able to process the signals which are detected by the IBU-NG interface. To make the correct installation, following wiring diagram that is provided by manufacturer is followed (Fig. 7).
Fig. 7IBU-NG wiring diagram
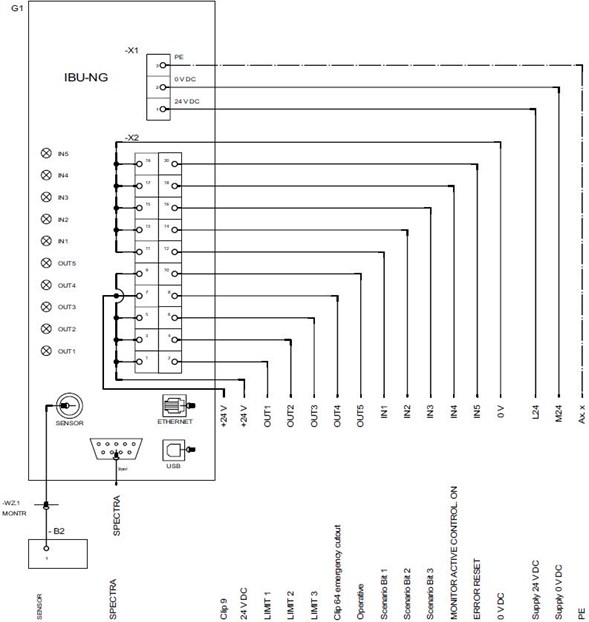
Table 4Labelling of wiring diagram and PLC output/inputs
Labelling | Voltage | Terminal | Terminal | PLC Outputs/Inputs |
IN5 | 0 V | 19 | 20 | O Reset, delete errors |
IN4 | 0 V | 17 | 18 | O Monitoring ON |
IN3 | 0 V | 15 | 16 | O Bit 3 of scenario number |
IN2 | 0 V | 13 | 14 | O Bit 2 of scenario number |
IN1 | 0 V | 11 | 12 | O Bit 1 of scenario number |
Out5 | +24 V | 9 | 10 | I Ready |
Out4 | +24 V | 7 | 8 | I Terminal HW machine emergency stop |
Out3 | +24 V | 5 | 6 | I Limit 3 triggered |
Out2 | +24 V | 3 | 4 | I Limit 2 triggered |
Out1 | +24 V | 1 | 2 | I Limit 1 triggered |
4. CNC machine monitoring case study
After wiring process, the interface housing is connected to the computer via Ethernet cable to a PC where the control software is installed. To be able to connect the interface to the computer, dedicated IP address should be inserted to the PC’s Ethernet card. It is as follows; 192.168.1.240. After changing of the IP address, the stable position vibrations will be shown with the default settings of the software. Several scenarios are set according to the manufacturer’s suggestions. The first scenario is dedicated to the tool crashes, the second scenario is dedicated to detecting vibration overloads, and third scenario is reserved for ATC tool change process. Others scenarios from fourth to eighth can be dedicated to variety of conditions such as good/bad, wear or no wear, trend of wear of machine components, ball screws, linear guides, spindle, bearing etc.
The input values of each scenarios in the software are arranged in Table 5.
Table 5Input values of the control software
Scenario number | 1st (detecting collision) |
Signal type | Acceleration (m/s2) |
Channel | Module |
Teach multiplier | 1.5 |
Limit | 12.0 |
Limit type | Upper |
Latched | Enabled |
Emergency stop | Enabled |
Alarm suppressed | Disabled |
HP filter | 20 Hz |
LP filter | 1600 Hz |
Alarm count | 0 |
DSP | Average |
As it will be shown in this study, the vibrations which will be diagnosed can be analysed and used for maintenance planning. To carry out the study, diagnostics from three different cases will be investigated. The cases, which are investigated in this paper, are decided for the most common errors which can be seen in every CNC machine. Generally caused by not enough trained and inattentive operators or wrong calculations and predictions. Generally, the material and the tool that will be used for the milling operations provides information to the operator to set the correct values but it is often seen that parameters are being set incorrectly.
Fig. 8Measured vibrations of the machine when there is no milling process started
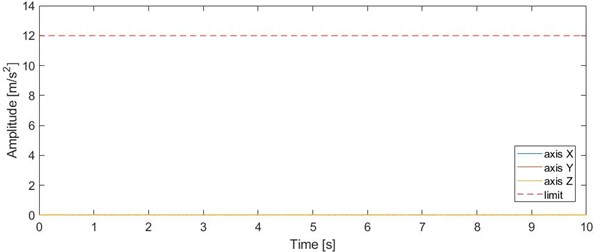
In Fig. 8, the raw data received from , and axis which are defined with different colours. axis is represented by blue, axis is represented by red and axis is represented by yellow coloured peaks. Working motors and shafts in the machine cause natural vibrations. When a milling process is running, raw data graphs help observing each data form every axis in the same place.
Table 6Mean of the signal that is taken from the measurement and standard deviation of the RMS function (for Fig. 8)
Mean value | 0.0013 | 0.0017 | 0.0019 |
Standard deviation | 0.0009 | 0.0011 | 0.0013 |
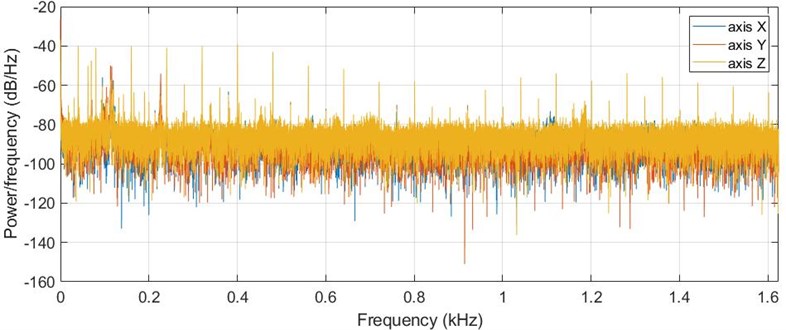
Fig. 9Power spectral density (PSD) of the vibrations which are measured when there is no milling process
4.1. Using worn-out tool with optimal values of feed rate and depth of cut
The vibrations in Fig. 10 can be analysed ass the tool that is used, is not in a very good condition. Between 3rd and 4th and 9th and 10th seconds we can read a sudden peak in axis vibrations, near the 7th second, axis has a sudden peak which means the cutting process is not as smooth as it should be. As it was stated in Table 5, the limit value was set as 12 a/m2 and we as seen in Fig. 9, the measured maximum peak is below the given value. Which means the operation does not result in any sort of collision, breakage of machine tools or damage but effects the quality of the work. Desired surface values and tolerances cannot be obtained.
Fig. 10Detected vibrations of a milling process which uses worn-out tool and optimal feed rate and cutting depth values
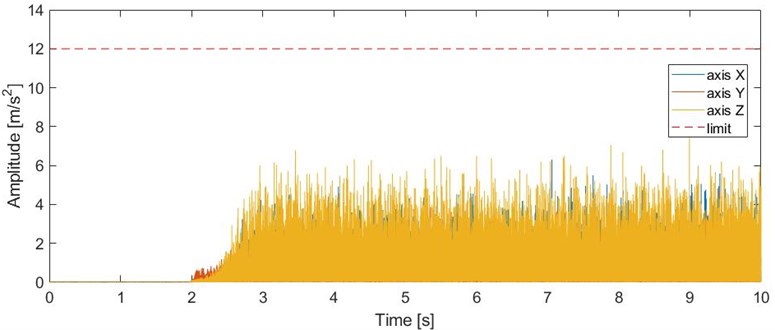
In this case, 6 mm shaft tool, which cannot be used to perform milling processes, is used intentionally to achieve the main purpose of the study.
As it was given in the Table 7, -axis feed rate is given as F100 and the depth of cut is 2 mm. This is the optimal cutting values depending on the material and the tool which are selected for this operation.
Table 7G-Code of the milling process with optimal values
G54 | G90 | G94 | ||
S2000 | M3 | |||
G0 | Z50 | |||
T1 | G43 | G0 | Z50 | H1 |
G0 | X-10 | Y5 | ||
G0 | Z15 | |||
G1 | Z-2 | F1000 | ||
G1 | X36 | F100 | ||
Y9 | ||||
X-5 | F150 | |||
M30 |
Table 8Mean of the signal that is taken from the measurement and standard deviation of the RMS function (for Fig. 10)
Mean value | 0.87 | 0.0585 | 0.1093 |
Standard deviation | 0.0861 | 0.0556 | 0.1051 |
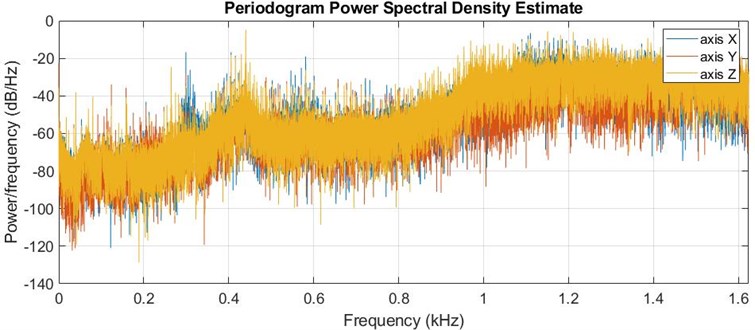
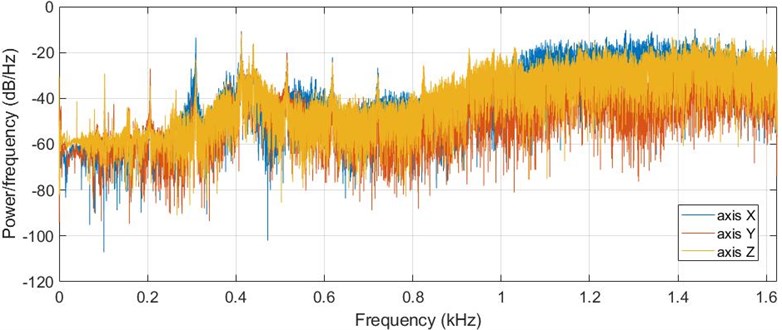
Fig. 11PSD of the analysed vibrations of the milling process with worn-out tool used
4.2. Milling operation with high value of feed rate
For this operation, the feed rate of -axis, which is given in Table 7, is set to F1000. In Fig. 12, the vibration signals are recorded as it increases during the operation. When investigating in details, we see that between 9th and 10th seconds the vibration value crosses the limit value and does not immediately stop. In some cases, it can be observed that peaks will cross the limit value once or several more times. The reason is that tool is still performing a cutting operation until the rotation stops. The emergency stop function is once activated and when there is several more over-limit actions, emergency stop is not activated again. The reaction time given in Table 2 is <1 ms which results immediate stop of the process.
Table 9Mean of the signal that is taken from the measurement and standard deviation of the RMS function (for Fig. 12)
Mean value | 0.1023 | 0.0437 | 0.0863 |
Standard deviation | 0.1351 | 0.0583 | 0.1131 |
Fig. 12Detected vibrations from the milling operation that has higher depth of cuts than optimum value which the material and tool can allow
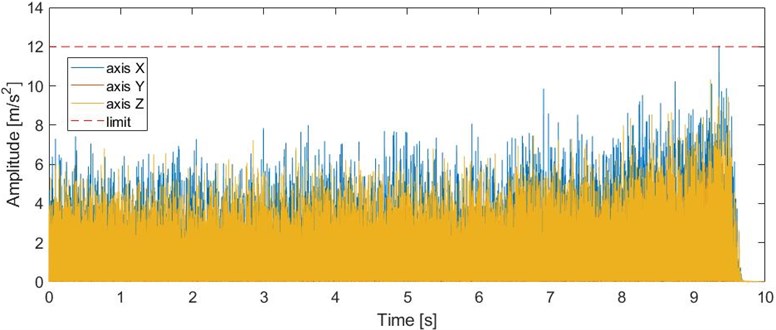
Fig. 13PSD of vibrations of milling process with relatively high depth of cut
4.3. Milling operation with both high value of feed rate and depth of cut
To perform this operation, the depth of cut is set as 6 mm (X-6) and the feed rate has been set as 1000 (F1000) when the ideal values are given in Table 7 as 2 mm depth of cut (X-2) and feed rate 100 (F100).
Fig. 14Detected vibrations from an operation that contains higher feed rate and depth of cut
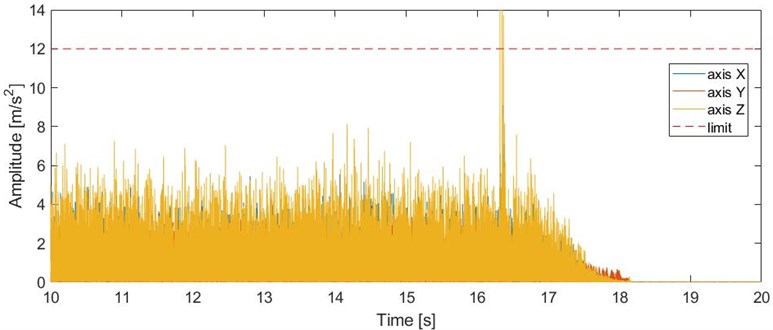
In Fig. 14, it is observed that when the machine tool breaks, the peak immediately raises and values on the graph keeps lowering until the machine stops. In this case, In between 16th and 17th seconds, the sudden high peak that is caused after the tool break is observed. Measured amplitude value crosses the limit value which is set by user. This automatically results in emergency stop of the machine.
Table 10Mean of the signal that is taken from the measurement and standard deviation of the RMS function (for Fig. 14)
Mean value | 0.0657 | 0.0495 | 0.0898 |
Standard deviation | 0.0786 | 0.0574 | 0.1070 |
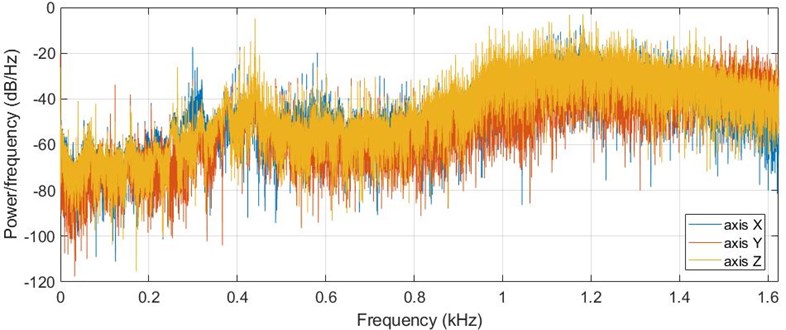
Fig. 15PSD of vibrations of the operation that results in tool break
5. Production plant application
The increasing use of computer-aided devices, and the generally accelerating advance of technology, maintenance costs are likely to be even higher in the future. Reports from a study conducted in 1989 shows that the estimated cost of maintenance for a selected group of companies increased from $200 billion in 1979 to $600 billion. Companies where equipment failures would result in major losses or massive repair costs are advised to engage in condition-based maintenance and not to rely on regular time-based maintenance alone [7, 8].
In general, even for new machines, maintenance is central to maintaining a machine’s technical specifications and fulfilling a company’s requirements in producing a particular product with a specified quality and at a predetermined cost. Otherwise, degradation of these specifications can be accelerated during operating time, which means that the machine’s ability to fulfil company requirements decreases faster. This situation is unacceptable in sectors with intensive capital investment such as process and chemical industries. Therefore, the direct maintenance cost is the minimum required expense to maintain machine quality and fulfil production requirements. During operating time, however, deterioration of the significant components of the machine is unavoidable, even if it is possible in some cases to temporarily arrest the process. Consequently, further production losses can be expected. In addition, changes and variations in the operating and environmental conditions, structural changes in the machine, variations in the use of the machine etc., usually lead to further disturbances and additional economic losses. All of these economic losses motivate special investments to improve the machine, process and operating and environmental conditions in order to reduce these losses [9].
Total productive maintenance (TPM) consists of a range of methods, which are known from maintenance management experience to be effective in improving reliability, quality, and production. It requires operators to take over some of the maintenance staff tasks, e.g. clean, lubricate, tighten bolts, adjust and report their observations about changes in the machine condition [10]. All these tasks have importance and useful to stop some failure causes. But condition monitoring such as vibration analysis, is of great importance for supporting the operator maintenance and to assist the operators in searching for abnormalities in the equipment [11].
TPM has been depicted as a manufacturing strategy comprising of following steps:
– Maximize equipment effectiveness through optimization of equipment availability, performance, efficiency and product quality,
– Establishing a preventive maintenance strategy for the entire life cycle of equipment,
– Covering all departments such as planning, user and maintenance departments involving all staff members from top management to shop-floor workers,
– Promoting improved maintenance through small-group autonomous activities [12-15].
Total Productive maintenance can be classified as TPM1 (Operator Level) and TPM2 (periodic, conditional reviews etc.). In the range of TPM1, following conditions should be met by using machine overviews, inspections by the operator and technology team and Maintenance staff:
– Cleanness;
– Lubrication;
– Tightening of screws;
– Completing all parts;
– Supplementing the tooling etc.
Fig. 16The concept of total quality maintenance (TQM) [11]
![The concept of total quality maintenance (TQM) [11]](https://static-01.extrica.com/articles/20788/20788-img16.jpg)
Total Quality Maintenance diagram shown in Fig. 16 explains that process capability as a measure of conformity, i.e. ability to manufacture items within specified tolerances or other quality limits, depends on several factors rather than only machinery condition. The basic elements constituting a manufacturing process may be summarized as: manufacturing machines, monitoring and maintenance policy, environmental condition, operating and maintenance staff, manufacturing methods and procedures, quality control methods and procedures, material, managerial functions such as spare parts stores, purchasing and marketing, service such as lubrication and screw tightening [11].
6. Conclusions
Given explanations, previously published papers and conducted case studies prove that adopting TPM and TQM as a maintenance procedure increases overall equipment effectiveness. According to several case studies conducted by Kasim et al. [15], comparison made in between values of overall equipment effectiveness before and after implementing the TPM procedure shows that the difference is significantly high (approximately 25 %).
The implementation of a vibration monitoring system into a CNC machine helps collecting the technical data that describes the manufacturing facility’s customized parameters in maintenance planning. This data contains the information that states how often the situation of a tool being worn-out occurs, periodically calculating the costs spent on solutions such as new tools, fixing/replacing the machine components etc.
The increasing of the quality highly depends on the maintenance policies. The vibration monitoring and TPM/TQM procedures will help increasing the life cycle of the machine and tools which is used to perform high quality works. When increasing the quality of works, it will conclude having income increase.
Table 11Values for routine TPM1 test procedure
Action | Drive | Parameter |
Checking the tool-holder-spindle balance | Spindle | 5000 rev/min |
Checking the symptoms of damage on the spindle rolling bearing | Spindle | |
Checking the drive clearances and the axiality of the lead screws in the drives | -Axis | 750 mm/min |
-Axis | ||
-Axis |
Fig. 17TPM1 Range Spindle test results
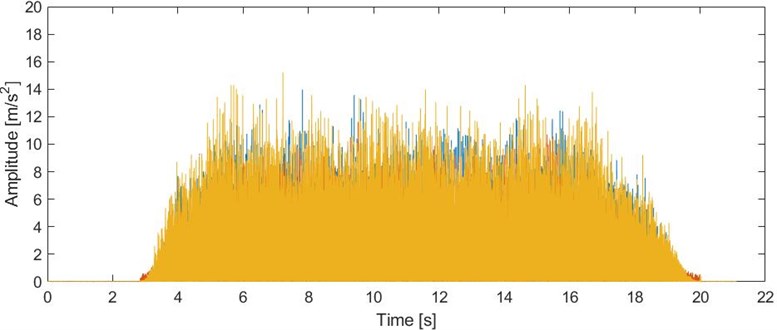
In the range of TPM1, the machine operator’s verification activity will consist in launching a special machine diagnostics program in the G-code that will perform within a few seconds. As part of the sequence, executive systems such as spindle will be activated. During their movements the acceleration of vibrations on the spindle housing and on the machine table will be monitored with the use of MEMS sensor. In case of the spindle, it will also be possible to check the condition of the bearings using vibration analysis synchronous to the spindle rotation. Measured vibrations during the movements will be referenced to the established levels deemed acceptable and if these values are exceeded, the machine will signal the need to call the maintenance engineer through the signal tower. The aim of this approach is to replace the classic approach which is totally dependent on the operator.
Fig. 18TPM1 range X-Y-Z axis test results
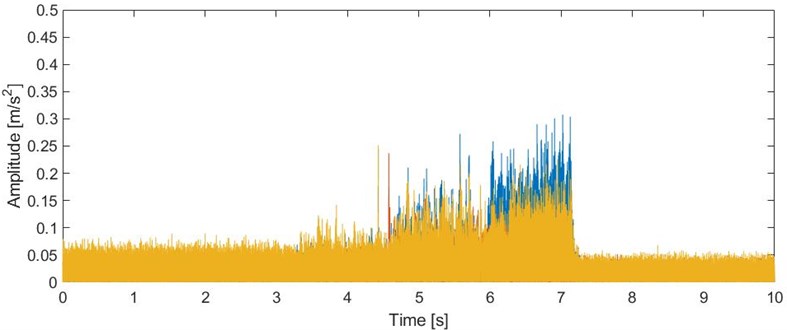
The spindle test results (Fig. 17) shows us that a relatively high peak can be observed in between 6th and 8th seconds of Z axis that can be considered as the spindle requires maintenance. Axis test results (Fig. 18) shows us that each axis require maintenance based on the amplitude values of the axes.
References
-
Herman M., Pentek T., Otto B. Design Principles for Industrie 4.0 Scenarios: A Literature Review. Technische Universität Dortmund, 2015, http://www.snom.mb.tu-dortmund.de/cms/de/forschung/ Arbeitsberichte/Design-Principles-for-Industrie-4_0-Scenarios.pdf.
-
Marchelek K. System design of milling machines – cutting process resistant to self-excited vibrations. Szczecin University of Technology, Vol. 4, Issue 27, 2007, p. 12-16.
-
Ford D. G., Mayers A., Haase F., Lockwood S., Longstaff A. Active vibration control for a CNC milling machine. Journal of Mechanical Engineering Science, Vol. 228, Issue 2, 2014, p. 230-245.
-
Looney Mark An introduction to MEMS vibration monitoring. Analog Dialogue, Vol. 48, Issue 6, 2014, p. 1-3.
-
Al-Najjar B., Alsyouf I. Enhancing a company’s profitability and competitiveness using integrated vibration-based maintenance: a case study. European Journal of Operational Research, Vol. 157, 2014, p. 643-647.
-
Nakajima S. TPM Development Program. Productivity Press, Cambridge, 1988.
-
Conway T., Perry E. Incorporating statistical process control into the team-based TPM environment. Semiconductor Manufacturing Conference, 1999, p. 281-284.
-
Bhadury B. Management of productivity through TPM. Productivity, Vol. 41, Issue 2, 200, p. 240-251.
-
Kasim N. I., Razali A., Noor N. M., Saidin W. A. N. W. Improvement of overall equipment effectiveness (OEE) through implementation of total productive maintenance (TPM) in manufacturing industries. Applied Mechanics and Materials, Vol. 761, 2015, p. 180-185.
-
Wireman T. World Class Maintenance Management. Industrial Press, New York, 1990.
-
Senju S. TQM and TPM. Asian Productivity Organization, Tokyo, 1992.
-
Vibration-Analysis Definitions. Mobius Institute, 2017.
-
Al-Najjar B. Total quality maintenance: an approach for continuous reduction in costs of quality products. Journal of Quality in Maintenance Engineering, Vol. 2, Issue 3, 1996, p. 2-20.
-
Nakajima S. Introduction to Total Productive Maintenance, TPM. Productivity Press, Cambridge, 1988.
-
Randall B. R. Vibration-Based Condition Monitoring – Industrial, Aerospace and Automotive Applications. John Wiley and Sons Ltd., New Delhi, 2011.
Cited by
About this article

