Abstract
Dynamic numerical analysis by the finite element method (FEM) is widely used for the seismic performance analysis of earth-rockfill dams. The dynamic characteristics of soil, which can be measured by dynamic tests, determine the results of the FEM analysis. However, due to their high costs and long duration, dynamic tests are not feasible for many small- to middle-scale earth-rockfill dams. As a result, the analogy method is employed. Because the traditional analogy method is highly dependent on personal experience, it lacks objective and accurate orientations. In this paper, a new method to analogize the dynamic characteristics of rockfill by prototype monitoring and statistic curves is developed. To examine its effectiveness, the dynamic parameters of a middle-scale concrete-face rockfill dam (CFRD) were analogized. The results of the dynamic FEM analysis agree well with the general rules which were shown in the earthquake response and the dynamic FEM analysis response of the same type of CFRD
1. Introduction
On May 12, 2008, an earthquake of magnitude 8.0 occurred in Wenchuan, which is located in Sichuan Province, China. After the earthquake, 2,666 dams in eight provinces suffered different extents of damage [1]. On July 11, 2008, the Chinese government announced that certain dams, which satisfy one of the conditions listed in Table 1, that have been built or that are under construction undergo special seismic design censorship, which is primarily dependent on dynamic analysis with the finite element method (FEM). Before the Wenchuan earthquake, only a few large dams satisfying the conditions mandated by the Chinese Specifications for Seismic Design of Hydraulic Structures should take dynamical analysis with the FEM. As new conditions listed in Table 1 are more comprehensive, numerous middle-scale dams should use dynamic analysis with the FEM to analyze the seismic safety of the dam. In July 2010, the government launched reinforcement work for unsafe small-scale reservoirs; approximately 5,400 unsafe small-scale dams required reinforcement design according to the results of seismic dynamic analysis by the FEM.
Table 1Dynamic analysis of the dams with the FEM: conditions
Conditions of the specifications | Maximum reservoir capacity 109 m3 | Design intensity 7.0 |
Install capacity 1,200 MW | ||
Maximum height 70 m | Design intensity 8.0 | |
Liquefiable soil located in foundation | ||
Conditions of the new order | Maximum reservoir capacity 108 m3 | Design intensity 7 degree or design earthquake acceleration 0.1 g |
Install capacity 300 MW | ||
Maximum height 70 m | Liquefiable soil located in foundation | |
The dynamic characteristics of the soil in earth-rockfill dams (generally acquired by dynamic tests, such as dynamic triaxial tests, dynamic simple shear tests, cyclic torsional shear tests, resonant column tests, and shear wave velocity tests) determine the results of the FEM analysis. Due to high costs, long periods, and limited service, dynamic tests have only been conducted for some of the dams. The dynamic characteristics of soil for the majority of small- to middle-scale dams are determined by the analogy method which refers to using or making adjustment to the similar soil dynamic characteristics as the analogized soil dynamic characteristics, according to the soil parameters such as material, dry density, grading curve, and so on. It is highly dependent on personal experience and lacks objective and accurate orientations. A simple, reliable, and effective method to analogize soil dynamic characteristics should be developed for small- to middle-scale dams using dynamic FEM analysis.
The dynamic characteristics of soil in earth-rockfill dams can be generally described by an equivalent linear viscoelastic model, which incorporates the initial dynamic elastic shear modulus , normalized modulus reduction relationships ( is dynamic shear modulus and is dynamic shear strain), and the damping ratio versus relationships . can be obtained at small-strain cyclic loading ( is typically less than 0.001 %), when the soil is in an elastic state. Numerous scholars have performed experiments to examine , which is a key factor in soil dynamic characteristics[2,3]. and are also important factors. Seed et al. developed ranges of and for sandy and gravelly soils [3]. Rollins et al. provided best-fit curves and standard deviation bounds of and for gravel [4]. Kong et al. proposed ranges of and for rockfill [5]. The author developed and statistic curves for rockfill, which were applied in the dynamic analysis of two middle-scale CFRDs. The details were published in the 15th World Conference on Earthquake Engineering (15WCEE).
In this paper, a statistical relationship between and Duncan and Chang’s - model parameters of rockfill was developed. According to prototype monitoring of a dam, of the rockfill were determined by a back analysis, which reflected the influence of construction. The of rockfill can be analogized according to the statistical relationship and . According to the analogized , and statistic curves of the rockfill, the and curves were analogized.
2. The analogy method of
The of soil is affected by many factors, such as particle size, material, gradation, confining pressure, fabric of soil skeleton, stress path, loading frequency, density, saturation, and temperature [2]. Different soils are affected by different factors. Thus, the of clays, slits, sands, gravel soils, and rockfills should be described differently.
Seed et al. developed the empirical function of granular soils (sand and gravels) as:
where is a shear modulus coefficient, which can be determined by the standard penetration test, is the mean effective confining pressure, is the atmosphere [3].
Hardin and Kalinski modified the empirical function of sand to estimate the of gravelly soils as:
where is the elastic shear modulus in three-dimensional formats, is the void ratio, is the over consolidation ratio, is the dimensionless elastic stiffness coefficient, is the principle stress, is the elastic Poisson’s ratio, is the particle size function, and and are model parameters [6].
These empirical functions provided a practical method for determining the of sand and gravel that corresponds to filter material and transition material in earth-rockfill dams. However, compared with the soils mentioned above, less effort has been applied to the empirical function of rockfill. Rockfill, which is typically the largest component of an earth-rockfill dam, primarily affects the displacement of such dams. Furthermore, the of rockfill measured in the laboratory using the maximum particle sizes in the samples are less than 60 mm. However, the maximum particle sizes of the rockfill in earth-rockfill dams may be as large as 1 m. The particle size affects the rockfill deformation properties. The rockfill shear deformation modulus increases as the particle sizes become larger for a given sample diameter and increases with the sample diameter for a given particle gradation [7]. Moreover, rockfill is produced by quarry blasting, the particles contain a few cracks, which result in considerable particle breakage. Particle breakage, which can be depicted by gradation curves, contributes to modified soil skeleton structures and affects the deformation characteristics of rockfill. Thus, the deformation characteristics of rockfill are influenced by compaction on a construction situ. The results of numerical simulation with the FEM in laboratory tests sometimes differ significantly from the results of prototype monitoring.
As noted previously, the empirical function for rockfill does not incorporate the influences of particle size and construction on the site. Back analysis, which yields a more accurate numerical simulation, can be applied to determine the deformation characteristics of soil in dams. However, a complete seismic wave and corresponding seismic response of earth-rockfill were rarely collected, with the exception of a few earth-rockfill dams, such as the Li-yu-tan Dam, which was damaged but not completely destroyed by the Chi-Chi earthquake [8]. Dynamic back analysis of earth-rockfill is more difficult, and the dynamic characteristics of soils in dams are difficult to determine directly by dynamic back analysis. Conversely, the static back analysis method is widely applied. Complete deformation prototype monitoring of earth-rockfill dams is the predominant method for monitoring dam security. Static soil deformation characteristics determined by back analysis with prototype monitoring reflect the influences of construction and particle size, and provide more reliable evidence for analogy.
The Duncan and Chang’s - model is a simple and practical nonlinear elastic static model. It is recommended by Chinese Design specification for rolled earth-rockfill dams (DL-5395-2007) to calculate displacement and stress of earth-rockfill dam. The Chinese Specification of soil test (SL237-1999) also provides techniques, which are used to determine soil parameters used in the Duncan and Chang’s - model according to triaxial test results. The Chinese engineering practices indicate that the Duncan and Chang’s - model can well simulate the settlements of earth-rockfill dams, whose computational accuracy satisfies the demand for engineering.
The Duncan and Chang’s - model suggested that the tangent modulus is expressed as follows:
where is the failure ratio, is the stress level, is the modulus number, is the minor principal stress, is the modulus exponent, is the major principal stress, is the friction angle, and is the cohesion.
The nonlinear volume change is simulated using the bulk modulus, which is expressed as follows:
where is the bulk modulus number and is the bulk modulus exponent.
Table 2Static and dynamic parameters of rockfill used in earth-rockfill dams
No. | Material | Dam hight (m) | Rockfill mineralogy | Test type | Sample dia./ht. (cm) | Drainage condition |
1 | Manla rockfill [10] | 76.3 | Sandstone | TX/CTX | 30/61 | CD/SU |
2 | Zhangfeng rockfill DSS [11] | 72.2 | Sandstone | TX/CTX | 30/75 | CD/SU |
3 | Zhangfeng rockfill DSP [11] | 72.2 | Limestone | TX/CTX | 30/75 | CD/SU |
4 | Jilintai cushion [12] | 157 | Limestone | TX/CTX | 30/60 | CD/SU |
5 | Jilintai transition [12] | 157 | Limestone | TX/CTX | 30/60 | CD/SU |
6 | Yunpeng rockfill [13] | 100 | Limestone | NA | NA | NA |
7 | Yunpeng transition [13] | 100 | Sandstone | NA | NA | NA |
8 | Shiziping transition [13] | 136 | Limestone | NA | NA | NA |
9 | Tianshengqiao rockfill [14] | 178 | Granite | TX/NA | 30/60 | CD/NA |
10 | Main rockfill [15] | NA | Granite | TX/CTX | 30/70 | CD/SU |
11 | Secondary rockfill [15] | NA | Granite | TX/CTX | 30/70 | CD/SU |
12 | Shuangjiangkou transition [16] | 314 | NA | TX/CTX | 30/70 | CD/SU |
13 | Xieka secondary rockfill [17] | 108 | Granite | NA | NA | NA |
14 | Pubugou rockfill [18] | 188 | Sandstone | TX/CTX | 30/60 | CD/SU |
15 | Shiziping rockfill [13] | 136 | Granite | NA | NA | NA |
16 | Changheba rockfill [19] | 240 | Allgovite | TX/CTX | 30/70 | CD/SU |
17 | Xiliushui rockfill [20] | 146.5 | NA | NA | NA | NA |
18 | Xieka main rockfill [17] | 108 | Granite | NA | NA | NA |
19 | Shuangjiangkou upstream rockfill [16] | 314 | Limestone | TX/CTX | 30/70 | CD/SU |
20 | Zipingpu transition [21] | 156 | Limestone | TX/CTX | 30/60 | CD/SU |
21 | Zipingpu main rockfill [21] | 156 | Allgovite | TX/CTX | 30/60 | CD/SU |
22 | Xiliushui cushion [20] | 146.5 | Limestone | NA | NA | NA |
23 | Jiudianxia secondary rockfill [22] | 136.5 | Limestone | TX/NA | 30/70 | CD/NA |
24 | Transition l [15] | NA | Limestone | TX/CTX | 30/70 | CD/SU |
25 | Zipingpu cushion [21] | 156 | Granite | TX/CTX | 30/60 | CD/SU |
26 | Nuozhadu transition [23] | 261.5 | Granite | TX/CTX | 30/70 | CD/SU |
27 | Changheba transition [19] | 240 | Limestone | TX/CTX | 30/70 | CD/SU |
28 | Jiudianxia main rockfill [22] | 136.5 | Sand shale | TX/NA | 30/70 | CD/NA |
29 | Nuozhadu secondary rockfill [23] | 261.5 | Granite | TX/CTX | 30/70 | CD/SU |
30 | Nuozhadu main rockfill [23] | 261.5 | Limestone | TX/CTX | 30/70 | CD/SU |
31 | Jiudianxia transition [22] | 136.5 | Sand shale | TX/NA | 30/70 | CD/NA |
32 | Nuozhadu tertiary rockfill [23] | 261.5 | Limestone | TX/CTX | 30/70 | CD/SU |
33 | Jiudianxia cushion [22] | 136.5 | Limestone | TX/NA | 30/70 | CD/NA |
The Mohr-Coulomb envelopes for cohesionless soils are curved to some extent, and a wider range of pressure corresponds to a greater curvature, particularly for gravel and rockfill. For example, at the bottom near the center of a large dam, the rockfill may be confined under such a large pressure that the friction angle is:
where is the value of for , and is the reduction in for a 10-fold increase in [9]. Thus, and in Eq. (3) should be replaced by and , respectively, for rockfill materials.
In the equivalent linear viscoelastic model, can be expressed as:
where is the dimensionless elastic stiffness coefficient and is the elastic stiffness exponent. Although the in Eqs. (4) and (6) are similar because they both indicate the influence of stress on the deformation behavior of the soil, some differences remain. First, is the secant modulus of the dynamic shear stress versus shear strain curves, whereas is the tangent modulus of the static shear stress versus axial strain curves. Second, and are both determined by a modified straight-line function; the dynamic shear strain in the x-axial of begins at 10-6, whereas the static axial strain in the -axial of begins at 10-3. Third, is determined in the undrained condition; thus, the volumetric strain cannot be tested; Poisson’s ratio was generally estimated at 0.5 [4, 5]. Conversely, is determined in the drained condition. Finally, in the function incorporates the influence of the consolidation ratio and is equivalent to in the function when the consolidation ratio is equivalent to one. However, and both represent elastic shear modulus and contain the same units. They are both expressed by the stress function, which indicates the pressure hardening characteristics of the soil. Furthermore, is the most important parameter in the - model that simulates deformation of the soil, which directly reflects the influence of construction on the displacement of an earth-rockfill dam.
Table 3Static and dynamic parameters of rockfill used in earth-rockfill dams
No. | Dry density (g/cm3) | Maximum grain size (mm) | Loading frequency (Hz) | Number of cycles | ||||
1 | 2.19 | 60 | 0.1 | 12 | 312 | 0.44 | 1,289 | 0.53 |
2 | 2.10 | 60 | 0.33 | NA | 316 | 0.46 | 1,628 | 0.47 |
3 | 2.09 | 60 | 0.33 | NA | 398 | 0.44 | 1,850 | 0.51 |
4 | 2.18 | 60 | 0.1 | 7 | 418 | 0.48 | 1,349 | 0.60 |
5 | 2.02 | 60 | 0.1 | 7 | 513 | 0.31 | 1,421 | 0.59 |
6 | 2.05 | NA | NA | NA | 585 | 0.58 | 2,216 | 0.61 |
7 | 2.20 | NA | NA | NA | 815 | 0.34 | 2,456 | 0.60 |
8 | 2.15 | NA | NA | NA | 860 | 0.48 | 1,000 | 0.60 |
9 | 2.15 | 60 | NA | NA | 900 | 0.35 | 2,379 | 0.48 |
10 | 2.26 | 60 | 0.33 | NA | 912 | 0.21 | 2,349 | 0.31 |
11 | 2.25 | 60 | 0.33 | NA | 944 | 0.20 | 2,379 | 0.30 |
12 | 2.09 | 60 | 0.1 | 3 | 960 | 0.25 | 2,019 | 0.31 |
13 | 2.09 | NA | NA | NA | 980 | 0.32 | 2,609 | 0.56 |
14 | 2.30 | 60 | 0.1 | 12-15 | 1,000 | 0.52 | 1,946 | 0.61 |
15 | 2.15 | NA | NA | NA | 1,000 | 0.50 | 1,200 | 0.69 |
16 | 2.13 | 60 | 0.33 | 3 | 1,000 | 0.24 | 2,714 | 0.47 |
17 | 2.15 | NA | NA | NA | 1,020 | 0.34 | 3,917 | 0.47 |
18 | 2.05 | NA | NA | NA | 1,040 | 0.30 | 2,902 | 0.57 |
19 | 2.12 | 60 | 0.1 | 3 | 1,050 | 0.25 | 4,142 | 0.42 |
20 | 2.25 | 60 | NA | NA | 1,085 | 0.38 | 3,184 | 0.51 |
21 | 2.16 | 60 | NA | NA | 1,089 | 0.33 | 3,784 | 0.42 |
22 | 2.23 | NA | NA | NA | 1,090 | 0.49 | 2,687 | 0.57 |
23 | 2.16 | 60 | NA | NA | 1,120 | 0.53 | 2,348 | 0.61 |
24 | 2.23 | 60 | 0.33 | NA | 1,161 | 0.24 | 2,530 | 0.34 |
25 | 2.30 | 60 | NA | NA | 1,274 | 0.44 | 3,051 | 0.51 |
26 | 2.04 | 60 | 0.33 | 3 | 1,300 | 0.27 | 1,651 | 0.47 |
27 | 2.02 | 40 | 0.33 | 3 | 1,318 | 0.24 | 1,604 | 0.39 |
28 | 2.20 | 60 | NA | NA | 1,400 | 0.53 | 2,902 | 0.57 |
29 | 2.15 | 60 | 0.33 | 3 | 1,530 | 0.18 | 2,324 | 0.34 |
30 | 2.00 | 60 | 0.33 | 3 | 1,425 | 0.26 | 2,570 | 0.35 |
31 | 2.25 | 60 | NA | NA | 1,500 | 0.55 | 3,338 | 0.63 |
32 | 2.09 | 60 | 0.33 | 3 | 1,551 | 0.18 | 2,324 | 0.34 |
33 | 2.28 | 40 | NA | NA | 1,750 | 0.43 | 3,533 | 0.57 |
So it is would be an effective method to develop an empirical relationship between and according to static and dynamic test results of the rockfill, which is similar to methods used to resolve and . According to the empirical relationship between and , the can be analogized using , which avoids the dynamic test. The author compiled the and parameters of 33 types of rockfill that are used in 14 earth-rockfill dams, as listed in Table 3. According to the compiled reference, these parameters are all obtained by the laboratory test, whose details are listed in Table 2.
Fig. 1Best-fit curve, the Best-fit curve ± one and two SD, and data points that define Kg/Ke versus Ke relationships for 33 types of rockfills
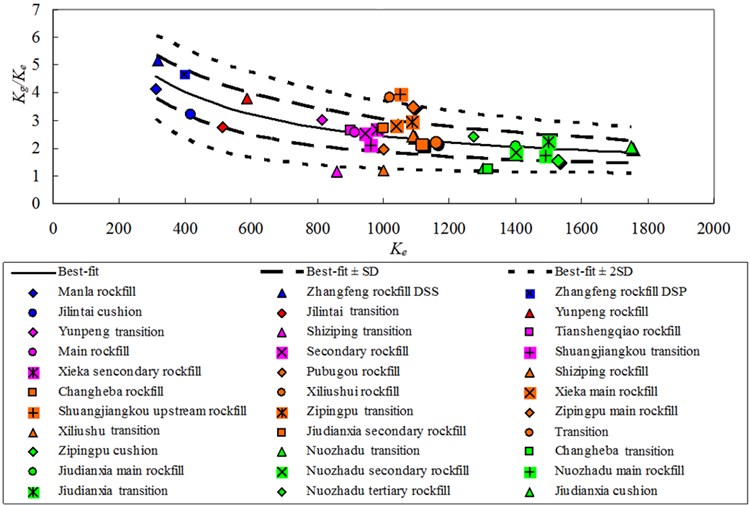
Fig. 2Best-fit curve, the Best-fit curve ± one and two SD, and data points that define ng/ne versus ne relationships for 33 types of rockfills
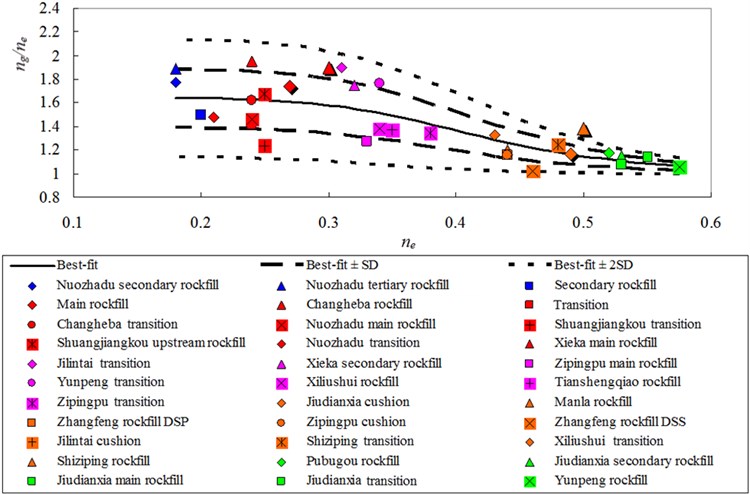
The versus data points for the rockfills listed in Table 3 are plotted in Fig. 1, and versus data points are plotted in Fig. 2. The and represent the influences of material stiffness and soil skeleton structure on and , respectively, whereas and reflect the sensitivity of soil skeleton structure to stress. As mentioned previously, and are typically acquired in an anisotropic consolidation state, whereas and are acquired in an isotropic consolidation state. This difference is eliminated by , which is equivalent to when the consolidate ratio is equivalent to one. Thus, and are equivalent, and and are equivalent. Figs. 1 and 2 highlight that decreases as increases, and decreases as increases. The data points in Fig. 2 are more concentrated than the data points in Fig. 1, whereas is more concentrated than . The values for the 33 types of rockfills are distributed over the range of 0.3–0.7. The results are slightly more comprehensive than the previous statistical results obtained by Professor Kong for 13 types of rockfills, which fall in the range of 0.4-0.6 [5]. The average value of is 0.5, as indicated by the results of Professor Kong [5]. The distribution falls in the range of 0.2-0.6, and higher values typically correspond to higher values. Thus, values are distributed over the range of 1.0-2.2 and are concentrated in a smaller range with an increasing . Conversely, the distribution of values is slightly affected by the values.
The equations for the best-fit curves of the date in Fig. 1 and Fig. 2 are:
where , , , , and are the fitting parameters. The best-fit curve and the best-fit curve ± one and two standard deviations (SD) are also shown in Figs. 1 and 2. The fitting parameters are listed in Table 4.
Table 4Fitting parameters of Gmax statistic curves
Statistic curves | |||||
Best-fit | 10.067 | 209 | 1.069 | 1.645 | 0.417 |
Best-fit + 1 SD | 9.000 | 366 | 1.892 | 1.892 | 0.424 |
Best-fit – 1 SD | 11.775 | 133 | 1.398 | 1.398 | 0.402 |
Best-fit + 2 SD | 8.936 | 530 | 1.061 | 2.145 | 0.426 |
Best-fit – 2 SD | 15.300 | 126 | 1.960 | 1.150 | 0.350 |
The scatter of the data is difficult to resolve by the existing analysis because particle material, particle gradation, density, and soil skeleton structure may influence and . The and of rockfill used in dams can be determined according to the triaxial tests or the back-analysis using the prototype monitoring. The and can be determined by Eq. (7) with the best-fit curve, and sensitivity analysis can be applied with the best-fit curve ± one and two SD. Thus, can be analogized according to the developed statistical relationship, which avoids the dynamic test. Furthermore, the analogized would reflect the influence of the construction in situ, if the and are determined by the back-analysis using the prototype monitoring.
3. The analogy method of and
In the past several decades, many researchers have explored and of soil and have developed the ranges of shear moduli and damping ratios for cohesive soil, sand, gravel, and rockfill [3-5]. The author gathered dynamic characteristics of numerous rockfills in earth-rockfill dams both in China and abroad, developed and statistic curves for rockfill, and applied them in the dynamic analysis of two small- to middle-scale CFRDs. The details are presented in the paper “Application of rockfill dynamical characteristic statistic curve in mid-small scale concrete face dam dynamic analysis”, which was published in the 15WCEE. The statistic curves of and can be expressed as:
where is minimum versus between 10-6-10-1; and are maximum and minimum , respectively, versus between 10-6 and 10-1; and , , , and are fitting parameters. The parameters are presented in Table 5.
Table 5Parameters for G/Gmax~γ and ξ~γ statistic curves
Statistic curves | |||||||
Best-fit | 0.0912 | 0.0305 | 0.8522 | 0.0082 | 0.2612 | 2.9029 | 0.6417 |
Best-fit + 1 SD | 0.0935 | 0.0581 | 0.8970 | 0.0121 | 0.2920 | 3.9535 | 0.6556 |
Best-fit - 1 SD | 0.0842 | 0.0160 | 0.8421 | 0.0042 | 0.2180 | 1.9753 | 0.6186 |
Best-fit + 2 SD | 0.1109 | 0.0967 | 1.0888 | 0.0153 | 0.3251 | 5.2038 | 0.6816 |
Best-fit - 2 SD | 0.0796 | 0.0088 | 0.8388 | 0.0008 | 0.1847 | 1.3052 | 0.5871 |
Thus, the dynamic characteristics of the rockfill used in the dam can be determined; can be analogized according to and statistic curves; and and can be analogized by the statistic curves. To examine the effectiveness, this study applied the dynamic analysis of a middle-scale CFRD whose rockfill dynamic parameters were analogized according to the proposed method.
4. Application
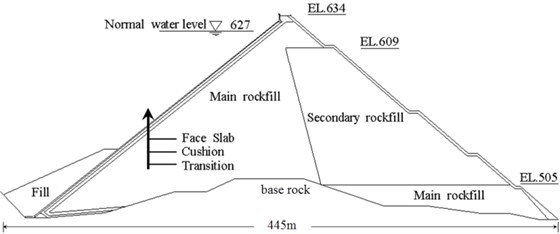
The Malutang II CFRD is located along the Panlong River in the Yunnan province of China. Along the crest, the dam is 154 m high and 493.4 m long; the upstream dam slope is 1:1.4, and the downstream integrated dam slope is 1:1.3. The total reservoir capacity is 5.36×10⁸ m3, and the install capacity is 300 MW. The design intensity of the Malutang II is 7.0 degree. So according to conditions of the specifications listed in Table 1, the Malutang II degsign intensity equal 7.0 degree, and the reservoir is less than 109 m3, and the install capacity is less than 1,200 MW, which don’t need to take dynamical analysis with the FEM. However, according to the new order, the Malutang II reservoir is more than 108 m3, and the install capacity is larger than 300 MW, which should take dynamical analysis with the FEM. A typical section of the CFRD is provided in Fig. 3.
Fig. 3Typical section of the Malutang II CFRD at 0+233.159
4.1. back analysis according to prototype monitoring
The three-dimensional FE mesh of Malutang II is shown in Fig. 4. The three-dimensional FE mesh is composed of 8,284 elements. The rockfills, cushion, transition, and concrete face slabs were simulated by four-, six-, and eight-node isoparametric spatial elements. A detailed settlement monitoring system was established to monitor the deformation of the Malutang II CFRD [24]. Vertical displacements inside the dam body were measured by settlement gauges distributed throughout typical cross-sections at 0+233.159. Twenty-two hydraulic overflow settlement gauges along three monitoring lines were placed in the typical sections, of which 19 survived (at elevations of 522, 556, and 590 m). Two other monitoring gauges, for monitoring settlement and horizontal displacement, were distributed on the downstream slope of the typical section at elevations 565 and 595 m. The layout of displacement gauges in the typical section is presented in Fig. 5.
Fig. 4Three-dimensional FE mesh
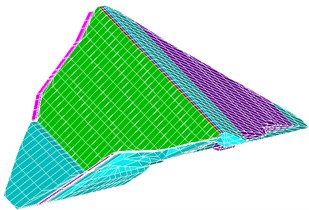
Fig. 5Comparison of simulations and site measurements
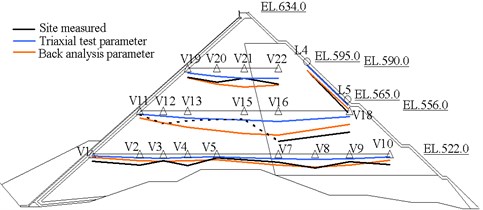
The site-measured displacements and construction record indicated that rapid construction reduced the time of consolidation [24], modified the structure of the rockfill, and caused the rockfill density to be unevenly distributed. The uneven density of the rockfill affected the rockfill deformation modulus and the dam body displacement. According to the construction record, the main rockfill and the secondary rockfill were separated into three parts corresponding to the three construction rates. Thus, the main rockfill types I, II, and III represent the main rockfill types that are constructed in stages I, II, and III & IV, respectively. The same notation is applied for secondary rockfill. The fill zone material was simulated using secondary rockfill II in the back-analysis. Therefore, Duncan and Chang’s - model parameters , , , , , , and of the main rockfill and the secondary rockfill in these construction periods were back-analyzed. The details of the - model parameters back-analysis are listed in the reference [24]. The results of the back-analysis are shown in Table 6. The FEM analysis was conducted using model parameters obtained from the back-analysis. The displacements calculated from the back-analysis parameters are also shown in Fig. 5. The settlements calculated using the back-analysis parameters are consistent in magnitude and distribution with the values measured in situ. Therefore, in general, the back-analysis results satisfactorily reflect the deformation properties of the dam.
Table 6The back-analyzed E-B parameters of Malutang rockfill [24]
Methodology | Material | |||||||
Triaxial test | Main rockfill | 1,467 | 0.38 | 0.80 | 55.0 | 15.0 | 1,570 | 0.23 |
Secondary rockfill | 1,042 | 0.53 | 0.75 | 50.7 | 10.5 | 933 | 0.08 | |
Cushion | 1,963 | 0.35 | 0.74 | 55.5 | 13.2 | 1,742 | 0.21 | |
Transition | 1,583 | 0.35 | 0.74 | 57.6 | 16.5 | 1,590 | 0.16 | |
Fill | 1,042 | 0.53 | 0.75 | 50.7 | 10.5 | 933 | 0.08 | |
Back-analysis | Main rockfill I | 1,011 | 0.33 | 0.90 | 55.0 | 16.0 | 1,112 | 0.22 |
Main rockfill II | 712 | 0.40 | 0.85 | 422 | 0.45 | |||
Main rockfill III | 1,545 | 0.18 | 0.60 | 1,663 | 0.47 | |||
Secondary rockfill I | 901 | 0.22 | 0.62 | 50.0 | 5.0 | 517 | 0.15 | |
Secondary rockfill II | 311 | 0.20 | 0.90 | 207 | 0.05 | |||
Secondary rockfill III | 1,200 | 0.31 | 0.60 | 558 | 0.32 |
4.2. Analogy of the dynamic characteristics
In the dynamic analysis, an equivalent nonlinear viscoelastic model was employed. In this model, the dynamic shear modulus and damping ratio are calculated as:
where is the normalized shear strain and and are the model parameters. The parameters and are determined by Eq. (7) according to the best-fit curve and the - model parameters determined by back analysis in Table 6. The analogized and curves of the rockfill are plotted in Figs. 6 and 7.
The normalized shear strain reflects the influence of the mean effective stress on the damping ratio. The curves with mean effective stresses of 100 and 1,600 kPa are plotted in Fig. 7. The and curves of the soil reflect the energy transformation mechanism under dynamic loading. Higher soil skeletal stiffness can store more elastic energy and produce a smaller damping ratio, which is the ratio between the lost energy and stored energy. However, the rockfill structure is more complex, and many factors influence energy transformation. Friction among soil particles, pore-fluid flow, and particle breakage consume energy generated by dynamic loading. Denser rockfill produces a stronger soil skeleton and higher .
Fig. 6Analogized G/Gmax~γ of the rockfill in the Malutang II CFRD
Fig. 7Analogized ξ~γ of the rockfill in the Malutang II CFRD
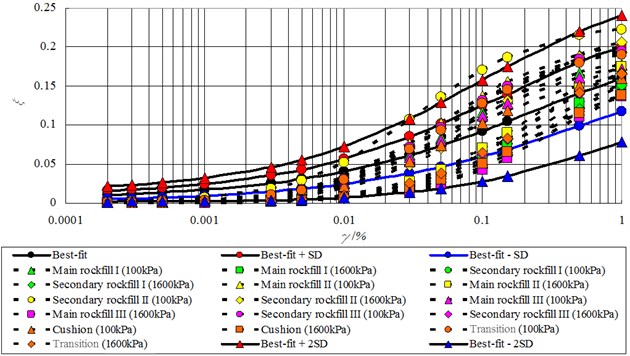
However, denser rockfill also generates additional particle contacts, greater dissipated energy, and a higher damping ratio [3]. The - model parameters for the rockfill determined by back analysis indicated that small values generate high values. A small indicated that the soil exhibited a looser structure or contained softer particles. A large indicated that the soil exhibited a flexible skeleton and sensitivity to stress [25]. The site monitoring and back analysis results indicated that different densities significantly influenced the deformation modulus of the rockfill. Denser rockfill produced higher and values [3]. The analogized parameters and also conformed to the rules. Thus, the analogized curves with a mean effective stress of 100 kPa, as shown in Fig. 7, are all located above the best-fit curve even if the analogized is higher than the average values of the compiled rockfill. The largest damping ratio of the secondary rockfill II is maintained under the best-fit curve + 2 SD because the analogized is larger than the smallest value for the compiled rockfill. In this context, a higher produces a lower curve and a higher curve, which conform to the general rules. The analogized dynamic parameters are listed in Table 7.
Table 7The analogized dynamic parameters
Material | ||||
Main rockfill I | 2,445 | 16.3 | 0.51 | 0.188 |
Main rockfill II | 2,083 | 19.0 | 0.55 | 0.210 |
Main rockfill III | 3,022 | 15.8 | 0.30 | 0.182 |
Secondary rockfill I | 2,317 | 17.6 | 0.36 | 0.203 |
Secondary rockfill II | 1,426 | 29.0 | 0.33 | 0.230 |
Secondary rockfill III | 2,655 | 18.0 | 0.49 | 0.202 |
Cushion | 3,053 | 15.0 | 0.54 | 0.171 |
Transition | 2,371 | 17.4 | 0.53 | 0.201 |
Fill | 2,280 | 18.0 | 0.49 | 0.205 |
4.3. Earthquake wave
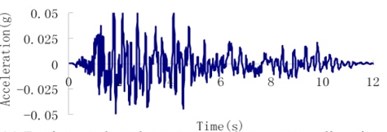
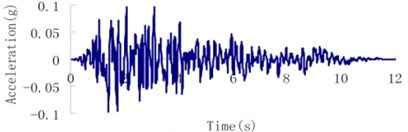
According to the geological inspection, the intensity of the design earthquake for the Malutang II dam with a transcendental probability of 5 % for 50 years is 7.0 and the peak acceleration of ground motion is 0.05 g. The transcendental probability for the check earthquake for 100 years is 5 %, and the acceleration of the ground motion is 0.095 g. The earthquake waves, which were applied in an upstream-downstream direction, vertical direction, and dam axis direction, are displayed in Fig. 8.
4.4. Dynamic response of the dam
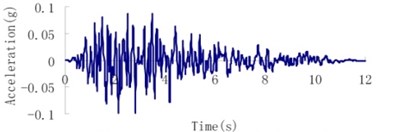
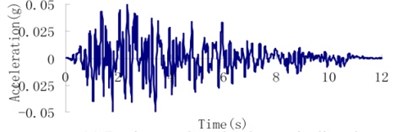
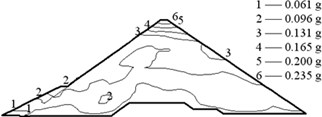
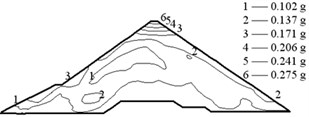
The earthquake time-step in the calculations was 0.02 s, and the acceleration in the vertical direction was reduced to two thirds. The acceleration responses of the Malutang II CFRD are presented in Fig. 9. The acceleration responses demonstrate that the maximum accelerations of the two earthquakes in every direction are located on the top of the dam. The maximum accelerations of the design earthquake in the upstream-downstream direction, vertical direction, and dam axis direction are 0.235, 0.137, and 0.173 g, respectively. The acceleration amplifications are 4.70, 4.11, and 3.46. The values of the check earthquake are 0.275, 0.187, and 0.189 g. The acceleration amplifications are 2.89, 2.96, and 1.99. The dynamic FEM results indicate that the maximum accelerations of the dam increase with the maximum accelerations of the earthquake and that the acceleration amplifications decrease with the maximum accelerations of the earthquake, which correspond to the earthquake response and the dynamic FEM analysis response of the same type of CFRD [17, 20-22, 28, 29].
Fig. 8Earthquake wave of the Malutang II CFRD
a) Design earthquake upstream-downstream direction
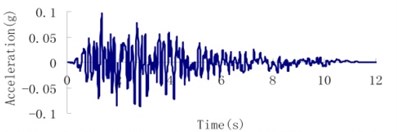
d) Check earthquake upstream-downstream direction
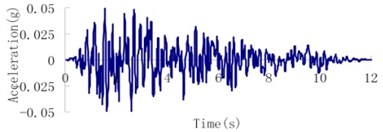
b) Design earthquake vertical direction
e) Check earthquake vertical direction
c) Design earthquake dam axis direction
f) Check earthquake dam axis direction
Fig. 9Acceleration of the Malutang II CFRD
a) Design earthquake upstream-downstream direction
d) Check earthquake upstream-downstream direction
b) Design earthquake vertical direction
e) Check earthquake vertical direction
c) Design earthquake dam axis direction
f) Check earthquake dam axis direction
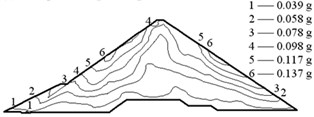
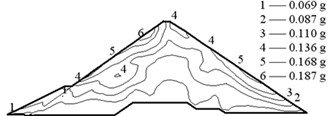
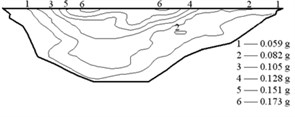
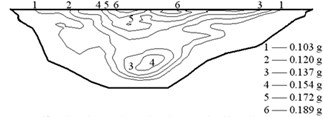
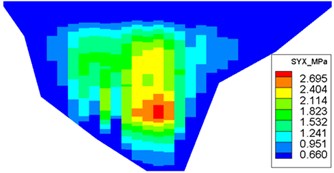
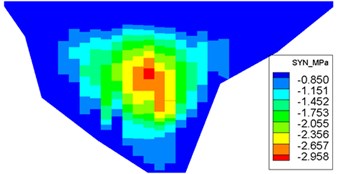
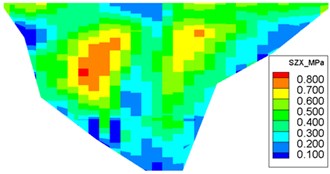
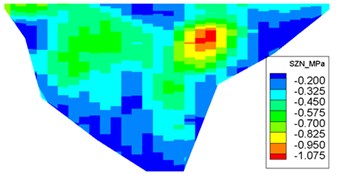
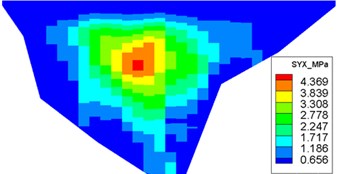
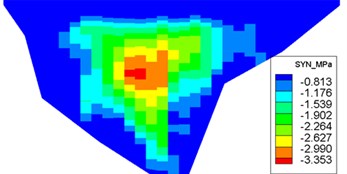
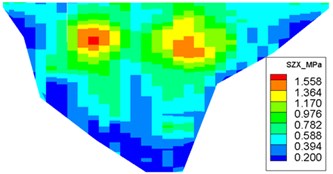
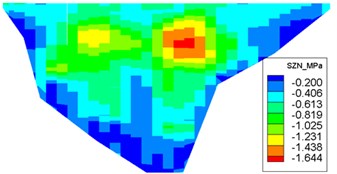
The dynamic stresses on the concrete face-slab of the design and check earthquakes are presented in Figs. 10 and 11, respectively. The maximum face-slab dynamic stresses of the design and check earthquakes are both located in the middle area. The maximum dynamic compression and tensile stresses along the dam slope for the design earthquake are 2.695 and 2.958 MPa (compression is positive). The stresses along the dam axis are 0.8 and 1.075 MPa. Check earthquake stresses along the dam slope are 4.369 and 3.353 MPa. The stresses along the dam axis are 1.558 and 1.644 MPa. The slab dynamic stresses increase with the maximum acceleration of the earthquake. The maximum compression stress and tensile stress are nearly equivalent; the stress along the dam slope is larger than the stress in the dam-axis direction, because the slit joints among face slabs release the part of the dynamic deformation in the face slab along the dam axis. As indicated by the acceleration response and distribution of the maximum face-slab dynamic stresses, the results of the dynamic analysis for the Malutang II CFRD conformed to the general rules, which were shown in the earthquake response and the dynamic FEM analysis response of the same type of CFRD [17, 20, 21, 22, 29].
Fig. 10Distribution of maximum face-slab dynamic stresses for the design earthquake
a) Maximum compression stress along the dam slope
b) Maximum tensile stress along the dam slope
c) Maximum compression stress along the dam axis
d) Maximum tensile stress along the dam axis
Fig. 11Distribution of maximum face-slab dynamic stresses for the check earthquake
a) Maximum compression stress along the dam slope
b) Maximum tensile stress along the dam slope
c) Maximum compression stress along the dam axis
d) Maximum tensile stress along the dam axis
5. Conclusions
According to prototype monitoring of the earth-rockfill dam, of the rockfill were determined by back analysis, which reflected the influences of construction and particle size effect. The of rockfill can be analogized according to the statistical relationship and . According to and statistic curves, , and the analogized , the and curves of the rockfill were analogized.
The dynamic characteristics of the soil in the Malutang II CFRD were determined by the analogy method. Dynamic analyses by the FEM were performed for a design earthquake and check earthquake. The two earthquake waves exhibited different response spectrums and maximum accelerations. The dynamic responses of the dam conformed to general rules, which were shown in the earthquake response and the dynamic FEM analysis response of the same type of CFRD. It indicates that the analogy method for dynamic characteristics is effective for rockfill and can be employed in a seismic safety check or reinforcement design of a small- to middle-scale earth-rockfill dam that cannot be analyzed by dynamic tests. The best-fit curves of the statistic relationships are the primary orientations for analogy. Furthermore, a sensitivity analysis of the dynamic parameters of rockfill can be determined according to the best-fit curve ± one and two SD of the statistic relationships. The rockfill dynamic characteristics analogy method should be based on an analysis of the predominant influencing factors, such as dam prototype monitoring, construction records, and operation scenarios.
References
-
Del Shannon A. Dam Damage: Evaluating and learning from the Wenchuan earthquake’s impact to China’s dams. American Society of Civil Engineers, Oakland, CA, United States, 2009.
-
Hardin B. O., Black W. L. Vibration modulus of normally consolidated clay. Proceedings of ASCE, Vol. 94, Issue 2, 1968, p. 353-369.
-
Seed H. Bolton, Wong Robert T., Idriss I. M., et al. Moduli and damping factors for dynamic analyses of cohesionless soils. Journal of Geotechnical Engineering, Vol. 112, Issue 11, 1986, p. 1016-1032.
-
Rollins K. M., Evans M. D., Diehl N. B., et al. Shear modulus and damping relationships for gravels. Journal of Geotechnical and Geoenvironmental Engineering, Vol. 124, Issue 5, 1998, p. 396-405.
-
Kong Xian-jing, Lou Shulian, Zou De-gao The equivalent dynamic shear modulus and equivalent damping ratio of rockfill material for dam. Journal of Hydraulic Engineering, Vol. 8, 2001, p. 20-25.
-
Hardin Bobby O., Kalinski Michael E. Estimating the shear modulus of gravelly soils. Journal of Geotechnical and Geoenvironmental Engineering, Vol. 131, Issue 7, 2005, p. 867-875.
-
Li Chong, He Chang-rong, Wang Chen, et al. Study of scale effect of large-scale triaxial test of coarse-grained materials. Rock and Soil Mechanics. 2008, p. 563-566.
-
Feng Zheng-yi, Tsai Pei-hsun, Li Jun-nan Analyses of the dynamic responses of Li-yu-tan Earthdam subjected to Chi Chi earthquake. Journal of the Chinese of Soil and Water Conservation, Vol. 37, Issue 3, 1994, p. 271-289, (in Chinese).
-
Duncan J. M., Byrne Peter, Wong Kai S., et al. Strength, Stress-Strain and Bulk Modulus Parameters for Finite Element Analyses of Stresses and Movements in Soil Masses. University of California, Berkeley, Report No. UCB/GT/80-011980.
-
Ju Lianyi The Seismic Analysis and Seismic Design of Manla Rockfill Dam. Dalian University of Technology, Dalian, 2002, (in Chinese).
-
Cheng Run-hu Study on geological properties of rock-fill material in Zhangfeng reservoir. Journal of Water Resources and Architectural Engineering, 2010, p. 159-173., (in Chinese).
-
Jia Gexu Experimental Study on Enginerring Properties of Coarse-Grained Soils. Dalian University of Technology, Dalian, 2004, (in Chinese).
-
Zhang Lin Study on Influencing Factors of Embankment Dam Seismic Response. Hohai University, Nanjing, 2008, (in Chinese).
-
Lu Tinghao, Shao Song Gui 3-D Nonlinear FEM Analysis for TSQ-I Hydroelectric Project Concrete Face Rockfill Dam. Hongshui River, 1996, p. 20-23, (in Chinese).
-
Ling Hua, Fu Hua, Han Hua-qiang, et al. Experimental study on effects of particle breakage on static and dynamic characteristics of rock-fill materials. Journal of Water Resources and Architectural Engineering, 2010, p. 44-47, (in Chinese).
-
Institute of Earthquake Engineering Dalian University, Technology of Static and Dynamic Analysis of Core Rock-fill Dam of Shuangjiangkou Hydropower Station. Dalian University of Technology, Dalian, 2008, (in Chinese).
-
Shen Zhenzhong, Xu Liqun, Wang Wei Earthquake response of Xieka concrete face rockfill dam by FEM. American Society of Civil Engineers, Honolulu, HI, United States, 2010.
-
Han Guo-cheng, Luan Mao-tian, Liu Wen-ting, et al. Three-dimensional nonlinear analysis of seismic response of Pubugou cored rockfill dam. Journal of Dalian University of Technology, 2000, p. 218-233, (in Chinese).
-
Institute of Earthquake Engineering Dalian University, Technology of Static and Dynamic Analysis of Core Rock-fill Dam of Changheba Hydropower Station. Dalian University of Technology, Dalian, 2008, (in Chinese).
-
Ren Jinke Finite Element Analysis of Xi Liu Shui Face Rockfill Dam. Xi’an University of Technology, Xi’an, 2006, (in Chinese).
-
Kong Xianjing, Zhou Yang, Zou Degao, et al. Numerical analysis of dislocations of the face slabs of the Zipingpu concrete faced rockfill dam during the Wenchuan earthquake. Earthquake Engineering and Engineering Vibration, 2011, p. 581-589.
-
Zhao Yixin The Finite Element Analysis for Dynamic Stress and Deformation Characteristics of High Concrete-Face Rockfill Dam Built in Deep Alluvial Deposit. Xi’an University of Technology, Xi’an, 2009, (in Chinese).
-
Chi ShiChun, Kong XianJing, Li JunJie Research on Computation Theory of Core Rockfill Seismic Response Analysis and Aseismatic Measures. Report 4 of Science and Technology Project of State Grid Corporation of China. Dalian University of Technology, 2006, (in Chinese).
-
Jia Yufeng, Chi Shichun Back-analysis of soil parameters of the Malutang II concrete face rockfill dam using parallel mutation particle swarm optimization. Computers and Geotechnics, Vol. 65, 2015, p. 87-96.
-
Wang Y. H., Siu W. K. Structure characteristics and mechanical properties of kaolinite soils. II. Effects of structure on mechanical properties. Canadian Geotechnical Journal, Vol. 43, Issue 6, 2006, p. 601-617.
-
Gu Ganchen, Shen Changsong, Cen Weijun Earthquake Engineering for Earthrock Dams. China Water Power Press, Beijing, 2009, (in Chinese).
-
Zhou G., Liu X., Zhao J., Liu Q., Yang Y., Yang Z. The shaking table model test study on acceleration seismic response of Zipingpu CFRD. China Civil Engineering Journal, Vol. 45, 2014, p. 20-24, (in Chinese).
-
Zou D., Xu B., Kong X., Liu H., Zhou Y. Numerical simulation of the seismic response of the Zipingpu concrete face rockfill dam during the Wenchuan earthquake based on a generalized plasticity model. Computers and Geotechnics, Vol. 49, 2013, p. 111-122.
About this article

This research was supported by the National Natural Science Foundation of China (Nos. 51109027, 51179024, 51379029 and 51576029) and the Fundamental Research Funds for the Central Universities (No. DUT12LK11)
