Abstract
In order to evaluate the comprehensive dynamic performance of probability screen and select the appropriate working conditions, a dynamic model of probability screen vibration system is established. Then, the calculation method of the dynamic characteristic parameters, based on the time series Auto Regression (AR) model of vibration test, is used. The relationship among the comprehensive dynamic characteristics, the screening efficiency and the box dimension of probability screen vibration system is analyzed, and Least Square Support Vector Machine (LSSVM), Generalized Regression Neural Network (GRNN) and Back Propagation Neural Network (BPNN) are used to predict the screening efficiency with box dimension. The analysis result shows that the screening efficiency, the stability, the response rapidity and the comprehensive dynamic characteristic of the system are all related to the box dimension of time series. As for the complexity of probability screen vibration system, it affects the comprehensive dynamic performance, and ultimately touches the screening efficiency of the probability screen; The best working conditions for the system are selected by the curve between box dimension and the working condition parameter; Taking box dimension as the only input variable, the prediction accuracy of the screening efficiency is high by using LSSVM,GRNN and BPNN methods, the prediction results are stable and reliable, and the box dimension can be used as a single input variable to predict the screening efficiency, it has the advantages of fewer input parameters, high prediction efficiency, and high prediction accuracy, which has great potential for expanding application space and further research value.
Highlights
- The related parameters of the vibration stationarity of the screening system are associated to the box dimension of the time series. The relationship between the dynamic characteristic parameters of the screening system and the box dimension reflects that the response speedis related to the box dimension of the time series.
- The comprehensive dynamic performance of screening system can be quantitatively measured through the box dimension, and the box dimension of time series is a parameter to intuitively measure the comprehensive dynamic performance of the system. The screening efficiency of probability screen is related to the dynamic comprehensive performance and to the box dimension of the system. The smaller the box dimension of time series is, and the higher the screening efficiency of the system is.
- The combination of AR model and the box dimension based on time series provides a theoretical basis for the further study of probability screen, the optimal operating parameters are selected for probability screen.
- The box dimension of the time series of the screening vibration system can be used as a single input parameter to predict, analyze and apply the screening efficiency. Its prediction operation speed is fast,the prediction accuracy is high,and the prediction result is stable and reliable. It has great potential for expanding application space and further research value.
1. Introduction
Vibration probability screen was successfully studied in 1997 in China, it is a kind of equipment widely used in screening operation. One of the main indicators for evaluating probability screen is screening efficiency [1]. Screening efficiency is also the main problem in screening theory research. In 2003, WEN Bangchun proposed an equal thickness probability screening method, which combines the advantages of probability screening method and equal thickness screening method [2-3]. At present, most of the methods for probability screen describe the screening process by the movement of a single particle or particle swarm on the screen surface, or by improving the screening efficiency and eliminating the blocking phenomenon based on the mechanical model in the simulation software [4-5]. The screening process was simulated and analyzed by the Discrete Element Method (DEM) in Literature [6], the effects of different screening parameters on the screening efficiency were simulated and studied. Huang Yijian et al. [7-10] proposed to use statistical theory based on research methods such as fractal dimension, high-order spectrum of time series and LSSVM to extract motion features in the process of probability screening, and they reached good results. The probability screen is influenced by factors like screen inclination, vibration frequency, amplitude, wind speed, air volume, wind blowing angle, screen structure parameters, sand flow rate, moisture content of dry sand, environmental temperature, etc., especially by screen structure parameters and vibration parameters of probability screen (including vibration frequency, screen surface amplitude, vibration direction angle and screen inclination angle, etc. [11-13]). So, the influence of these deterministic and stochastic factors on the screening process is not a deterministic linear relationship, but a very complex non-linear relationship [14-15]. In the existing research, the dynamic model of the system has not been established for probability screening system, and the relationship between AR model and dynamic model has not been established to obtain the dynamic characteristic parameters, the factors that affect the screening efficiency of the system itself have not been identified. Moreover, there is no research on the prediction of the system according to the key parameters of the system complexity. Thus, the appropriate working conditions have not been effectively selected from these parameter correlations.
According to the working characteristics of probability screen, taking the testing prototype system as the research object, the dynamic model and dynamic equation were established, and the same order AR model of time series was established. According to the corresponding relationship between the dynamic model and the AR model, we derived the calculation formula of the dynamic characteristic parameters of the system, and obtained the dynamic characteristic parameters, the box dimension and the real part of characteristic roots directly from the time series of the vibration test signals. We analyzed the key parameters affecting the dynamic performance and the screening efficiency of the system using the relationship curves between the parameters. Based on the relationships between the dynamic characteristics and the working conditions, the system complexity and the working conditions, the related factors affecting the screening efficiency of the vibration system are studied from dynamic characteristics and system complexity, and system complexity and working conditions were provided to select the optimum working and structural parameters of probability screen. Then using the box dimension of time series as a single input parameter to predict the screening efficiency of the system, terrifying the rationality and effectiveness of the box dimension of time series as a characterization of screening system, so as to significantly reduce the dimensionality of the input parameters of the system prediction model, improve prediction efficiency, and lay the foundation for further application and expansion research.
2. Dynamic modeling and parameter solution of system
2.1. Structure and working principle of probability screen prototype
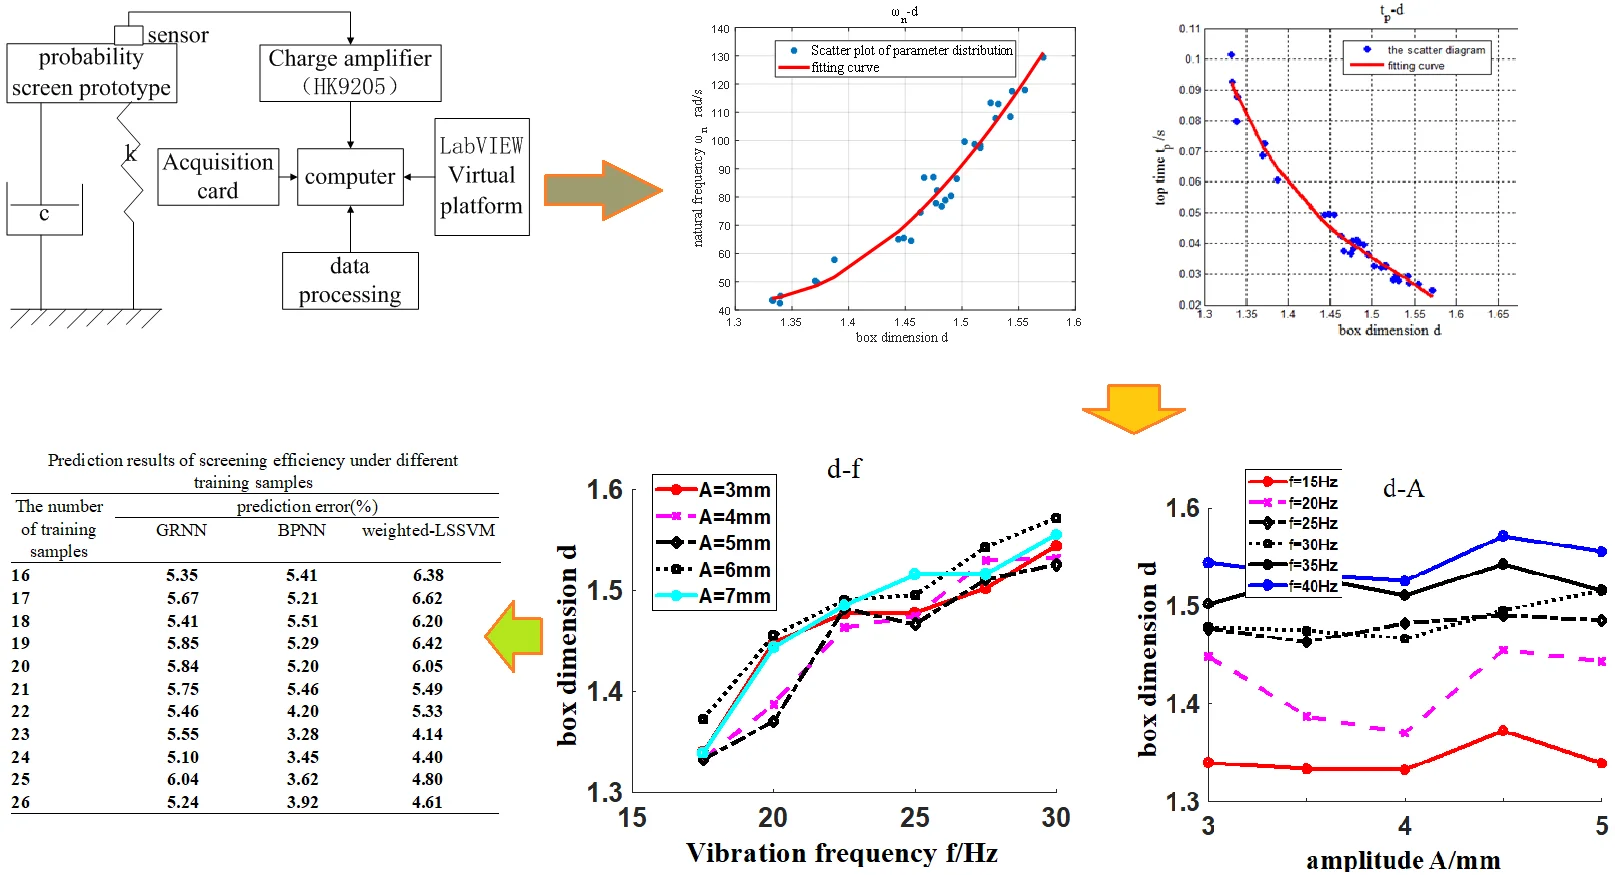
This experiment uses the probability screen experimental machine (Fig. 1) developed by Huang Yijian’s team. It was designed based on the probability screening theory; thus, the smaller the particle size of the material relative to the size of the screen hole is, the greater the probability of the material passing through the screen will be. The probability screen prototype is mainly composed of a box frame, an exciting motor and a screen mesh. When the prototype operates, two vibrating motors with eccentric blocks rotate backward and synchronously, resulting in vertical exciting force moving up and down, which makes the screen prototype vibrate in the same direction. In screening operation, screen meshes with different mesh apertures, are adopted according to the size of feed size, so as to improve the screening efficiency and processing capacity of the screen. The screening prototype's funnel feeds material into the screen's outlet, where it is quickly dispersed over the surface of the vibrating screen and then separated from the material’s exit under or above the screen. The system sketch of the vibration test prototype is shown in Fig. 2 [5, 10].
2.2. Dynamic modeling of system
From the structural sketch of the system (Fig. 2), it can be seen that the vibration system of the probability screen prototype is a second-order system, and the differential equations of system dynamics after Laplace transformation can be expressed as follows:
where is the quality of eccentric blocks, is the damping coefficient of the system, is the elastic coefficient of the system, is variable, is the result of displacement after Laplace transformation, is the result of the excitation force after Laplace transformation.
Fig. 1Structure diagram of probability screen [10]
![Structure diagram of probability screen [10]](https://static-01.extrica.com/articles/23522/23522-img1.jpg)
Fig. 2Structure diagram of vibration system and signal testing [10]
![Structure diagram of vibration system and signal testing [10]](https://static-01.extrica.com/articles/23522/23522-img2.jpg)
For the sampled time series vibration signals, AR model of the corresponding discrete system can be established as follows [15]:
where is a lag operator, and and are determined by the least square method of AR(2) model [15-17].
According to Chen et al. [15] proposed, the corresponding relationship between the autoregressive AR(2) model of the second-order vibration system and the second-order discrete system can be established, and Eqs. (3-8) are derived to solve the dynamic characteristic parameters from the time series.
The damping ratio of the system is [15]:
The undamped natural frequency of the system is [15]:
Then the maximum overshoot of the system is [15]:
The peak time is [15]:
The rise time is [15]:
The adjustment time of system with error of 2 % is [15]:
3. Vibration testing
In order to obtain the vibration signal of the probability screen vibration system in the screening process, a screening vibration signal collection and detection system, based on LabVIEW virtual platform, was built. The test system is mainly composed of a probability screen vibration system, a data acquisition card (PCI6014), the main control computer, a piezoelectric acceleration sensor (HK9103), a charge amplifier (HK9205), and the LabVIEW based front and rear test panels, etc. The schematic diagram of the whole test system is shown in Fig. 2. The main technical specifications of the acceleration sensor (HK9103) include: the sensitivity is 45 pC/ms-2, the frequency range is 0.22800 Hz, the installation resonance frequency is 12KHz, the measurement range is 3000 ms-2, the mass is 75 g, and operating temperature of –40-120 ℃. The main technical indicators of the data acquisition card (PCI6014) include: the maximum sampling frequency is 200 kS/s,16 single ended analog inputs with 16-bit accuracy, two 16-bit single ended analog outputs, voltage input range is ± 0.1~± 10 V, two 24-bit counters/timers and 8 digital I/O cables [5, 10].
In order to find the suitable working conditions for the probability screen and analyze the factors affecting its screening efficiency, this test detects the vibration displacement, the acceleration signals and the corresponding screening efficiency of the system under different excitation frequencies and screen surface amplitudes. The working conditions are as follows:
– the excitation frequencies are 15, 20, 25, 30, 35 and 40 Hz;
– the screen surface amplitude is 3, 4, 5, 6and 7mm for each excitation frequency.
There will be30 screening conditions in total, that is, 30 sets of vibration test signal data and corresponding screening efficiency. The vibration signals collected by the testing system often contain a lot of noise and other random interference, and are not suitable for direct analysis and processing. The median method is used to filter out the deterministic part of the low frequency of the original signal to obtain colored noise with zero mean for further modeling or analysis.
The AR model is established according to the displacement time series obtained from the vibration test, and the coefficient and in Eq. (2) are obtained according to the least square method; once they are substituted in Eqs. (3)-(8), the dynamic characteristic parameters of the probability screen vibration system are obtained.
4. Analysis of experimental results
Plotscatter distribution diagram and quadratic fitting relationship curve between the dynamic characteristic parameters , working state parameters of the system calculated above and the box dimension d of the time series, as shown in Fig. 3, Fig. 4, and Fig. 5.
4.1. Stability and vibration stationarity analysis of system
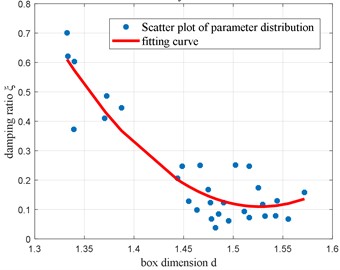
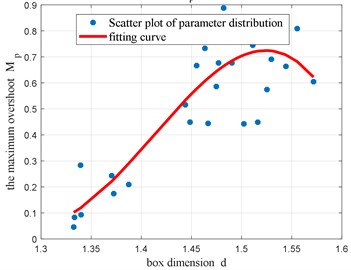
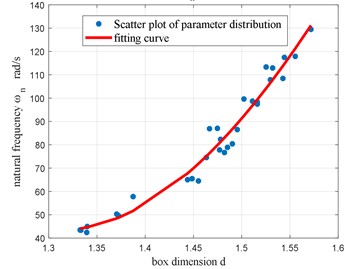
Fig. 3 shows the distribution diagram and quadratic fitting curve for the relationship between the dynamic characteristic parameters and the value for the set of 30 measurements of vibration systems already defined. Table 1 presents the correlation coefficients between each dynamic characteristic parameter of the system and the box dimension () [18-20] of the corresponding vibration signal. From the analysis in Table 1 and Fig. 3, it can be seen that:
Fig. 3Diagram and fitting curve of parameters along with d
a)-
b)-
c)-
The damping ratio (), the maximum overshoot () and the natural frequency () are parameters that reflect the stationarity of the screening vibration system. Added to that, the absolute values of their correlation coefficients with the box dimension () are all close to 1. Thus, there is a strong correlation between these parameters and the box dimension (that is, the complexity of the system). The change characteristics of the quadratic fitting curve and these correlation coefficients reflect the stationarity change of the vibration of the screening system. The larger the damping ratio () is (or the smaller the maximum overshoot ()), the smaller the box dimension () of the corresponding time series will be.
The above analysis shows that the box dimension of the time series of the screening system reflects the change of the stability of the system vibration. The smaller the value of is, the better the stability of the system will be. The box dimension of the time series can be used to evaluate the vibration stability of the system.
Table 1Correlation coefficient between two parameters
Parameter | |||||||
–0.86035 | 0.959169 | 0.831983 | –0.94133 | –0.96811 | –0.86035 | –0.74468 | |
0.59454 | –0.77291 | -0.61758 | 0.647545 | 0.68511 | 0.59454 | – |
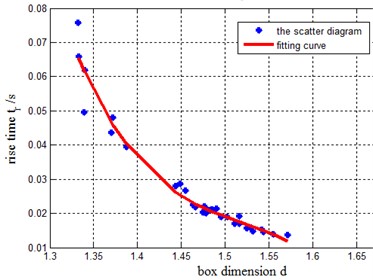
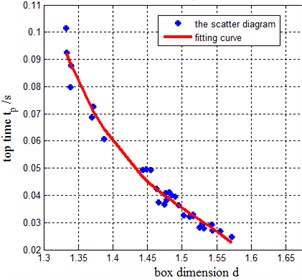
4.2. Rapidity analysis of system response
Referring to the correlation coefficients of the parameters in Table 1 and the scatter plot diagram of box dimension in Fig. 4, it can be seen that the correlation coefficients between the box dimension and the parameters of rising time , peak time , the adjusting time (all three parameters reflecting the response rapidity of the system) are large and there are strong negative correlation between them. This indicates that the bigger the box dimension of time series is, the smaller , , and will be, the more complex the dynamic information of the system will be, and the worse the response rapidity of the system will also be. The box dimension of time series is also a parameter to evaluate the response rapidity of the system intuitively.
Fig. 4Scatter diagram and fitting curve of response rapidity parameters along with d
a)-
b)-
4.3. Comprehensive dynamic performance analysis of system
It can be seen from the above analysis that box dimension can reflect, not only the vibration stationarity of the system, but also its response speed. The smaller the value of box dimension is, the less the dynamic information of the system will be, and the smaller the complexity of the system is, the better the stationarity and response rapidity of the system will be; thus, the better the comprehensive dynamic performance of the system will be reached. This shows that the box dimension is a parameter for evaluating the comprehensive dynamic performance of the system intuitively and quantitatively. The same conclusion can be drawn from the correlation coefficients between each parameter and the box dimension (refer to Table 1) and the quadratic fitting curve of scatter plot.
4.4. Analysis of factors affecting screening efficiency
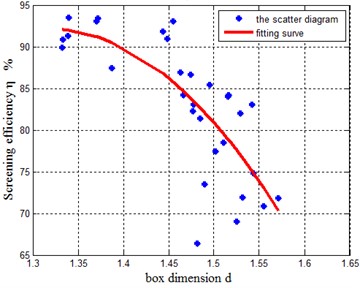
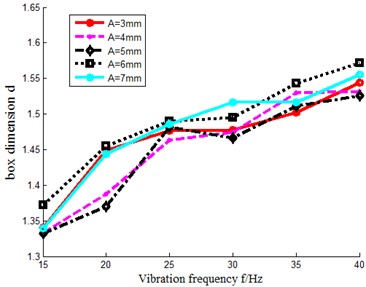
Through calculation, the correlation coefficient between screening efficiency and box dimension is –0.74468. There is a strong negative linear correlation between and of time series. Scatter plot and fitting curve of - in Fig. 5(a).
Fig. 5Curves of η-d, d-A and d-f
a)-
b)-
c)-
It also shows that the smaller the box dimension is, the higher the screening efficiency will be. This result reflects that the screening efficiency of the system has a strong correlation with box dimension of time series and the comprehensive dynamic performance of the system. The better the comprehensive dynamic performance of the system is, the smaller the box dimension of time series is, and the higher the screening efficiency of the system is.
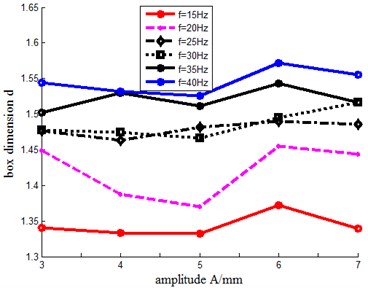
Based on the above analysis, according to the relationship curves obtained in Figs. 5(a), (b) and (c), it can be seen that the box dimension of time series increases with the excitation frequency whereas the comprehensive dynamic performance of the system decreases at the same vibration amplitude. However, at the same excitation frequency, the box dimension of time series shows different non-linear characteristics with the increase of amplitude, and the overall impact is relatively smaller. Thus, when 15 Hz and 20 Hz, the box dimension of the time series is smaller, which indicates that the system has a better comprehensive dynamic performance and a higher screening efficiency.
4.5. Prediction of screening efficiency based on box dimension
Based on the above analysis, the box dimension of the time series of the vibration system reflects its comprehensive dynamic performance and its strong correlation with the screening efficiency. Therefore, the box dimension of the time series in the 30 different states is selected as the single input parameter of the screening system, and the weighted-LSSVM, GRNN and BPNN are used to predict the screening efficiency. The box dimension and the screening efficiency of 30 groups under different conditions are divided into two parts, one used for the training sample and the other for the prediction sample. For the weighted-LSSVM, the Radial Basis Function (RBF) kernel function is selected, the cross validation method and the grid search method are combined to optimize the output and to determine the kernel parameter and the penalty factor , to predict the screening efficiency value, and to calculate the prediction error percentage between the prediction value and the measured value; For GRNN, the parameter that affects its prediction algorithm is the penalty factor Spread. Different Spread ranges are set in the prediction to obtain corresponding different prediction accuracy, and the best prediction accuracy is selected to evaluate the prediction effect. For BPNN, the hidden layers is set 30, in order to prevent uncertainty in the prediction results, 5 repeated predictions are perform at a given number of training samples, then the average of the 5 predictions is calculated to evaluate the prediction effect. The prediction results are listed in Table 2.
Table 2Prediction results of screening efficiency under different training samples
The number of training samples | Prediction error (%) | ||
GRNN | BPNN | Weighted-LSSVM | |
16 | 5.35 | 5.41 | 6.38 |
17 | 5.67 | 5.21 | 6.62 |
18 | 5.41 | 5.51 | 6.20 |
19 | 5.85 | 5.29 | 6.42 |
20 | 5.84 | 5.20 | 6.05 |
21 | 5.75 | 5.46 | 5.49 |
22 | 5.46 | 4.20 | 5.33 |
23 | 5.55 | 3.28 | 4.14 |
24 | 5.10 | 3.45 | 4.40 |
25 | 6.04 | 3.62 | 4.80 |
26 | 5.24 | 3.92 | 4.61 |
As can be seen from Table 2, the number of training samples increased from 16 to 26, the number of prediction samples decreased from 14 to 4, the prediction errors are in the range of 3.28 %-6.38 %, the prediction accuracy is high, and the change of the number of training samples has little impact, the lowest prediction error (3.28 %) can be obtained through BPNN model prediction. This shows that taking the box dimension of time series as a single prediction input parameter can effectively predict the screening efficiency of the system. The training samples have little impact on the prediction accuracy, and the prediction results are constant and reliable. It can be seen that using the time series box dimension to characterize the characteristics of the screening system is reasonable and effective, with fewer input variables, high prediction efficiency, and high prediction accuracy.
5. Conclusions
Based on the analysis of the dynamic differential equations and the calculation of dynamic characteristic parameters of the vibration system for the probability screen prototype, the dynamic characteristic parameters and box dimension are obtained through the time series of the probability screen vibration system, and the relationship between the screening efficiency, box dimension and the system working state parameters is analyzed, the following conclusions are drawn:
1) From the dynamic model of the probability screen prototype vibration system and its corresponding relationship with AR model of the same order, a convenient method for solving the dynamic characteristic parameters of the system based on AR model of time series is obtained;
2) The related parameters of the vibration stationarity of the screening system are associated to the box dimension of the time series;
3) The relationship between the dynamic characteristic parameters of the screening system and the box dimension reflects that the response speed is related to the box dimension of the time series;
4) The comprehensive dynamic performance of screening system can be quantitatively measured through the box dimension, and the box dimension of time series is a parameter to intuitively measure the comprehensive dynamic performance of the system;
5) The screening efficiency of probability screen is related to the dynamic comprehensive performance and to the box dimension of the system. The smaller the box dimension of the time series is, the better the comprehensive dynamic performance of the system will be, and the better the screening effect of the probability screen will be.
6) The combination of AR model and the box dimension based on time series provides a theoretical basis for the further study of probability screen, the optimal operating parameters are selected for probability screen.
7) The box dimension of the time series of the screening vibration system can be used as a single input parameter to predict, analyze and apply the screening efficiency. Its prediction operation speed is fast, the prediction accuracy is high, and the prediction result is stable and reliable. It has great potential for expanding application space and further research value.
References
-
Piotr Czubak, Robert Klisowski, Tomasz Gawenda, and Akademia Gomiczo Hutnicza, “Vibrating screen, especially with slotted sieve, and method for controlling the operation of the screen, especially with slotted sieve,” EP3842158A1, 2020.
-
H. Kruggel‐Emden and F. Elskamp, “Modeling of screening processes with the discrete element method involving non‐spherical particles,” Chemical Engineering and Technology, Vol. 37, No. 5, pp. 847–856, May 2014, https://doi.org/10.1002/ceat.201300649
-
Z. B. Li and Y. J. Huang, “Analysis of screen vibration signals of probability sieve using AR bispectrum and its diagonal slices,” Mechanical Science and Technology for Aerospace Engineering, Vol. 31, No. 1, pp. 113–117, 2012, https://doi.org/10.13433/j.cnki.1003-8728.2012.01.019
-
A. Tamborrino, C. Perone, R. Romaniello, B. Bianchi, A. Berardi, and A. Leone, “Numerical simulation and experimental validation of a vibrating screen for the sieving of chamomile (matricaria Chamomilla L.),” Chemical Engineering Transactions, Vol. 87, pp. 277–282, Jul. 2021, https://doi.org/10.3303/cet2187047
-
Q. Tang and Y. J. Huang, “Analysis of probability screen efficiency using bispectrum estimation based on AR model,” Journal of Huaqiao University (Natural Science), Vol. 32, No. 3, pp. 253–257, 2011.
-
L. L. Zhao, C. S. Liu, J. X. Yan, X. W. Jiang, and Y. Zhang, “Numerical simulation of particles flow on the vibrating screen plate using a 3D discrete element method,” Journal of China University of Mining and Technology, Vol. 39, No. 3, pp. 414–419, 2010.
-
T. Bento Linhares and C. Bruno Santos Vimieiro, “Analysis of the dynamic forces acting on a vibrating screen and its support structure using a scale model,” Measurement, Vol. 176, No. 3, p. 109179, May 2021, https://doi.org/10.1016/j.measurement.2021.109179
-
Y. Hou, G. Xiong, P. Fang, M. Du, and Y. Wang, “Stability and synchronous characteristics of a two exciters vibration system considering material motion,” Proceedings of the Institution of Mechanical Engineers, Part K: Journal of Multi-body Dynamics, Vol. 236, No. 1, pp. 15–30, Mar. 2022, https://doi.org/10.1177/14644193211056138
-
A. Greune and P. Berlitz, “Innovative multiple vibrating screen in action at HKM,” AT Mineral Processing, No. 12, p. 62, 2021.
-
Q. Tang, “Study on time frequency characteristics of wigner higher order spectrum and its application in screening operation,” Huaqiao University, 2011.
-
Q. T. Chen, Y. R. Song, and Y. J. Huang, “Accurate modeling and performance investigation on MR vibration system based on the ARMA model,” Chinese Journal of Scientific Instrument, Vol. 36, No. 5, pp. 1014–1022, 2015, https://doi.org/10.19650/j.cnki.cjsi.2015.05.007
-
Y. Li, P. Zhao, L. Mo, T. Ren, and M. Zhang, “Numerical simulation of particle screening efficiency of large multi-layer vibrating screen based on discrete element method,” Proceedings of the Institution of Mechanical Engineers, Part E: Journal of Process Mechanical Engineering, Vol. 236, No. 2, p. 095440892110606, Nov. 2021, https://doi.org/10.1177/09544089211060601
-
C. Wu, T. Chen, R. Jiang, L. Ning, and Z. Jiang, “A novel approach to wavelet selection and tree kernel construction for diagnosis of rolling element bearing fault,” Journal of Intelligent Manufacturing, Vol. 28, No. 8, pp. 1847–1858, Dec. 2017, https://doi.org/10.1007/s10845-015-1070-4
-
M.-N. Pham, H. Champliaud, Z. Liu, and I. A. Bonev, “Parameterized finite element modeling and experimental modal testing for vibration analysis of an industrial hexapod for machining,” Mechanism and Machine Theory, Vol. 167, p. 104502, Jan. 2022, https://doi.org/10.1016/j.mechmachtheory.2021.104502
-
Q. T. Chen, Y. R. Song, and Y. J. Huang, “Characteristic research of MR damper based on AR model fractal dimension,” Chinese Journal of Scientific Instrument, Vol. 37, No. 12, pp. 2774–2781, 2016, https://doi.org/10.19650/j.cnki.cjsi.2016.12.017
-
M. A. Pala, M. E. Çimen, A. Akgül, M. Z. Yıldız, and A. F. Boz, “Fractal dimension-based viability analysis of cancer cell lines in lens-free holographic microscopy via machine learning,” The European Physical Journal Special Topics, Vol. 231, No. 5, pp. 1023–1034, Jun. 2022, https://doi.org/10.1140/epjs/s11734-021-00342-3
-
A. Accardo, G. D. ’Addio, R. Maestri, D. Vitale, G. Furgi, and F. Rengo, “Fractal dimension and power-low behavior reproducibility and correlation in chronic heart failure patients,” in 11th European Signal Processing Conference, 2002.
-
Z. Dvorák, D. Goncalves, A. Lahiri, J. Tan, and T. Ueckerdt, “On comparable box dimension,” arXiv:2203.07686, 2022, https://doi.org/10.48550/arxiv.2203.07686
-
L. A. P. de Sá, K. M. C. Zielinski, O. Rodrigues, A. R. Backes, J. B. Florindo, and D. Casanova, “A novel approach to estimated Boulingand-Minkowski fractal dimension from complex networks,” Chaos, Solitons and Fractals, Vol. 157, p. 111894, Apr. 2022, https://doi.org/10.1016/j.chaos.2022.111894
-
A. Bărbulescu, “The estimation of the graph box dimension of a class of fractals,” in 7tt Balkan Conference on Operational Research “BACOR 05” Constant, May 2005.
About this article

Guiding science project of Fujian Province (2018H0031, 2021H0059); Team Construction Funds for Advanced Materials and Laser Processing of Putian University; Fujian province Key Laboratory of CNC Machine Tools and Intelligent Manufactruring (KJTPT2019ZDSYS02020063). Thanks for the strong support, guidance and help of Huang Yijian’s team from Huaqiao University.
The datasets generated during and/or analyzed during the current study are available from the corresponding author on reasonable request.
Qingtang Chen is responsible for the construction of the overall framework of the paper, algorithm design, calculation and result analysis, and the writing of the paper. Yijian Huang is responsible for providing experimental equipment, experimental conditions and experimental test data.
The authors declare that they have no conflict of interest.
