Abstract
Since the vibration signals of gearbox are non-linear and non-stationary, it is difficult to accurately evaluate the working conditions. Therefore, a fault feature extraction technique based on intrinsic characteristic-scale decomposition (ICD) and multi-scale entropy (MSE) is presented in this paper. The measured signals are firstly decomposed into a series of product components (PCs) by ICD. Secondly, the main product component is selected, and then MSE is used to extract the feature vectors from the selected PCs. Finally, the obtained feature vectors of gearbox with different scale factors are adopted as inputs of support vector machine (SVM) to fulfill the fault patterns identification. The superiority of the proposed technique is verified through comparing with three other methods.
1. Introduction
Rotating machines are playing an important role in the industry field and widely used in automatics, helicopters, railways and transportations, thus high speed, large load and other conditions can lead to its high damage probability. Faults even result in equipment health deterioration and breakdown [1, 2]. As the typical rotating machinery, gear fault diagnosis has attracted considerable attention in recent years [3]. The vibration analysis method has been widely applied in diagnosing the gear fault due to its intrinsic merits of revealing gear failure [4, 5].
Recently, the commonly used time-frequency analysis methods are empirical mode decomposition (EMD) [6-8] and local mean decomposition (LMD) [9-11]. EMD can decompose a signal into intrinsic mode functions (IMFs) and a residual. However, EMD method exists some drawbacks, such as mode mixing, end effect and negative frequency, etc. In order to improve EMD, LMD was proposed by S. Smith. LMD method also has the problems of mode mixing and time consuming. A new time-frequency method, named intrinsic time-scale decomposition (ITD), was proposed by Frei and Osorio in 2006 [12]. In the opinion of the proposer, ITD can overcome the limitations of EMD, such as the end effect and the sifting process.
Inspired by the sifting process of LMD and ITD, intrinsic character-scale decomposition (ICD), a new self-adaptive method is proposed in the document [13]. After describing the product component (PC), a complex signal can be decomposed into a series of PCs and a residue. When fault occurs, the vibration signal shows AM-FM characteristics. Since ICD decomposition process is the demodulation process, it can be used to demodulate the feature of the vibration signal.
Sample entropy was proposed by Richman and Moorman [14], however, in the real application the sample entropy algorithm often produced contradictory results. To avoid the drawbacks of single sample entropy, Costa [15] put forward a multi-scale entropy procedure to estimate the complexity of the original time series over a range of scales. Multi-scale entropy (MSE) was firstly applied for heart rhythm variability research. Later, MSE was used in the field of fault diagnosis [16,17]. In this paper., MSE is used as feature extractor Based on the above analysis, the demodulation methods LMD and MSE are combined and applied to the gearbox.
The rest of this paper is organized as follows: the main steps of ICD are introduced in Section 2. In Section 3, the basis of MSE is described. Meanwhile, the feature extraction procedure based on LMD and MSE is proposed. The experiment data analysis of the gearbox vibration signals with different fault conditions is presented in Section 4. Finally, conclusion is drawn in Section 5.
2. Intrinsic characteristic-scale decomposition
2.1. Description of PC
Similar to LMD, ICD is a self-adaptive decomposition method. ICD can self-adaptively decompose a multi-component signal into a small set of product components (PCs), each of which is the product of an amplitude envelope signal and a purely frequency modulated signal [13]. Any two PCs are independent to each other, the definitions of PC should be met two conditions:
(1) Among all the data set, all the maximum points are positive, all the minimum points are negative.
(2) In the whole data set, suppose all the extreme points as . Given any adjacent extreme points and at the and are the following relationships:
where:
where is the number of extreme points.
Fig. 1Illustration of the friendship between Ak and Xk using a mono-component signal
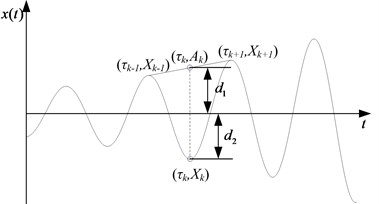
Generally, (–1) is shown as Fig. 1. The above conditions have assured that the PC has a single mode between two adjacent extreme points.
2.2. ICD method
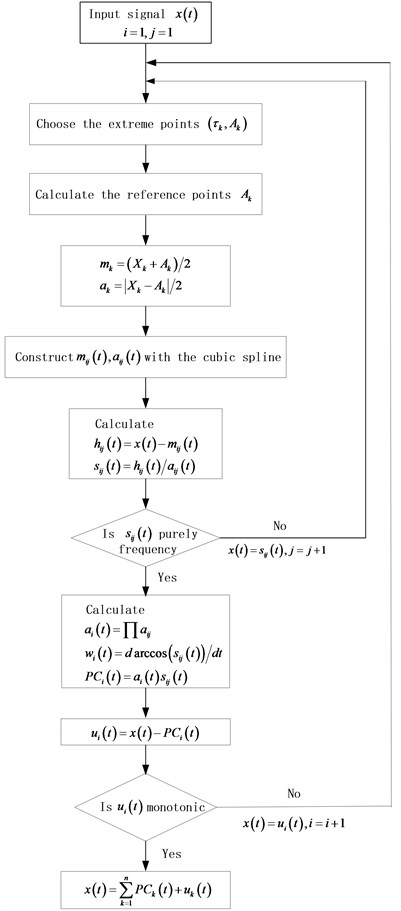
Based on the description of PC, using ICD method, the original signal can be reconstructed by a series of PCs and a residual. For any signal , it can be decomposed in the following way.
(1) Suppose and calculate the reference points according to Eq. (2). Since the calculate value of ranges from 2 to , it is needed to extend the boundary of the data, which is done by the mirror-symmetric extension method [18]. By doing this, two extreme values can be got and written as ( and (. Then, and can be calcluated by Eq. (2), and the can be obtained.
(2) Calculate the corresponding local mean points and local envelope points , respectively:
(3) All the local mean points and envelope points are connected by the cubic spline method to construct the local mean function and the envelope function .
(4) The local mean function is subtracted from the original signal , then the new data is given as follows:
is then amplitude demodulated by dividing into :
If is a purely frequency signal, go to step (5). Otherwise, regard as the original signal and repeat the above steps.
(5) The corresponding envelope signal is given by multiplying together the envelope estimate functions that are obtained during the step (4) iteration process:
(6) Multiply by the envelope function and the first product component is got:
(7) is then subtracted from the original signal resulting in a new signal . So becomes the new data and the whole process is repeated times until the residual , is the number of the product components) is a monotonic function or contains no more oscillations.
After the original signal is decomposed by ICD method, multiple PCs can be obtained, which are listed from high frequency to low frequency. ICD has the advantages in alleviating the mode mixing problem and restraining the end effect compared with LMD. The flowchart of ICD is illustrated in Fig. 2.
3. Multi-scale entropy and the proposed method
3.1. Multi-scale entropy (MSE)
Recognizing the gear states, it need extract feature from the fault signals. In order to overcome the disadvantages of sample entropy, MSE is developed to determine the complexity of time series for a series of scales [19]. MSE is illustrated in the following procedures:
1) Given the one-dimensional discrete time series , the coarse-grained time series can be constructed at a scale factor of ( is a positive integer), according to Eq. (9):
where is the scale factor. The coarse-grained time series at the scale of is obtained through calculating the mean of the neighboring values (an example is shown in Fig. 3). Especially, when 1, the coarse-grained time series is the original time series.
Fig. 2A flowchart of ICD method
2) Details of the SampEn algorithm can be found in the literature [17]. In this paper, the MSE of each coarse grained time series is calculated with 2 and 0.15, where is embedding dimension, is similar tolerance and σ denotes the standard deviation (SD) of the original time series. The SampEn of each coarse-grained time series is calculated and then plotted as the function of the scale factor [16]. The procedure is the MSE analysis.
3.2. The proposed method for gear diagnosis
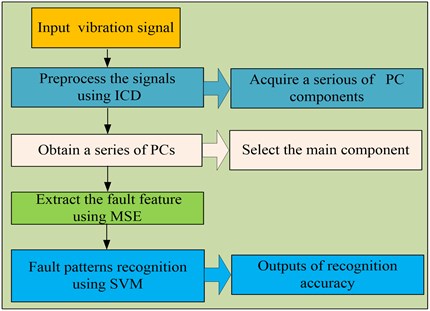
The feature extraction method based on ICD and MSE is proposed in this paper, it can be described as follows:
1) The vibration signals are sampled by acceleration sensors at a certain sampling frequency under different working conditions.
2) ICD is applied to decompose the vibration signals into a series of PCs.
3) Select the main PC that contains the most significant information.
4) MSE is used to calculate the selected PCs under different scales.
5) The obtained fault features are fed into fault classifier SVM in order to identify the different working conditions.
A flow chart of the proposed algorithm is presented in Fig. 4.
Fig. 3The scheme illustrating the coarse-graining of the original time series for τ= 2 and τ= 3
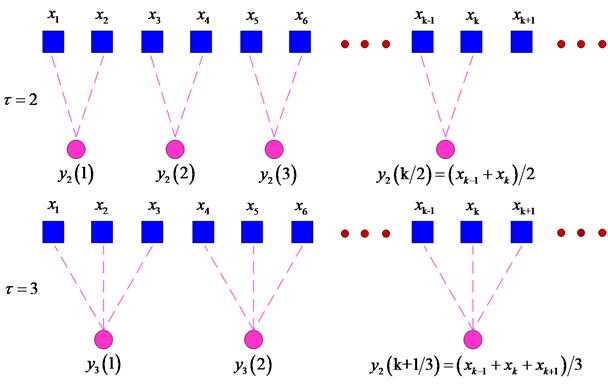
Fig. 4Flowchart of the proposed algorithm.
4. Application
In order to validate the superiorities of the proposed method, we conduct the analysis on a transmission gearbox. The experiment platform of gearbox is shown in Fig. 5. Two High Sensitivity Quartz ICP accelerometers are located on the base of floor stand. The speed of the motor is 1500 rpm, while the sample frequency is 10000 Hz and sampling time is 1 s. The parameters of gearbox are in Table.1. In this experiment, there are four working conditions: normal, slight wearing, severe wearing and missing tooth. The fault severities of gearbox are shown in Fig. 6.
Fig. 5The experiment platform of gearbox
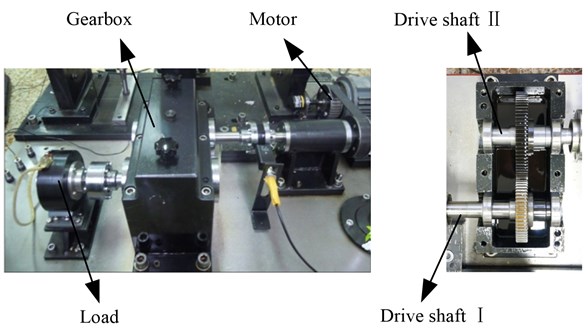
Fig. 6The fault severities of gears
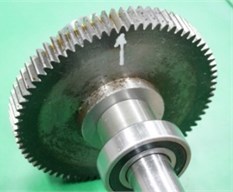
a) Slight wearing
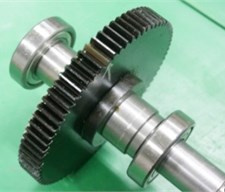
b) Severe wearing
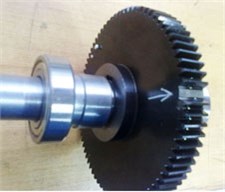
c) Missing tooth
Table 1Working parameters of the gears
Gear | Number of teeth | Rotating frequency (Hz) | Meshing frequency (Hz) |
Driving gear | 55 | 25 | 1375 |
Driven gear | 75 | 18.33 | 1375 |
The vibration signals in the experiment are divided into several non-overlapping segments with the length of 1000. There are 40 samples for each gear condition, so there are total 160 samples, in which 80 samples will be randomly selected as the training data and the residual 80 samples will be as the testing data. The detailed numbers of samples description for each gear condition are shown in Table 2.
Table 2The detailed description of numbers of the experimental data sets
Fault class | Fault diameter (mm) | Number of training data | Number of test data | Class label |
Normal | 0 | 20 | 20 | 1 |
Slight wearing tooth | 0.1 | 20 | 20 | 2 |
Severe wearing tooth | 0.5 | 20 | 20 | 3 |
The missing tooth | 0 | 20 | 20 | 4 |
Fig. 7. gives the time domain vibration signals of gearbox in four working cases respectively, and then the ICD method is adopted to decompose the vibration signals into a sum of PCs. Figs. 8 11 gives the decomposition results of gearbox under four working conditions. Since the PCs with different oscillatory modes are listed from high frequency to low frequency and the fault information is mainly embedded in the high frequency, only the first product component is selected for further analysis in Figs. 8-11.
According to the steps in Section 3.2, after ICD method is used to get the PCs, multi-scale entropy of each first PC can be derived. The value range of scale factor is set 1 to 12 and the MSE of each coarse grained time series is calculated with 2 and , where denotes the standard deviation (SD) of the original time series and . The whole flowchart of the proposed feature extraction technique is shown in Fig. 12.
Fig. 7The vibration signals of gearbox in four conditions
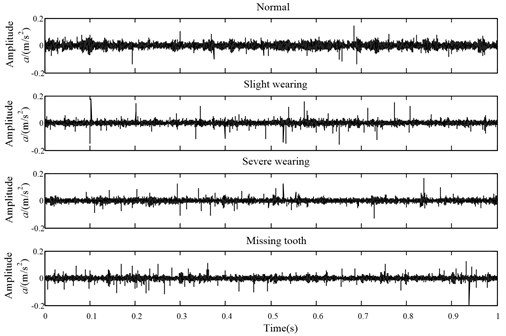
Fig. 8The decomposition results of the normal vibration signal using ICDn
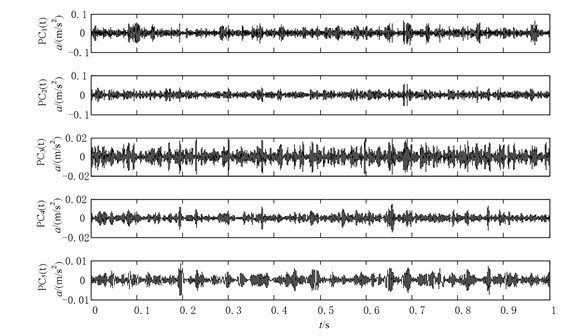
Fig. 9The decomposition results of the slight wearing vibration signal using ICD
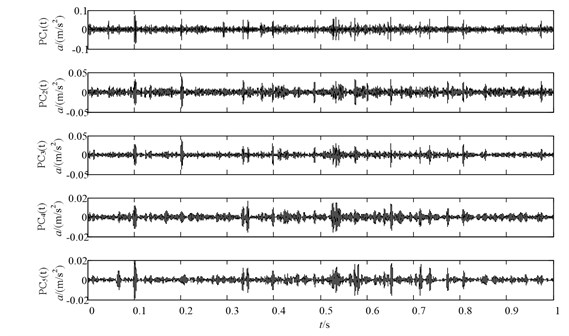
Fig. 10The decomposition results of the severe wearing vibration signal using ICD
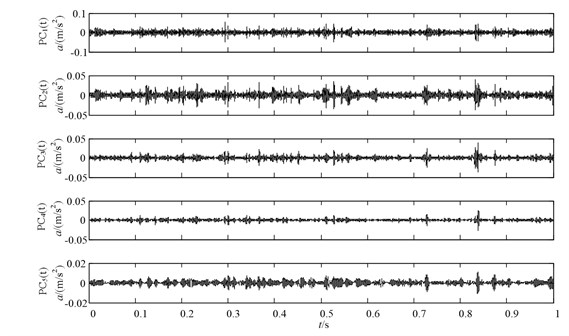
Fig. 11The decomposition results of the missing tooth vibration signal using ICD
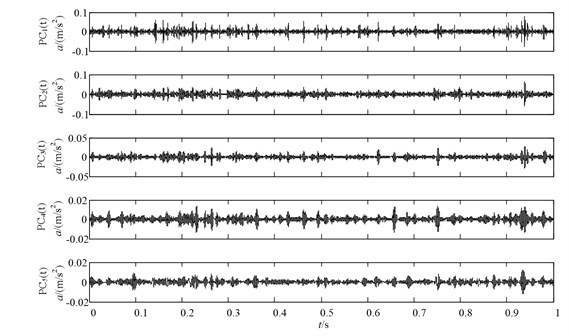
Fig. 12The flowchart of this feature extraction method
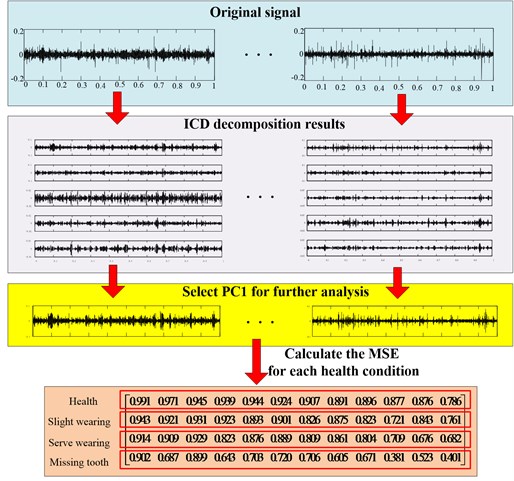
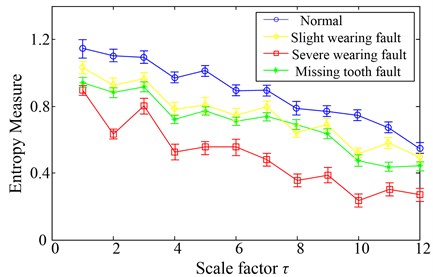
Fig. 13 gives the MSE curves of under four different working conditions. Referring to the Fig. 13, it can be seen that it is easy to identify four working conditions from the multi-scale entropy curves of . The main reason is that contains the highest frequency of the original signal and the feature of can reflect the feature of the original signal. Therefore, can be chosen to recognize different working states of gear.
Fig. 13MSE over 12 scales of the PC1 component obtained by ICD method
To test the ability of the proposed technique in the real applications, 160 vibration signal samples are selected from four conditions (normal condition, slight wearing condition, medium wearing condition and severe wearing condition), and then the average and (three times standard deviation) of eigenvalues are added. The MSE values of the first PCs in the four conditions are calculated in Table 3.
To verify the better divisibility of the proposed method, Euclidean distance which has the advantages of effectively calculating the distance between two conditions is introduced. The bigger value is, the better divisibility between two conditions is [20]. For four conditions, after the Euclidean distance is calculated between any two conditions, the averaged Euclidean distances (AED) can be used to evaluate the divisibility of four conditions.
The multiscale sample entropy of the first PCs and the AED are calculated for the above mentioned vibration signal samples from four conditions, and then the results are also shown in Table 3. We can observe not only the distribution of eigenvalues for ICD-MSE is wider than that of ICD-SE and MSE, but also of eigenvalues for ICD-MSE is smaller than that of ICD-SE and MSE. The AED is bigger than two other methods, demonstrating that the proposed technique has the better divisibility of four conditions.
Table 3The results comparison among three feature extraction methods using AED
Feature extraction method | Normal condition | Slight wearing condition | Medium wearing condition | Severe wearing condition | AED |
ICD and MSE | 0.9012±0.017 | 0.8247±0.043 | 0.6012±0.013 | 0.4458±0.025 | 0.2605±0.040 |
ICD and SE | 0.9089±0.032 | 0.9012±0.017 | 0.8052±0.057 | 0.6408±0.054 | 0.1500±0.048 |
MSE | 0.9241±0.058 | 0.8945±0.047 | 0.8542±0.057 | 0.8025±0.043 | 0.0675±0.052 |
Take the extracted multiscale entropy vectors as the inputs of the chosen classifier-support vector machine (SVM). As mentioned above, 80 groups of data are selected randomly as training set to train the SVM-classifier and the remaining 80 groups of data are taken as testing set to test the trained SVM-classifier. Hence, the testing set are fed into the trained model to achieve the fault identification, and the output testing results are shown in Table 4. It can be found no samples of the four fault types are misclassified, and the training accuracy and testing accuracy are both 100 %, which demonstrate the effectiveness of the proposed method in the gear fault diagnosis.
Table 4The classification results of the SVM-classifier using MSE
Fault class | Class label | The number of training samples | The number of misclassified samples | The number of testing samples | The number of misclassified samples | Training accuracies/testing accuracies (%) |
Normal | 1 | 20 | 0 | 20 | 0 | 100/100 |
Slight wearing | 2 | 20 | 0 | 20 | 0 | 100/100 |
Severe wearing | 3 | 20 | 0 | 20 | 0 | 100/100 |
Missing tooth | 4 | 20 | 0 | 20 | 0 | 100/100 |
In total | 80 | 0 | 80 | 0 | 100/100 |
In order to compare the recognition ability of the proposed method, the three other feature extraction methods are applied to extract fault features of measured vibration signal, which are LMD and MSE method, ICD and SampEn method, directly MSE method. Subsequently, the obtained features are fed into the SVM. The training data and testing data are the same as above. The obtained reorganization accuracy of the methods is listed in Table 5. Observing from the comparison results, it is easy to find that the proposed method not only has highest accuracy of each health condition but also has highest accuracy of total accuracy among others. This can be explained in this way. Firstly, ICD can avoid the mixing problem of LMD, which can obtain the more accuracy decomposition results. Hence, the proposed method outperforms the combination of LMD and MSE. Secondly, MSE can give detailed measure of complexity over a range of scales, which gives us more accuracy information compared with sample entropy, therefore, it outperforms the combination for ICD with sample entropy. Lastly, the fault information decomposed using ICD can remove the noises of measured signal effectively, but directly applying MSE cannot extract enough fault features with physical meanings, resulting in lower recognition accuracy. Therefore, the proposed method outperforms three other methods.
Table 5The recognition accuracy comparison between different methods
Feature extraction method | Accuracy of each fault class (%) | Total accuracy (%) | |||
Normal | Slight | Medium | Severe | ||
The proposed method | 100 % | 100 % | 100 % | 100 % | 100 % |
LMD and MSE | 97.5 % | 95.0 % | 100 % | 100 % | 98.13 % |
ICD and SampEn | 90.0 | 92.5 % | 95 % | 95 % | 93.13 % |
MSE | 87.5 % | 77.5 % | 85.0 % | 80.0 % | 82.5 % |
5. Conclusions
This paper presents a feature extraction method based on ICD and MSE for gearbox. Considering the multi-component and non-stationary signals of gearbox, ICD is employed to decompose signals into a set of PCs, and then MSE is used to extract the feature vectors. Through calculating the multi-scale entropies of the PCs and taking them as the input vectors of SVM, the fault types are identified accurately. The successful applications to gearbox fault diagnosis demonstrate that the proposed method is suitable. The advantage of the proposed technique is verified by comparing the results extracted by three other methods.
References
-
Lee S. K., White P. R. Higher-order time-frequency analysis and its application to fault detection in rotating machinery. Mechanical Systems and Signal Processing, Vol. 11, Issue 4, 1997, p. 637-650.
-
Bordoloi D. J., Tiwari R. Optimum multi-fault classification of gears with integration of evolutionary and SVM algorithms. Mechanism and Machine Theory, Vol. 73, 2014, p. 49-60.
-
He Q., Liu Y., Kong F. Machine fault signature analysis by midpoint-based empirical mode decomposition. Measurement Science and Technology, Vol. 22, Issue 1, 2011, p. 015702.
-
Olhede S., Walden A. T. The Hilbert spectrum via wavelet projections. Proceedings of the Royal Society of London: Mathematical, Physical and Engineering Sciences. The Royal Society, Vol. 460, Issue 2044, 2004, p. 955-975.
-
Li Y., Xu M., Wei Y., et al. An improvement EMD method based on the optimized rational Hermite interpolation approach and its application to gear fault diagnosis. Measurement, Vol. 63, 2015, p. 330-345.
-
Huang N. E., Shen Z., Long S. R., et al. The empirical mode decomposition and the Hilbert spectrum for nonlinear and non-stationary time series analysis. Proceedings of the Royal Society of London: Mathematical, Physical and Engineering Sciences, The Royal Society, Vol. 454, Issue 1971, 1998, p. 903-995.
-
Huang N. E., Wu Z. A review on Hilbert-Huang transform: method and its applications to geophysical studies. Reviews of Geophysics, Vol. 46, Issue 2, 2008, p. 000228.
-
Rilling G., Flandrin P., Goncalves P. On empirical mode decomposition and its algorithm. IEEE EURASIP Workshop on Nonlinear Signal and Image Processing, Vol. 3, 2003, p. 8-11.
-
Cheng J., Zhang K., Yang Y. An order tracking technique for the gear fault diagnosis using local mean decomposition method. Mechanism and Machine Theory, Vol. 55, 2012, p. 67-76.
-
Wang Y., He Z., Xiang J., et al. Application of local mean decomposition to the surveillance and diagnostics of low-speed helical gearbox. Mechanism and Machine Theory, Vol. 47, 2012, p. 62-73.
-
Smith J. S. The local mean decomposition and its application to EEG perception data. Journal of the Royal Society Interface, Vol. 2, Issue 5, 2005, p. 443-454.
-
Frei M. G., Osorio I. Intrinsic time-scale decomposition: time-frequency-energy analysis and real-time filtering of non-stationary signals. Proceedings of the Royal Society of London: Mathematical, Physical and Engineering Sciences, The Royal Society, Vol. 463, Issue 2078, 2007, p. 321-342.
-
Li Y., Xu M., Wei Y., et al. Rotating machine fault diagnosis based on intrinsic characteristic-scale decomposition. Mechanism and Machine Theory, Vol. 94, 2015, p. 9-27.
-
Richman J. S., Moorman J. R. Physiological time-series analysis using approximate entropy and sample entropy. American Journal of Physiology-Heart and Circulatory Physiology, Vol. 278, 2000, p. 2039-2049.
-
Costa M., Goldberger A., Peng C. Multi-scale entropy analysis of biological systems. Physical Review Letters, Vol. 71, 2005, p. 1-18.
-
Costa M., Goldberger A., Peng C. Multiscale entropy analysis of complex physiologic time series. Physical Review Letters, Vol. 89, Issue 6, 2002, p. 68102.
-
Pan Y. H., Wang C., Lin W. Y., et al. Online condition-based shaft faults diagnosis with multiscale entropy. Proceedings of the Institution of Mechanical Engineers, Part B: Journal of Engineering Manufacture, Vol. 225, 2011, p. 1899-1911.
-
Kopsinis Y., McLaughlin S. Investigation and performance enhancement of the empirical mode decomposition method based on a heuristic search optimization approach. IEEE Signal Process, Vol. 56, Issue 1, 2008, p. 22-37.
-
Zhang L., Xiong G., Liu H., et al. Bearing fault diagnosis using multi-scale entropy and adaptive neuro-fuzzy inference. Expert Systems with Applications, Vol. 37, Issue 8, 2010, p. 6077-6085.
-
Zhao H., Wang J., Xing J., et al. A feature extraction method based on LMD and MSE and its application for fault diagnosis of reciprocating compressor. Journal of Vibroengineering, Vol. 17, Issue 7, 2015, p. 3515-3526.
Cited by
About this article

The research is supported by National Natural Science Foundation of China (No. 11172078) and Important National Basic Research Program of China (973 Program-2012CB720003), and the authors are grateful to all the reviewers and the editor for their valuable comments.
