Abstract
This paper studies the rolling bearing of the train and it puts forward a method of predicting the residual useful life (RUL) of the train’s rolling bearing using the proportional hazard model (PHM). First, the problem of RUL predictions for the train’s rolling bearing is described. Secondly, PHM is introduced, including the basic form, sample data, parameter estimation and prediction. Then, the method of RUL predictions using PHM is put forward. Finally, PHM has been validated by the total life data of the train’s rolling bearing.
1. Introduction
According to statistics, 30 % of the rotating machinery broken is caused by rolling bearing fault [1]. Only when we predict the rolling bear RUL accurate, know the current state and the remaining life of it, can we make reasonably custom performance testing and maintenance plan.
In 2006, Qiu H. and Lee J. [2] found that the change of root mean square (RMS) can reflect the degree of the bearing wear better, through the study of the relationship between bearing wear signal of RMS and time. In 2011, Du S. [3] obtained better results through predicting the rolling bearing life trend by extracting 17 hours’ time-domain feature information about the rolling bearing vibration.
The reliability of rolling bearing in China is mostly concentrated on the prediction of the remaining life and the fault diagnosis. Such as taking the kurtosis as recession performance index, establishing a prediction model of rolling bearing residual life based on support vector machine (SVM) [4]; selecting the decline performance index using self-organizing map neural network method to predict the remaining life of ball bearing with BP neural network [5].
This paper constructs a model of predicting the rolling bearing residual life using proportional hazard model (PHM) by combining running index and reliability model, which is commonly used in medical science.
2. Description of RUL prediction introduction
2.1. Recession model of rolling bearing
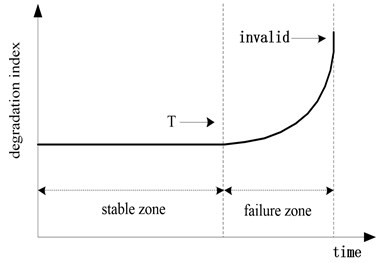
The rolling bearing failure condition can be represented schematically as shown in Fig. 1. The degradation index of the system changes rapidly in the failure zone, and then the system approaches failure. In the ‘stable zone’, the rolling bearing is functioning correctly. When the condition measurements start to deviate significantly from these values, and it can be said that the rolling bearing has entered the ‘failure zone’.
2.2. Basic form of PHM
PHM is a statistical data analysis tool, which is based on statistical regression, and it is mainly used in the RUL prediction and maintenance scheduling [6].
PHM can analysis the reliability and the RUL of the equipment effectively, because it not only considers the life information and the status of the equipment, but also taking the reliability data and status monitoring data into account.
Fig. 1Typical recession mode of rolling bearing
The function of PHM with time-varying covariates is showed below [7]:
The exponential distribution and Weibull distribution are the common failure rate functions [8]. The Weibull distribution can reflect that the failure rate changes with the time changing, and the RUL of rolling bearing obeys the 2-parameter Weibull distributions.
Eq. (2) shows as the shape parameter and as the scale parameter. Combining Eq. (2) with Eq. (1) as follows:
Eq. (3) is the basic form of PHM to predict the RUL of the train's rolling bearing.
2.3. Recession model of rolling bearing
The RUL is a conditional random variable, which is to predict the life from the current moment until the failure time. Let denotes the time to failure, denotes the current age and is the past condition profile up to the current time, so the RUL function is [9]:
The relationship between the bearing life and the monitoring index is different because the status of the bearing is different in the two zones.
3. Description of RUL prediction introduction
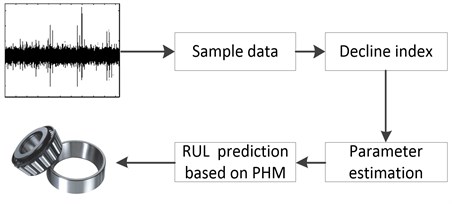
RUL prediction for train’s rolling bearing is a key link for state based maintenance. When predicting the RUL of the train's rolling bearing based on PHM, the failure probability of rolling bearing can be affected by its current state. So only combine the failure probability with monitoring state, the RUL prediction of train’s rolling bearing is accurate. The progress for RUL prediction of train's rolling bearing is shown in Fig. 2.
Fig. 2Typical recession mode of rolling bearing
3.1. Sample data of PHM
The following date are needed when to predict the RUL using the PHM:
(1) Time from the beginning of the operation to the equipment failure;
(2) The covariate vector devices from the operation start to failure;
(3) Event indicative variable , 0 indicates that the device is in normal operation and the data is censored data, 0 indicates the device is failure and the data is the failure time data.
Sample data for PHM parameter estimation:
In Eq. (5), () is the th sample, is the th sample failure time, is the number of the sample number, is the th sample covariate vector and is the th sample indicative variables.
3.2. Selection of recession performance index sample
The key to the RUL prediction of the train's rolling bearing is the selection of recession performance index. The root mean square (RMS) value and kurtosis index are closely related with the degradation state of bearing, and used the most widely. So the RMS value and kurtosis index are selected as the decline index in the performance of rolling bearing.
Kurtosis is a reflection of numerical statistic distribution characteristics of vibration signal, is normalized by the 4 order central moment:
where is the instantaneous amplitude, is the amplitude mean value, is the probability density, is the standard deviation.
For a set of discrete vibration signal data, the kurtosis coefficient is :
where is the signal value, is the mean value of the signal, is the sampling length, is the standard deriviation.
3.3. Parameter estimation of PHM
When the sample data of the equipment is large, The PHM is usually used to predict the RUL of the equipment. The Least square estimation and maximum likelihood estimation are common method for estimating the loss of efficiency in the model. Because of the good statistical properties and approximate distribution characteristics [10], the maximum likelihood estimation method is used to obtain estimated value of the model parameters.
In the model, let the data of the sample is , and the likelihood function is defined as:
In Eq. (8), the failure time of the sample , is the event indicating function of sample , is the failure rate function of sample , is the reliability function of sample . Calculation equation is:
Taking natural logarithm of Eq. (9) is:
Combining the loss efficiency function with Eq. (8) as follows:
Combining the sample data with Eq. (11), the value of three parameters can be obtained by the maximum likelihood estimation method [11].
3.4. Prediction for RUL
After calculating the value of , , and giving the state characteristic at the current equipment time , the reliability at time can be estimated as:
The RUL prediction expression at time using Eq. (12) is:
The state characteristic is needed when predicting the RUL at time . Combining the with Eq. (13), the RUL can be calculated out.
4. Case analysis
In this paper, the full life prediction of the train rolling bearing is based on the rolling bearing destructive testing in a rail transport test chamber. The test was 100 days long, and finally, 400 data are extracted as samples.
The RMS and kurtosis index are selected as the decline index in the performance of rolling bearing.
In order to obtain the four parameters value of the residual life prediction model for the rolling bearing, put the 400 known sample data into the likelihood function equation and use the MATLAB toolbox. When the optimization is more than 1500 generations, the precision range will be less than 10-6. The genetic algorithm is solved until the value of the fitness function is not changed. The four parameter values are shown in Table 1.
Fig. 3Dynamic surface attitude angle response curve
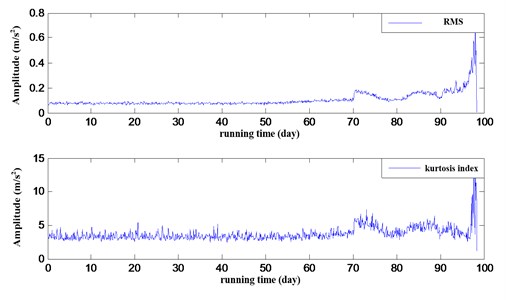
Table 1Basic size and style requirements
Parameter | ||||
Estimated value | 1.043 | 115.7 | 1.731 | 0.152 |
In order to verify the accuracy of PHM model for bearing life prediction, using the four parameters in the Eq. (11) of RUL prediction of train rolling bearing. The residual life of the train rolling bearing is calculated by selecting the parameter values of the 20 sample points in the vibration of the train bearing. The remaining life of the sample point is shown in Fig. 4.
Fig. 4RMS value and kurtosis index for train’s rolling bearing
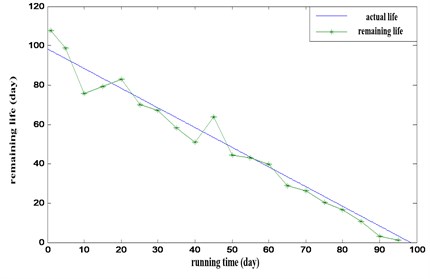
According to Fig. 4, we can find that the division between the prediction of RUL and its real RUL at the early time is big until the 70rd day. From the 70rd day later, life expectancy is close to the target output. In order to describe the prediction of remaining life more accurately, a list of prediction of RUL from the 70rd day later is analyzed.
As can be seen from Table 2, 70 days later, the life expectancy value is less than the actual remaining life, where the average error is –2.50. So the life prediction of the train rolling bearing based on PHM model meets the needs of the field maintenance.
Table 2Basic size and style requirements
Time | 70 | 75 | 80 | 85 | 90 | 95 |
RUL | 28.43 | 23.43 | 18.43 | 13.43 | 8.43 | 3.43 |
RUL by PHM | 26.19 | 20.30 | 16.65 | 10.79 | 5.37 | 1.30 |
Error | –2.24 | –3.13 | –1.78 | –2.64 | –3.06 | –2.13 |
5. Conclusions
In this paper, the residual useful life prediction model of rolling bearing based on PHM, combined with the rolling bearing testing state, the remaining life prediction of the train rolling bearing is realized. In this RUL prediction model, the RMS and kurtosis index are selected as rolling bearing performance degradation index. The life prediction of rolling bearing is carried out with the sample data.
The results of the analysis show that the prediction results are conservative and meet the needs of the maintenance of the site.
References
-
Zhang Bangji, Yu Dejie, Yang Sheng Roller bearing fault diagnosis approach based on wavelet transform and rough set theory. China Mechanical Engineering, Vol. 15, 2009, p. 1793-1831.
-
Qiu H., Lee J., Lin J., et al. Wavelet filter-based weak signature detection method and its application on rolling element bearing prognostics. Journal of Sound and Vibration, Vol. 289, Issue 4, 2006, p. 1066-1090.
-
Du S., Lv J., Xi L. Degradation process prediction for rotational machinery based on hybrid intelligent model. Robotics and Computer-Integrated Manufacturing, Vol. 28, Issue 2, 2012, p. 190-207.
-
Zhao F., Chen J., Xu W. Condition prediction based on wavelet packet transform and least squares support vector machine methods. Proceedings of the Institution of Mechanical Engineers, Part E: Journal of Mechanical Engineering, Vol. 223, Issue 1, 2009, p. 71-79.
-
Xi Lifeng, Huang Runqing, Li Xinglin, et al. Residual life predictions for ball bearing based on neural networks. Journal of Mechanical Engineering, Vol. 10, 2007, p. 137-143.
-
Wiley Cox D. Regression models and life tables (with discussion). Journal of the Royal Statistical Society: Series B, Vol. 34, 1972, p. 187-220.
-
Mendes A. C., Fard N. Reliability modeling for appliances using the proportional hazard model. Reliability and Maintainability Symposium, Proceedings – Annual, F, Vol. 32, Issue 4, 2013, p. 28-31.
-
Zhu Dexin, Liu Hongzhao Reliability evaluation of high-speed train bearing with minimums sample. Journal of Central South University (Science and Technology), Vol. 3, 2013, p. 963-969.
-
Heng A., Zhang S., Tan A. C., et al. Rotating machinery prognostics: state of the art, challenges and opportunities. Mechanical Systems and Signal Processing, Vol. 23, Issue 3, 2009, p. 724-739.
-
Meeker W. Q., Escobar L. A. Statistical Methods for Reliability Data. John Wiley and Sons, New York, 2014.
-
Lagarias J. C., Reeds J. A., Wright M. H., et al. Convergence properties of the Nelder-Mead simplex method in low dimensions. SIAM Journal on Optimization, Vol. 9, Issue 1, 1998, p. 1121-1147.
About this article

This research was supported by the National Key Research and Development Plan of China (2016YFB1200402), the Science and Technology Program of Guangzhou (201508010010) and the Fundamental Research Funds for the Central Universities (AE89454).
