Abstract
Aiming at the problem of rolling bearing fault diagnosis, a fault diagnosis method of rolling bearing is proposed based on analytical mode decomposition (AMD) and LabVIEW. For the fault feature frequency of rolling bearing is predictable, the AMD method can be used to extract the signal in the frequency band of fault characteristic frequency in rolling bearing signal, and seek frequency spectrum of vibration signal. If the spectrum contains fault characteristic frequency, then the rolling bearing fault can be diagnosed by vibration signal. A rolling bearing fault diagnosis system is developed based on LabVIEW and AMD, and the application of AMD algorithm is realized. The validity of the method is proved by the analysis of actual fault signal of rolling bearing.
1. Introduction
Rolling bearing is one of the most commonly parts of machinery and equipment, which plays a very important role in industrial production. Whether the working status of rolling bearing is normal or not, which affects directly the performance of the whole mechanical equipment. The rolling bearing fault will cause the device to produce abnormal vibration, and even cause equipment damage. So the study of fault features of rolling bearings is great significance to protect the safe operation of machinery equipment and to avoid the occurrence of accidents [1-5].
Analytical modal decomposition (AMD) method is a new signal decomposition method proposed by Chen et al. [6]. The method can separate the signals of different frequency components from the signals, but the premise is need to determine the respective frequency components of the signal, and then determine the Two-Partitioning Frequency value to conduct AMD decomposition. The effect of temperature on the bridge was separated by using AMD in [7], and the Two-Partitioning Frequency was determined by analyzing the energy distribution. For the rolling bearings, the fault characteristic frequency of different parts can be calculated, so AMD method can be used to deal with the bearing vibration signal to determine whether it contains fault frequency components.
In this paper, the analytical mode decomposition method is applied to fault diagnosis of rolling bearings. The signal of frequency band is separated by AMD method and the spectrum is obtained. A rolling bearing fault diagnosis system is developed based on LabVIEW and AMD, and the feasibility of method is proved by an example.
2. Analytical modal decomposition method
Chen and Wang proposed a new signal decomposition method, known as the analytical modal decomposition method [6]. The method can decompose a signal containing different frequency components into a single component signal. In particular, the signal can be decomposed into a signal with a close spaced frequency component. If a time series is divided into two frequency signals by , which is shown as:
Its Fourier transforms are and , the frequency ranges are and , and the sum of and is , then we can obtain:
So, and both are the real function of .
Let , . And makes the Hilbert transform shown as:
According to the Bedrosian theorem, the Eq. (4) can be rewritten:
When is equal to and respectively, can be solved:
The Hilbert transform of and can be expressed as:
So:
The Eq. (6) and Eq. (7) can be rewritten:
Obtained by Eq. (1):
Thus the signal gets two signals and by the AMD decomposition.
3. Fault diagnosis method of rolling bearing based on AMD
3.1. AMD signal extraction algorithm
Feldman further explained the decomposition method which can be used as a low pass filter [7]. Because the AMD method can decompose a time series into any two signals, so AMD decomposition method can not only realize function of low-pass filter, but can extract any frequency components of signal, however need to know the frequency components of original signal.
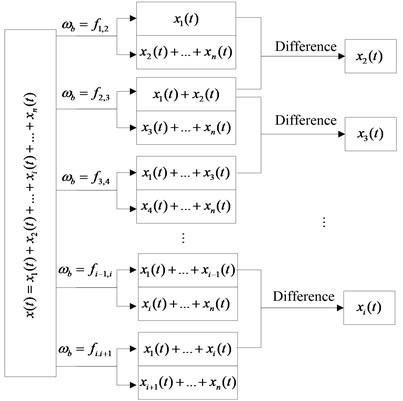
Suppose there is a time sequence . The frequency of is respectively and. When the frequency components of signal is extracted, just take the value between and as the Two-Partitioning frequency decomposition; if the frequency components of the signal is extracted, we can take the value between and as the first half of the Two-Partitioning frequency decomposition and then subtract the value between and as the first half of the Two-Partitioning Frequency decomposition; if the frequency components of the signal is extracted, we can take the value between and as the first half of the Two-Partitioning frequency decomposition and then subtract the value between and as the first half of the Two-Partitioning frequency decomposition; if the frequency components of the signal is extracted, we only need to take the value between and as the Two-Partitioning frequency decomposition. Its schematic diagram is shown in Fig. 1.
Fig. 1AMD extracting signal principle diagram
3.2. Rolling bearing fault diagnosis method
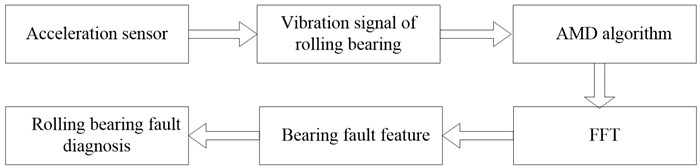
For rolling bearing, the fault characteristic frequency can be predicted, and a fault diagnosis method of rolling bearing is proposed based on AMD. The method includes the following steps:
(1) The rolling bearing is measured by the acceleration sensor, and the vibration signal of the bearing is collected;
(2) The collected rolling bearing vibration signal is imported into the computer, and the original signal of the rolling bearing is obtained;
(3) The original bearing signal is decomposed by AMD, and the signal in frequency band of each fault feature is extracted;
(4) The various components of AMD decomposition are conducted by Fourier transform, and the spectrum of component signal is obtained;
(5) According to the spectrum component, the fault characteristic frequency and the location of the fault is distinguished, and fault feature extraction of rolling bearing is realized.
The flow chart of the method is shown in Fig. 2.
4. Fault diagnosis system based on AMD and LabVIEW
LabVIEW has been widely used in many fields as a virtual instrument development environment. In this paper, the AMD algorithm is embedded into LabVIEW to realize fault diagnosis of rolling bearing. The rolling bearing fault diagnosis system is composed of four modules, which are real-time domain analysis module, frequency spectrum analysis module, AMD module and characteristic frequency calculation and fault identification module. The software version of the program used is LabVIEW2012 in this paper.
Fig. 2Flow chart of AMD fault diagnosis
4.1. Time domain analysis module
The time domain analysis module includes three parts mainly, which are the time domain waveform display, the time domain parameter index measurement and the determination and non-dimensional parameter statistics. The front panel of the program is shown in Fig. 3.
The module can make offline data import program, at this point, the sampling frequency and data length of the off-line data are needed to be input into the program so as to be able to calculate the parameters in the time domain. The waveform displays of input data, parameters calculation and alarm settings are realized. The software analysis of time domain statistical indexes includes two categories, they are dimensional indicators (such as variance, standard deviation, root mean square value, average value, maximum values, etc.) and dimensionless parameters (such as peak indicators, waveform index, margin index and pulse index). And judge the running state of the rolling bearing by setting a threshold value for each indicator, in order to achieve fault early warning.
Fig. 3Time domain analysis module front panel
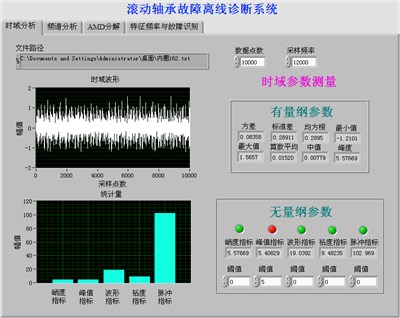
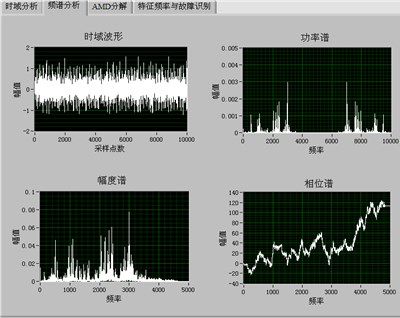
Fig. 4Spectrum analysis module front panel
4.2. Spectrum analysis module
In the front panel of spectrum analysis contains the amplitude spectrum, phase spectrum and power spectrum. The spectrum analysis interface is shown in Fig. 4. Phase spectrum is the curve of signal phase frequency response of the phase, which represents the phase of each frequency component in the time origin. Amplitude spectrum is the curve of the signal amplitude versus frequency, which represents the amplitude of each frequency component in the time origin. The amplitude spectrum of the signal is the same as the phase spectrum of the signal. It is the important characteristic of signal. Amplitude spectrum and phase spectrum VI calculate real time-domain signal and unilateral scaled amplitude spectrum, and return the amplitude spectrum by the amplitude and phase.
4.3. AMD decomposition module
Front panel of AMD decomposition module of this off-line diagnosis system is shown in Fig. 5. In the module, filling in the sampling frequency of off-line data and sampling points, and conducting the data signal with AMD decomposition by setting the value of Two-Partitioning Frequency 1 and 2, which can extract arbitrary frequency signal, and display the value of frequency components of decomposition.
4.4. Characteristic frequency and fault identification module
The front panel of the characteristic frequency and fault identification module is shown in Fig. 6, the module calculates the fault characteristic frequency of bearing parts, and the frequency and the theoretical value of the required signal components are obtained to judge whether the bearing is in fault and the type of the fault, through rolling bearing parameter settings for different types mainly.
Fig. 5AMD decomposition module front panel
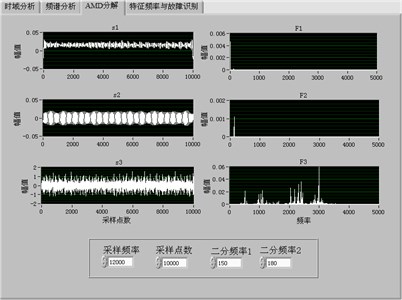
Fig. 6fault identification module
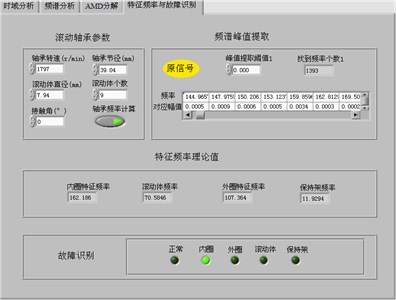
Taking the experimental data of the Western Reserve University as an example [8], the drive end bearing model is SKF6205, the bearing speed is 1797 r/min (29.95 Hz), and the sampling frequency is 12 kHz. The diameter of the bearing is 39.04 mm, the diameter of the rolling element is 7.94 mm, the number of the rolling elements is 9, and the contact angle is 0 degrees. By calculating the holder fault frequency at 12 Hz, outer race fault frequency is 107 Hz, inner race fault frequency 162 Hz, rolling body fault 141 Hz, the effectiveness of the developed system is demonstrated through the actual rolling bearing fault signal.
5. Conclusions
1) A fault diagnosis method of rolling bearing is proposed based on AMD. Due to the rolling bearing fault frequencies is predictable, Therefore, the AMD method can be used to extract the signal of the fault frequency band and to seek its frequency spectrum, to judge the extracted signal whether there is fault frequency and whether there is fault and fault location.
2) A rolling bearing fault diagnosis system is developed based on AMD and LabVIEW, and the analysis and processing of the bearing data are realized. By analyzing the vibration signal of rolling bearing fault, it is proved that the method can extract the fault characteristic frequency of vibration signal, which can be used to realize the fault diagnosis of rolling bearing.
References
-
Liu H., Han M. A fault diagnosis method based on local mean decomposition and multi-scale entropy for roller bearings. Mechanism and Machine Theory, Vol. 75, Issue 5, 2014, p. 67-78.
-
Shi P., Ding X., Han D. Study on multi-frequency weak signal detection method based on stochastic resonance tuning by multi-scale noise. Measurement, Vol. 47, Issue 1, 2014, p. 540-546.
-
Chen G., Wang Z. A signal decomposition theorem with Hilbert transform and its application to narrowband time series with closely spaced frequency components. Mechanical Systems and Signal Processing, Vol. 28, 2012, p. 258-279.
-
Han D., Li P., An S., Shi P. Multi-frequency weak signal detection based on wavelet transform and parameter compensation band-pass multi-stable stochastic resonance. Mechanical Systems and Signal Processing, Vol. 70-71, 2016, p. 995-1010.
-
Shi P., Su C., Han D. Fault diagnosis of rotating machinery based on adaptive stochastic resonance and AMD-EEMD. Shock and Vibration, 2016, p. 9278581.
-
Chen G., Wang Z. A signal decomposition theorem with Hilbert transform and its application to narrowband time series with closely spaced frequency components. Mechanical Systems and Signal Processing, Vol. 28, Issue 4, 2012, p. 258-279.
-
Feldman M. A signal decomposition or lowpass filtering with Hilbert transform. Mechanical Systems and Signal Processing, Vol. 25, Issue 8, 2011, p. 3205-3208.
-
http://csegroups.case.edu/bearingdatacenter/pages/12k-drive-end-bearing-faut-data
About this article

This work was supported by the National Natural Science Foundation of China (Grant No. 51475407), Hebei Provincial Natural Science Foundation of China (No. E2015203190), The Education Department of Hebei Province Outstanding Youth Fund (No. YQ2013020) and Key Project of Natural Science Research in Colleges and Universities of Hebei Province (Grant No. ZD2015050)
