Abstract
It is of significance to monitor the operating status of rolling bearings. In order to obtain degradation of bearing performance timely and predict its trend, this paper proposed a bearing health state assessment method based on Mahalanobis distance metric and a prediction method based on echo state network. By designing degradation experiment and applying the proposed method to analyze the data, the performance degradation curve of the bearing and its prediction curve were obtained, and the experimental results verified the effectiveness of the method.
1. Introduction
Rolling bearings are very common mechanical component part and key element of the mechanical equipment. The principal objective of a rolling bearing application is to support the load from rotating shaft and reduce friction between the rotor-stator. It plays an important role in a number of industrial applications [1]. When the rolling bearing has an initial failure, it is usually not necessary to stop the equipment for maintenance, but it is important to monitor its subsequent operating status. If the bearing is detected to be in a severe fault condition, the equipment needs to be shut down and the bearing replaced in time to prevent serious damage due to bearing failure. Therefore, exploring effective bearing performance degradation assessment methods can help reduce equipment downtime, and can avoid economic losses and catastrophic accidents caused by bearing failure [2].
Many researches have been done by scholars to study the problem of the rolling bearing’s degradation. In previous studies the authors have shown that SOM (Self-organizing Maps), GMM (Gaussian Mixture Model), etc., can identify the different working conditions of rolling bearings [3, 4]. Meanwhile, traditional ANN (Artificial Neutral Network), BP (Back Propagation) and Elman models have been widely used in the field of intelligent prediction of rotating machinery [5-7]. But some of the methods mentioned above are complex and time consuming, such as GMM, meanwhile, some are too simple to get approving results, like BP, etc.
Applying the signal characteristics of rolling bearing degradation, in this paper, an approach for rolling bearing health assessment and life prediction, MD (Mahalanobis Distance)-ESN (Echo State Network), was proposed. The MD is a statistical distance that provides an indication of similarity or nearness between two sets of samples. What’s more, the MD is independent of the scale, considering the relationship between the data, and the corresponding weights can be automatically generated by the covariance, and the inverse is used to offset the weights [8]. We employ ESN on time series vibration signals of rolling bearing, which overcomes the problem that traditional ANN is easy to fall into local extreme value. Elman neural network and BP neural network both have the strong abilities of knowledge acquisition and fault tolerance, however, there are phenomena called over-fitting often occurred on these two methods. In addition, the physical meaning of traditional ANN prediction model is difficult to explain, and its training process and time are long. The reasons above induct its poor generalization ability. Given the above, compared with these traditional artificial neural networks, ESN is improved in nonlinear system identification to an large extent [9].
This paper is organized as follows. In Section 2, the combinatorial method of MD and ESN are presented. In Section 3, the bearing test data are taken from the Bearing Prognostics Simulator (BPS) and the proposed method meets the demand of prediction accuracy, robustness and effectiveness. General conclusions are illustrated in Section 4.
2. Methodology
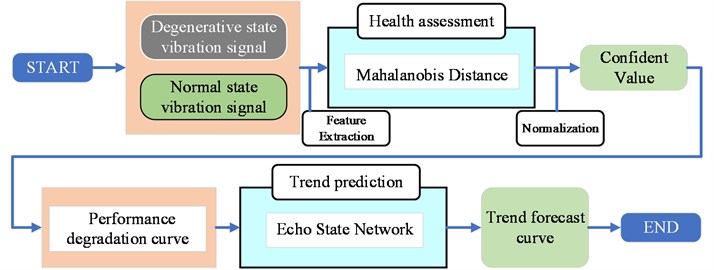
For vibration signals, the flow path of proposed method was shown in Fig. 1, and it can be divided into two parts.
Firstly, the vibration signal of the normal operation of the bearing and the vibration signal under the degraded state are obtained through the bearing degradation test. In order to construct a characteristic signal, the appropriate characteristics of the two vibration signals are extracted. Then Mahalanobis distance algorithm is employed to measure the distance of the two feature sequences. Finally, the obtained Mahalanobis distance is normalized to the confidence value, which means setting the CV value of the normal state to 1, and setting the state of unacceptable or repairable to 0. The normalized rule can be adjusted according to the actual situation.
After that, using the performance degradation curve obtained by health assessment to train the ESN, then get the prediction curve, which characterizes the health trend of the bearing in the period ahead.
Fig. 1The procedure of the proposed methodology
2.1. Health assessment by using MD
The Mahalanobis distance is calculated as follows:
(1) Calculate the average of each feature vector:
(2) Calculate the standard deviation of each feature vector:
(3) The feature vector is orthogonal to get , then transpose :
(4) Calculate the correlation matrix :
(5)The Mahalanobis distance is:
After getting the vibration signal by the sensor and extracting the feature, the characteristic points of the bearing under normal conditions are obtained. They are assumed to be , ), …, ). are applied to construct the Markov space on normal conditions as the basic standard of bearing health.
Assuming that the bearing is in operation, we acquire a residual sequence randomly and extract the features. The feature points are , , …, , …, . The distances , ,…, between the respective state points and the standard Markov space are sequentially calculated.
The greater the Markov distance is, the farther the current feature point is from the normal Markov space, which proves that the bearing performance degradation is more serious. The smaller the Markov distance is, the closer the current feature point is to the normal Markov space, which denotes that the bearing is healthier. In order to indicate the current health of the bearing more intuitively, the Mahalanobis distance is normalized to Confidence Value (CV), namely, the bearing health assessment result is represented by CV. The larger the CV value is, the better the bearing performance is. When the CV value is close to 1, the bearing is generally considered to be operating under a completely normal state. The smaller the CV value is, the more serious the bearing performance degradation is. If the CV value is close to 0, it is generally considered that the bearing has a relatively high degree of failure and cannot continue to work.
The normalized algorithm in this paper is as follows:
where is the normalized parameter, and is set to a different parameter value, then the sensitivity of the corresponding CV value to the fault trend of different fault stages will change, so that the evaluation model is adjusted according to the actual situation and needs.
After constructing the Markov space according to the data in the normal state of the bearing, the feature points in the state to be evaluated of the device are obtained. For each evaluation, only one calculation is needed to realize real-time evaluation, and finally the single evaluation result forms a CV value curve to describe the trend of deterioration of the bearing's health performance over a period of time.
2.2. Performance degradation trend prediction by using ESN
The ESN consists of three parts, which are respectively the input layer, the reserve pool, and the output layer. The input signal is connected to the reserve pool via the input connection weight matrix . There are many randomly distributed neurons in the reserve pool. The neuron nodes are interconnected via the internal connection weight matrix , and the network output feedback to the reserve pool via the feedback connection weight matrix , the internal state vector is composed of the output of the neuron, and is connected to the output layer via the output connection weight matrix . In the ESN, only one output connection right of needs to be trained, and the training process is very simple, only a linear regression problem needs to be solved.
In this paper, we assume that the ESN has input units, output units, and internal signal processing units. Then the input data unit , the output data unit , and the internal state variable at the time are:
The internal state update equation of the reserve pool is as follows:
3. Case study
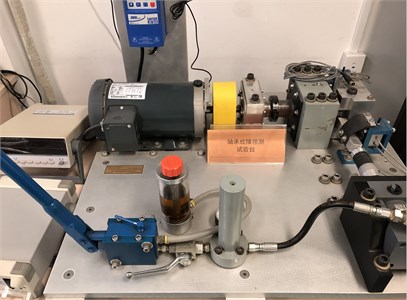
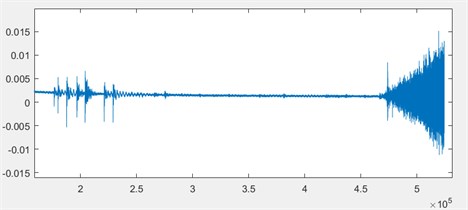
We employed the Bearing Prognostics Simulator of Beihang PHM Lab to conduct the test of bearing degradation, and the working condition was set to a constant speed of 2000 rpm. In addition, the test was set a constant load in order to shorten the time of bearing performance degradation. The vibration sensors were respectively attached to the vertical and horizontal directions of the bearing, and the sampling frequency was set to 10 KHz. As a consequence, the vibration data, which contained 520 K points each group (20 groups in total), were collected as data sources.
Fig. 2Bearing prognostics simulator and vibration signal diagram
a)
b)
In order to facilitate the data analysis, taking comprehensive account of the rotational speed and the sampling frequency, we made the data 500 points per group and extracted the eigenvalue time domain features to construct the eigenvectors of all the data. Using the non-degraded data as a normal reference, the calculated Mahalanobis distance was normalized to a CV value between 0-1. The health assessment results based on Mahalanobis distance were shown in Fig. 3.
Fig. 3Bearing performance degradation curve
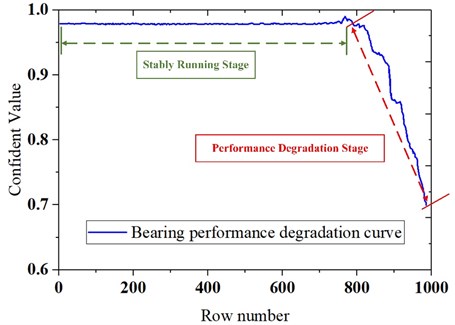
As shown in Fig. 3, the bearing maintains a value of about 0.97 in the stably running stage, and as the bearing performance deteriorated, the bearing structure damage accumulates, the health was reduced to about 0.7 in a short period of time. The results of the health assessment showed that the proposed method can accurately characterize the bearing performance degradation.
Fig. 4Bearing prognostics simulator and vibration signal diagram
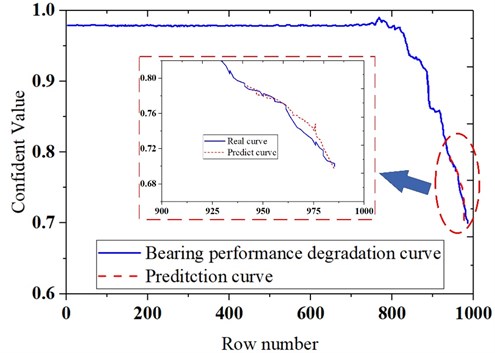
The decay section in the CV curve obtained by the health assessment was regarded as a training sample of the ESN network. In order to verify the accuracy of the prediction, the first 70 % of the performance degradation curve was employed as a training sample, then the predicted curve was compared with the actual curve, as shown in Fig. 4. The MAPE (Mean Absolute Percentage Error) between the actual value and the predicted value was calculated, and the obtained MAPE value was about 14 %, which showed that the method had favorable accuracy.
4. Conclusions
In this paper, the health status assessment and performance degradation trend research were carried out for the problem of bearing performance degradation. The health assessment method based on Mahalanobis distance and the performance degradation trend prediction method based on ESN were proposed, meanwhile, the experimental data were used to verify the effectiveness of the method. The results of case study indicated that the proposed method can accurately evaluate the health status of the bearing and predict the performance degradation state of the bearing.
References
-
Nikolaou N. G., Antoniadis I. A. Rolling element bearing fault diagnosis using wavelet packets. NDT and E International, Vol. 35, Issue 3, 2009, p. 197-205.
-
Rai V. K., Mohanty A. R. Bearing fault diagnosis using FFT of intrinsic mode functions in Hilbert-Huang transform. Mechanical Systems and Signal Processing, Vol. 21, Issue 6, 2007, p. 2607-2615.
-
Jämsä Jounela S.-L., Vermasvuori M., Endén P., et al. A process monitoring system based on the Kohonen self-organizing maps. Control Engineering Practice, Vol. 11, Issue 1, 2003, p. 83-92.
-
Mukherjee D., Wu Q. M. J., Nguyen T. M. Gaussian mixture model with advanced distance measure based on support weights and histogram of gradients for background suppression. IEEE Transactions on Industrial Informatics, Vol. 10, Issue 2, 2014, p. 1086-1096.
-
Ali B. S., Hasanien H. M., Galal Y. Speed control of switched reluctance motor using artificial neural network controller. International Conference on Control, Communication, and Power Engineering. 2011.
-
Huang R., Xi L., Li X., et al. Residual life predictions for ball bearings based on self-organizing map and back propagation neural network methods. Mechanical Systems and Signal Processing, Vol. 21, Issue 1, 2007, p. 193-207.
-
Wang J. Z., Wang J. J., Zhang Z. G., et al. Forecasting stock indices with back propagation neural network. Expert Systems with Applications, Vol. 38, Issue 11, 2011, p. 14346-14355.
-
Wang D., Yeung D. S., Tsang E. C. Weighted Mahalanobis distance kernels for support vector machines. IEEE Transactions on Neural Networks, Vol. 18, Issue 5, 2007, p. 1453-1462.
-
Li D., Min H., Wang J. Chaotic time series prediction based on a novel robust echo state network. IEEE Transactions on Neural Networks and Learning Systems, Vol. 23, Issue 5, 2012, p. 787-799.
About this article

This research was supported by the National Natural Science Foundation of China (Grant Nos. 51605014, 51105019 and 51575021), the Aviation Science Fund (Grant No. 20163351018), the Technology Foundation Program of National Defense (Grant No. Z132013B002), and the Fundamental Research Funds for the Central Universities (Grant No. YWF-18-BJ-Y-159).
