Abstract
The sound insulation performance of the dash panel has a direct influence on the level of sound absorption of the whole vehicle. Therefore, it is necessary to adopt proper optimization strategies to optimize the dash panel and interior sound pressure response. Firstly, damping loss factor was imported into the dash panel and the coupling model of interior acoustic cavity to compute the sound pressure response of the driver. Sound pressure response had multiple peak noises in the analyzed frequency band. With the increase of the analyzed frequency, Contours for the noise of interior acoustic cavity became increasingly dispersed. Secondly, reverberation chambers on both sides were coupled with the dash panel respectively to establish AML model. In this way, the computational transmission loss would be more consistent with the actual situation. AML method can directly obtain transmission loss without extracting the transmission sound power to compute transmission loss through relevant formulas. In reported papers, there are big differences between simulation and experiment in the low frequency because it is difficult to simulate the real boundary conditions. The computational results of this paper were more consistent with experimental results in the whole frequency band, which indicated that it was more effective to use AML method to compute the transmission loss of the dash panel. Then, a sound package was applied to the dash panel to conduct parametric analysis. Results showed that the thickness of the sound-absorption layer could effectively improve transmission loss over 250 Hz. When the thickness of the sound-absorption layer was 15 mm, transmission loss was relatively optimal. In addition, the thickness of the air layer had little influence on transmission loss. Finally, genetic algorithm was also used to optimize the parameters of sound package of the dash panel. Results showed that the optimized dash panel had a higher average transmission loss and total mass, and the average sound pressure response of the driver also decreased. Additionally, the transmission loss and sound pressure response of the driver optimized by genetic algorithm at each frequency point were improved in the analyzed frequency band to obtain a low-noise and lightweight dash panel.
1. Introduction
The interior noise of vehicles not only has an influence on the comfort of drivers and passengers, but also causes damage to auditory sense in the long term. With the development of society, people have higher requirements on the comfort of vehicles and various countries have also put forward more strict standards for the noise level of vehicles. Improving NVH performance of vehicles and reducing interior noises have become a hot research. Therefore, a large number of manufacturers and consumers pay attention to them. It is very important to propose the design proposal of noise reduction for vehicles at the design stage. Reasonably selecting, designing and optimizing the material and size of vehicle structure from the perspective of reducing the noise sources and avoiding structural resonance can improve the noise level of vehicles. The design of vibration isolation for inevitable vibration sources from the perspective of controlling the transmission path of noises can reduce interior noises by 3 dB to 8 dB. Regarding two directors which were the most intense noise in the vehicle, barriers were used for sound treatment. The gaps and hole of various control mechanisms in the vehicle were reduced as far as possible to improve the sealing of body. Experiments showed that interior noises were reduced by 5 dB to 10 dB after sealing treatment was conducted for holes of body.
The mentioned noise reduction measures were very effective to med-high frequency over 800 Hz. However, the structural noise which was from the dash panel was mainly in the low frequency below 500 Hz. Due to the limitation of body mass and space, the carpet was very difficult to block the noise in the low frequency. In this case, noises in the low frequency have gradually been a prominent problem which restricts the improvement of interior noises.
As one of main structures of body panel, the dash panel [1] mainly works as a carrier of accessories and pipelines and plays a role in sound insulation. The sound insulation of the dash panel directly affects the level of sound absorption of the whole sound package. Most of vehicles expect to improve the level of sound insulation through increasing the weight of the dash panel and improve the sound absorption by means of pasting materials [2, 3]. However, there are inevitable problems like leakage due to the hole of the dash panel and the limitation of accessory installation. These defects will greatly affect the sound insulation level of the dash panel. In particular, the sound insulation level of the dash panel in the high frequency will be affected more seriously.
Currently, there are many researches related to the dash panel, and they have reached many achievements. Duval [4] established the finite element model of the dash panel, computed transfer function and compared with experimental results. Results showed that they were consistent with each other. In addition, Duval further built the finite element model considering interior acoustic cavity and studied the vibro-acoustic characteristics of floor in the vehicle, but the model of interior acoustic cavity was inconsistent with the actual shape. Oliveira [5] used acoustic radiation modal to study the active control problem of the dash panel radiating noise in the vehicle. However, the applied excitation was force rather than reverberation noises, which was inconsistent with the actual situation. Marburg [6] established the model of acoustic cavity which was consistent with the actual shape of vehicles, studied the contribution of the dash panel to interior noises through transfer function and adopted optimization strategies to optimize noises. However, the researched process was not verified by experiments. The reliability of numerical computation model and optimization algorithm could not be guaranteed. Ding [7] used SEA method to compute the transmission loss of the magnesium alloy dash panel, compared with experiments and verified the effectiveness of computational results. However, he did not take into account the influence of coupling effect between dash panel and interior acoustic cavity on transmission loss. Zhang [8] also used SEA method to compute the transmission loss of the dash panel and took into account the coupling effect. However, he only took into account the transmission loss of the dash panel and was unable to compute the sound pressure response of the driver of interior acoustic cavity. In addition, only a layer of sound package structure was covered at the surface of the dash panel to optimize the transmission loss, and optimization algorithms were not adopted.
AML (Automatically Matched Layer) technology can transform unbounded domains into bounded domains and well solve the problems of computers including limited operational capability and computational efficiency. Moreover, AML technology does not need to establish the regional elements of matched layer. LMS software will automatically generate the element domain of matched layer according to the finite element model of structure and element domain will change with the analyzed frequency, which greatly reduces the workload and improves efficiency. This paper adopted AML method with considering the coupling effect between the dash panel and interior acoustic cavity, and computed the coupling transmission loss. Meanwhile, this paper also adopted genetic algorithm to conduct multi-objective optimization for the dash panel and obtain a low-noise and lightweight structure.
2. AML theories
AML technology calls for the convex profile of meshes to fully consider the interaction of sound waves of two different areas. Concave meshes will absorb sound waves. AML technology only needs to assign the AML property outside the envelope meshes of acoustic finite element. For ideal fluid media, the following time-domain wave equation without absorbing boundary was considered:
where in, Laplace operator is .
To effectively describe the sound radiation problem in free sound field [9-11], of AML layer was introduced as its boundary condition. was artificially assumed sound absorption area. Sound waves were just absorbed completely when spread to the peripheral enveloping surface. When sound fields outside was computed, area was taken as the excitation source of sound waves to compute the radiation sound field and thus describe the sound radiation problem of the whole free sound field completely.
To describe AML algorithm, Eq. (1) was firstly transformed to the frequency domain:
where in, represents Fourier transform of ; is angular frequency. Complex variable was introduced into :
where in, stands for the attenuation function of sound waves in the direction of . In addition, attenuation efficiency satisfied the following equation:
From Eq. (1) to Eq. (4), Helmholtz equation of three-dimensional space field containing AML layer could be obtained as follows:
when . Eq. (4) was put into Eq. (5), and Helmholtz equation of three-dimensional frequency domain containing AML boundary was obtained:
For the simplification, secondary variable was introduced here, whose projections on , and were as follows:
was put into Eq. (6) to obtain the following problem of three-dimensional free sound fields based on AML method:
where in, , and
To make AML layer absorb sound waves effectively, it is necessary to appropriately choose the thickness of AML layer and internal absorption function. Thickness in the direction of was . Waves would be totally reflected at the external surface of AML layer. The sound pressure of reflected waves was as follows:
Reflectivity needed to be selected according to the attenuation efficiency of reflected waves and the thickness of AML layer. Virtual.Lab would automatically match a reasonable value according to the actual situation. To remove the dependence of attenuation function on sound velocity , corresponding acoustic damping could be selected according to .
3. Numerical simulation of interior sound pressures
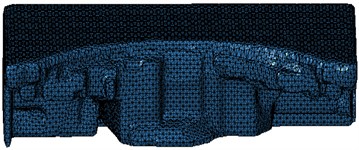
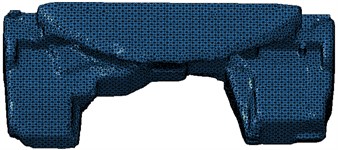
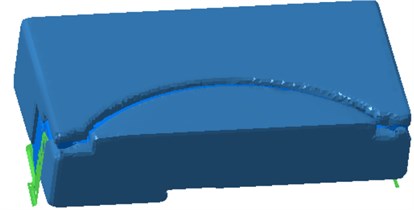
When a vehicle is running, vibration and radiation noise generated by the engine will be finally reverberation noises through the reflection of plates. The noise radiates in the vehicle through the dash panel. Fig. 1(a) displayed the geometric model of the dash panel which contained holes and reinforcing ribs. The thickness of the plate connected with body was 5 mm; the thickness of reinforcing ribs was 3.5 mm; other plates were 3 mm. The meshes of the dash panel were divided according to the geometric model, as shown in Fig. 1(b). Due to the small thickness of the dash panel, meshes mainly adopted quadrilateral shell elements and some transition parts used triangular elements. Plates of different thicknesses were connected by condos. The model finally contained 18709 elements. The dash panel was made of magnesium alloy. Therefore, elasticity modulus was 4.2e10Pa; Poisson’s ratio was 0.35; density was 1750 kg/m3.
As displayed from Fig. 2(a), according to the geometric model of the dash panel, the model of interior cavity was established to further obtain a corresponding acoustic model, as shown in Fig. 2(b). Interior acoustic cavity was coupled with the dash panel. Reverberation sound source was applied as an excitation in one side of the dash panel to simulate the reverberation noise of the engine cabin.
Fig. 1Geometric model and finite element model of the dash panel
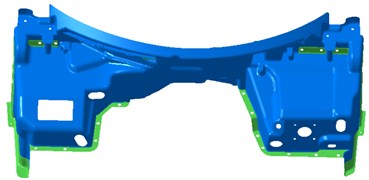
a) Geometric model
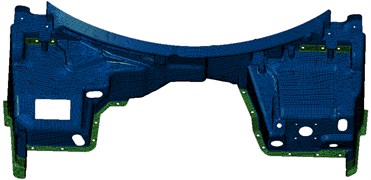
b) Finite element model
Fig. 2Coupling model between the dash panel and interior acoustic cavity
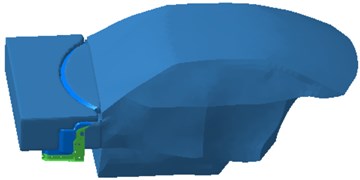
a) Geometric model
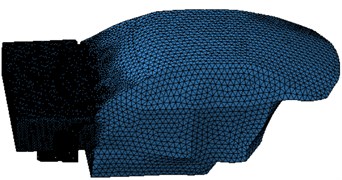
b) Acoustic model
As an important parameter affecting computational results, the damping of the dash panel needs to be considered when interior acoustic cavity is computed. The damping loss factor of the dash panel involves three damping mechanisms:
There in, is the structural loss factor resulting from the internal friction of the material of Subsystem ; is the loss factor resulting from the structural acoustic radiation damping of Subsystem ; is the damping loss factor resulting from the coupling of Subsystem and other subsystems.
The pulse decay method, which requires pulsed excitation or discontinuous steady excitation to obtain the decay rate of a structure [12], was used to measure the damping loss factor of the dash panel.
Fig. 3The damping loss factor of the dash panel
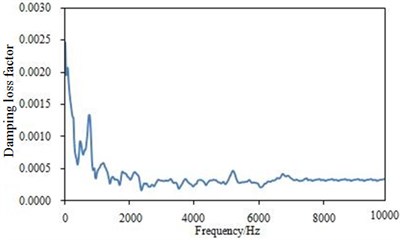
Fig. 4Sound pressure responses in the driver
The experiment was conducted in a semi-anechoic chamber, so as to avoid the disturbance of environment noises and reflected noises. A hammer was used as the excitation equipment, and an acceleration sensor was used to collect the experimental data. 3560 Pulse analysis system was used as the signal acquisition equipment. Finally, the damping loss factor can be obtained as shown in Fig. 3. As displayed from Fig. 3, the damping loss factor of the dash panel was not a constant value in the whole frequency domain. Especially within the frequency of 2000 Hz, damping loss factor had great changes. The maximum value was 0.0025. Therefore, setting a constant value was not enough to compute the acoustic characteristics of the dash panel. Otherwise, computational results would not be reliable.
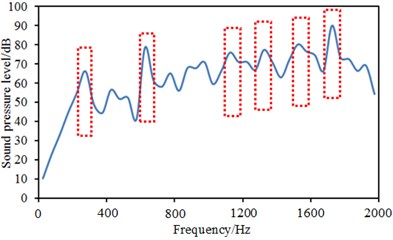
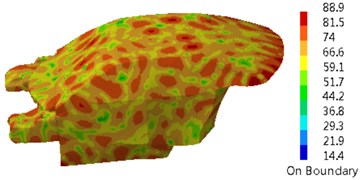
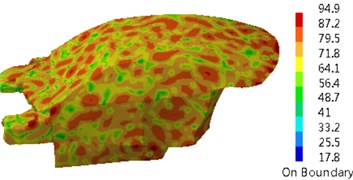
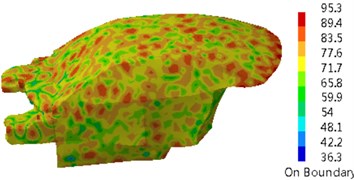
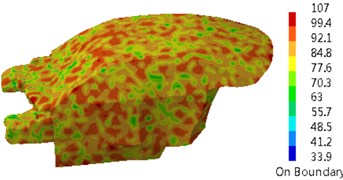
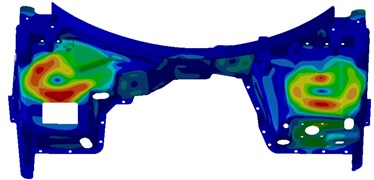
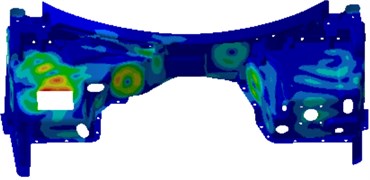
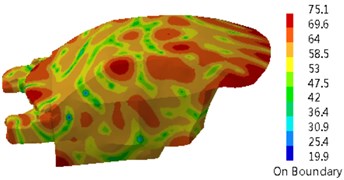
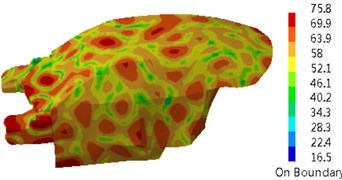
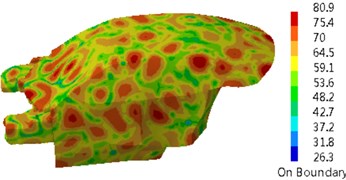
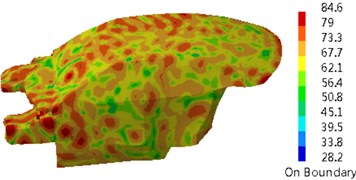
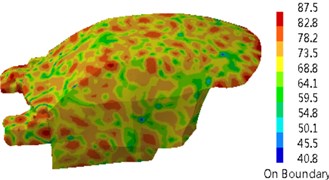
The damping loss factor was imported into the coupling model of Fig. 2 to compute the sound pressure response of the driver in the vehicle, as shown in Fig. 4. Sound pressure responses in the driver had many noise peaks in the analyzed frequency band. Peak noises were 66.1 dB, 77.2 dB, 73.5 dB, 75.4 dB, 78.2 dB and 89.4 dB and corresponding frequencies were 350 Hz, 650 Hz, 1150 Hz, 1350 Hz, 1550 Hz and 1750 Hz. Contours of interior acoustic cavity in peak frequencies were extracted, as shown in Fig. 5. It could be seen from Fig. 5 that contours of noises became increasingly dispersed with the increase of the analyzed frequency. The same color meant that sound pressure became increasingly higher.
Fig. 5Contours of interior acoustic cavity in peak frequencies
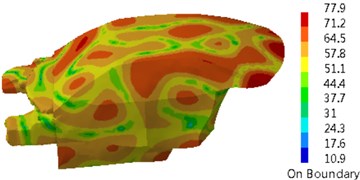
a) 350 Hz
b) 650 Hz
c) 1150 Hz
d) 1350 Hz
e) 1550 Hz
f) 1750 Hz
When sound pressure responses in the driver were computed, a reverberation sound source in the side of the engine cabin was applied as an excitation. The reverberation sound source was firstly transmitted to the dash panel to cause the vibration of the dash panel. On the one hand, the dash panel caused the vibration of interior acoustic cavity and radiated noises. On the other hand, the vibration of the dash panel directly generated the radiation noise in the driver. However, the dash panel was always the source of the sound pressure response of the driver. Therefore, contours of the vibration velocity of the dash panel were extracted after computing the coupling effect between the dash panel and interior acoustic cavity, as shown in Fig. 6. As displayed from Fig. 6, the serious vibration of the dash panel at different frequencies was in different positions. In order to eliminate the peak noises in the driver, it was necessary to conduct comprehensive treatment for these regions.
Fig. 6Contours of the vibration velocity of the dash panel
a) 350 Hz
b) 650 Hz
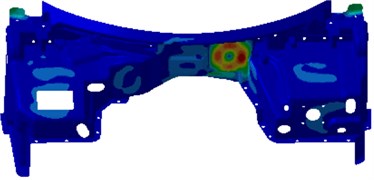
c) 1150 Hz
d) 1350 Hz
e) 1550 Hz
f) 1750 Hz
4. Experimental verification of the computational model for the dash panel
According to the mentioned analysis, the computational model of the dash panel was relatively complex. As a result, it was necessary to verify it through experiments. As shown in Fig. 7, the experimental environment for the transmission loss was made up of the coupled reverberation chamber and anechoic chamber. The dash panel was fixed in the window between the reverberation chamber and the anechoic chamber, and the space between the dash panel and the window was filled with neoprene bars, so that the acoustic excitation in the reverberation chamber could be transmitted to the anechoic chamber only via the dash panel and meanwhile the dash panel was close to the state of free boundary, which would facilitate the subsequent acoustic simulation.
Microphones were respectively installed in the reverberation chamber and the anechoic chamber, and the measurement points in the anechoic chamber were distributed on a hypothetical hemisphere which enveloped the dash panel. After the average sound pressures in the reverberation chamber and the anechoic chamber, namely and , were measured, the transmission loss could be computed as follows [13]:
where is the surface area of the dash panel and is the area of the hypothetical envelope in the anechoic chamber.
Fig. 7The experiment of the transmission loss for the dash panel [7]
![The experiment of the transmission loss for the dash panel [7]](https://static-01.extrica.com/articles/17115/17115-img19.jpg)
a) The incident field side
![The experiment of the transmission loss for the dash panel [7]](https://static-01.extrica.com/articles/17115/17115-img20.jpg)
b) The transmission field side
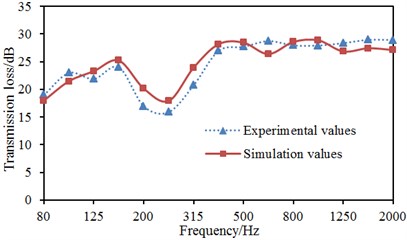
In the engine cabin, the radiation noise from the engine and other noises will be mixed, and are repeatedly reflected and overlaid, thus the incident noise in the dash panel actually forms a nearly reverberated sound field. Therefore, during the acoustic prediction for the dash panel, a reverberant sound source was applied as an excitation to the incident side, so as to better simulate the actual situation. To simulate the experimental process, a reverberation chamber was built in both sides of the dash panel respectively, as shown in Fig. 8. Reverberation chambers on both sides were coupled with the dash panel to establish AML model for the transmission loss, as shown in Fig. 9. A reverberation sound source was applied as an excitation in the incident side. The dash panel was coupled with the contact surface of reverberation chambers on both sides to obtain the transmission loss under the condition of acoustic coupling. In this way, computational results would be more consistent with the actual situation. In addition, AML method can directly extract the transmission loss of the dash panel. The result of the transmission loss obtained under 1/3 octave was compared with the experiment, as shown in Fig. 10.
Fig. 8Reverberation chamber in the incident and transmission side
a) The incident side
b) The transmission side
Fig. 9The simulation model of the transmission loss for the dash panel
As displayed from Fig. 10, the result between experiment and simulation had a good consistency in the whole frequency band. At 250 Hz, experimental and numerical simulation had an obvious valley value. Besides, the maximum difference value between experimental and numerical simulation was 2.6 dB. In reported paper [7], numerical simulation results are greatly different from experimental results in the low frequency because it is difficult to accurately simulate boundary conditions. This paper directly established reverberation chambers in both sides of the dash panel to simulate the actual situation. Computational results were more consistent with experimental results in the whole frequency band, which indicated that it was effective to use AML method to compute the transmission loss of the dash panel.
Fig. 10Comparisons between experiment and simulation under 1/3 octave
5. Parameters analysis for the composite dash panel
The reported methods undoubtedly optimize the transmission loss of the dash panel from structures or sound package. Seriously structural improvement will increase production and manufacturing costs. Therefore, this paper considered adopting a sound package to optimize the transmission loss of the dash panel. As shown in Fig. 11, three layers of materials were covered on the dash panel. They were air layer, sound-absorption layer and mass coverage layer in turn.
Fig. 11The schematic diagram of the proposed sound package
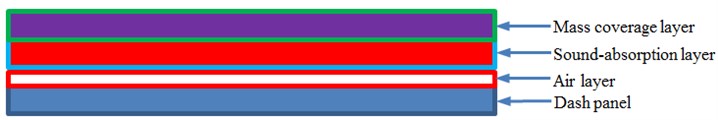
The first layer was the air layer. There is generally an air cavity between the porous sound-absorption layer and the basal plate when a sound package was used. The main aim of such a design is to form a double-layer sound insulation structure, which can effectively block the transmission of the external air sound.
The second layer was the sound-absorption layer. This layer was mainly made of porous sound-absorption material attached to the dash panel, and could convert sound energy into heat energy which would subsequently dissipate. The fluid medium is air, and the main parameters are as follows: fluid density is 1.225 kg/m3; sound velocity in the fluid is 340 m/s; porosity is 0.95; rate of flow resistance is 5000 rayl/m; structural loss factor is 0.01; viscoelastic characteristic length is 7e-5m; thermodynamic characteristic length is 1.2e-4m; material density is 64 kg/m3; Young’s modulus is 2.85e4; Poisson’s ratio is 0.28.
The third layer was the mass coverage layer, with a thickness of 2 mm and a surface density of 4 kg/m2. This layer was intended for facilitating the transfer, assembly and maintenance of geometric shapes.
5.1. The influence of the thickness of the sound-absorption layer on the transmission loss
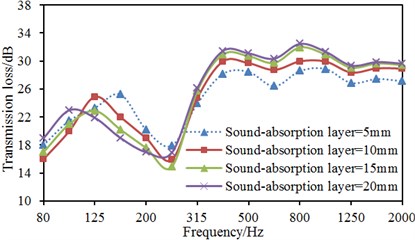
In order to study how the thickness of the sound-absorption layer affects the transmission loss, the thickness was changed by the step size of 5 mm, and controlled within the range of 5 mm-20 mm. The computational results were as shown in Fig. 12.
It could be found from Fig. 12 that the transmission loss of the dash panel increased with the increase of the thickness of the sound-absorption layer at the frequency from 250 Hz to 2000 Hz. When the thickness of the sound-absorption layer increased from 5 mm to 10 mm, the transmission loss increased by 3 dB at most. When the thickness of the sound-absorption layer increased from 10 mm to 15 mm, the transmission loss increased by 2.1 dB at most. When the thickness of the sound-absorption layer increased from 15 mm to 20 mm, the transmission loss increased by 0.3 dB at most. Therefore, the transmission loss presented weak changes with the increase of the thickness of the sound-absorption layer when the analyzed frequency was more than 250 Hz and the thickness of the sound-absorption layer was over 15 mm. At the frequency from 80 Hz to 250 Hz, the transmission loss presented irregular changes with the thickness of the sound-absorption layer mainly because porous materials mainly had good sound-absorption effect on mid-high frequency. In the low frequency, the porous materials probably made the transmission loss smaller, which resulted in poorer sound insulation performance. As displayed from the figure, the transmission loss was greater when the thickness of the sound-absorption layer was 20 mm and analyzed frequency was over 250 Hz, but it would increase the mass of the dash panel and reduce interior space in vehicles.
Fig. 12The influence of the thickness of the sound-absorption layer on TL
5.2. The influence of the thickness of the air layer on the transmission loss
In order to obtain the optimal proposal, the influence of the air layer thickness on the transmission loss was studied by changing the air layer thickness. During the whole analysis process, the thickness of the sound-absorption layer was 15 mm, and the thickness of the air layer was changed from 1 mm-4 mm, with a step size of 1 mm. The computational results were as shown in Fig. 13.
Fig. 13The influence of the air layer thickness on the transmission loss
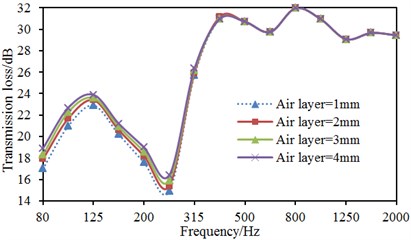
As displayed from Fig. 13, the transmission loss of the dash panel basically kept unchanged with the increase of the air layer thickness when the analyzed frequency was over 250 Hz. When the analyzed frequency was less than 250 Hz, the transmission loss had a weak improvement with the increase of the air layer thickness. When the air layer thickness was increased from 1 mm to 4 mm, the transmission loss only was increased by 0.8 dB at most. However, the increase of the air layer thickness would reduce interior space in vehicles. As a result, the air layer thickness was set as 1 mm.
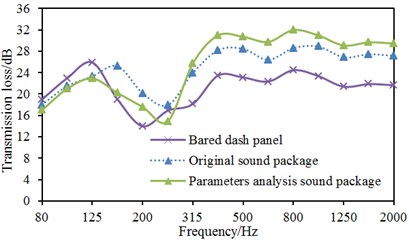
Based on the above analysis, the final proposal was as follows: the air layer thickness was 1 mm, the thickness of the sound-absorption layer was 15 mm, and the thickness of the coverage layer was 2 mm. Before parametric analysis, the thicknesses of the sound package in the dash panel were as follows: air layer was 3 mm, sound-absorption layer was 5 mm, and coverage layer was 2 mm. AML method was also applied to compute the transmission loss of the original composite dash panel and that of the parametric analysis, which was compared with the result of the bared dash panel, as shown in Fig. 14. It was shown that the transmission loss of the composite dash panel can be effectively improved through parametric analysis when the analyzed frequency was more than 315 Hz. However, the transmission loss of the parameter analysis at some frequency points was less than that of the original composite dash panel. As a result, the sound package was applied on the dash panel to change it into the composite dash panel and then made some parametric analysis, which made the average transmission loss of the dash panel increase by 2.6 dB. It was also shown that it was very meaningful to change the dash panel into the composite dash panel through the sound package. However, sound package can’t improve the transmission loss of the dash panel in the whole frequency band, so we must adopt the other method to improve the transmission loss of the dash panel in the whole frequency band.
Fig. 14Comparisons of transmission losses before and after applying sound package
6. Optimization of the transmission loss based on genetic algorithm
The mentioned researches only changed single variables to observe the changes of the transmission loss for the dash panel, whose parameter combination might not be optimal. Therefore, the optimization algorithm was necessary for the further optimization of the transmission loss of the dash panel, in order to obtain an optimal parameter combination. In the optimization process, the maximum transmission loss of the dash panel and sound pressure responses of the driver should be ensured, and meanwhile the lightweight requirement should be satisfied. Therefore, the optimization process is a multi-objective optimization problem. Genetic algorithm (GA) [14-16] has been widely applied in the multi-objective optimization problem [17-20]. Therefore, genetic algorithm was used in the paper to conduct lightweight and low-noise optimization of the dash panel, whose mathematical model was shown in the following:
In Eq. (13), is the total mass of the dash panel, is the average transmission loss of the dash panel. is the sound pressure level in the driver in the vehicle. is the thickness of the porous material layer, is the thickness of the air layer and is the thickness of the coverage layer.
The genetic algorithm with elitist strategy was employed in the paper to conduct a multi-objective optimization of the dash panel. Elitist strategy refers to combine the parent population with its filial population, so as to rank the fitness and compete together to produce the next generation. Elitist strategy is conducive to maintaining good individuals in the parent generation into the next generation and rapidly increasing the level of the population. Its specific optimization process was shown in Fig. 15.
Fig. 15Flow chart of optimization process using genetic algorithm
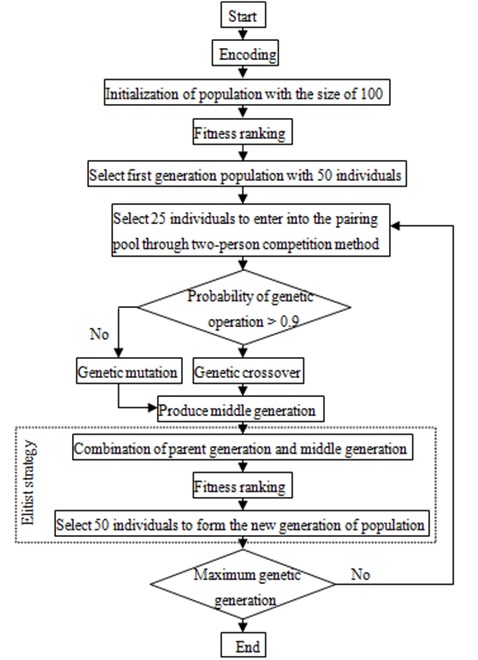
Encoding: Many encoding forms are existed in genetic algorithm. The integer encoding was applied in the paper, whose chromosome string had the length equal to the number of design variables.
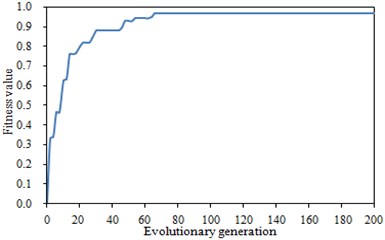
Fitness function: Fitness function is the only indicator to evaluate the advantages and disadvantages of populations in genetic algorithm. In the optimization process, the fitness function was changed as shown in Fig. 16. It was seen that the fitness function had a constant value when it was evolved to the 80th generation.
Initialization of population: In the initialization of population, n different random numbers were generated randomly at one time, thereby forming an individual. The size of GA population was assumed as 50, and then the initial population size was set to 100. Then, 100 individuals were sorted according to their fitness values, and the first 50 individuals with minimum fitness values were selected to form the first generation of population.
Fig. 16Changes of fitness function in the optimization process
Selection: The competition selection method between two people was carried out to choose the parent, which chose two individuals randomly for comparison and selected the winning individual to enter into the paring pool. The size of the pairing pool was half the size of the population
Mutation: The random number in the interval [0, 1] was generated randomly. If the number was larger than 0.9, individuals in the pairing pool conducted on genetic crossover, otherwise conducting genetic mutation.
Then, all individuals in the current generation of population were combined with the middle generation that was produced through genetic crossover and mutation. All hybrid individuals were given fitness ranking. The quality of individuals was determined by their fitness value, and 50 individuals that were more adapted to the environment were selected to form the new generation of population.
In the evolutionary process, the evolution was terminated and individuals in the last generation of population were saved if the number of genetic generation achieved the maximum genetic generation.
The improved results of parametric analysis and genetic algorithm were compared with the result of the original structure, as shown in Table 1. As displayed from Table 1, the optimized transmission loss using genetic algorithm increased by 7.8 dB compared with the original structure and 3.5 dB compared with parametric analysis. The optimized sound pressure levels using genetic algorithm in the driver in the vehicle decreased by 17.7 dB compared with the original structure and 7.3 dB compared with parametric analysis.
Table 1Comparison of parameters before and after optimization
Parameters | Original | Parameter analysis | Genetic algorithm |
(mm) | 5 | 15 | 12 |
(mm) | 3 | 1 | 1.2 |
(mm) | 2 | 2 | 1.5 |
(dB) | 21.1 | 25.4 | 28.9 |
(dB) | 72.3 | 61.9 | 54.6 |
(kg) | 11.4 | 12.5 | 10.6 |
However, the total mass of the dash panel increased by 1.1 kg after parametric analysis and decreased by 0.8 kg after using genetic algorithm. Therefore, the goal of a lightweight and low-noise dash panel was realized after using genetic algorithm. Parameters optimized by genetic algorithm were then applied in AML model to re-compute the transmission loss of the dash panel and the sound pressure response of the driver in the vehicle. The computational result was compared with these results of parametric analysis and the original structure, as shown in Fig. 17 and Fig. 18, respectively.
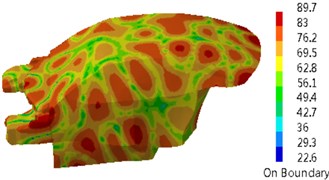
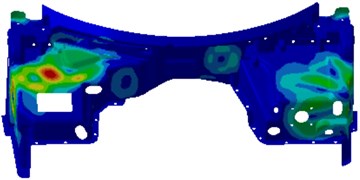
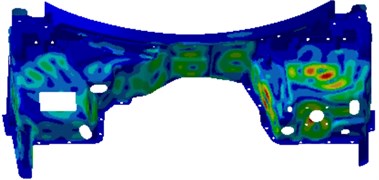
Fig. 17 presented a comparison of the transmission loss of the dash panel through several kinds of optimization strategies. It could be seen from the figure that genetic algorithm could improve the transmission loss of the dash panel in the whole frequency band and other optimization strategies reduced the transmission loss in the low frequency. In particular, genetic algorithm could obviously improve the valley of sound absorption at 250 Hz. Compared with the original sound package, the transmission loss of parametric analysis reduced by 3 dB at 250 Hz. The transmission loss obtained by genetic algorithm increased by 6 dB at 250 Hz. Fig. 18 presented the sound pressure response of the driver through several kinds of optimization strategies. It could be seen from the figure that multiple peak noises of the original sound package were obviously improved after using genetic algorithm, but multiple peak noises had weak changes after using parametric analysis. Contours of interior acoustic cavity under peak frequencies in Fig. 4 were extracted, as shown in Fig. 19. From the comparison between Fig. 5 and Fig. 19, sound pressures at the same frequency point were improved after genetic algorithm was applied to optimize the dash panel.
Fig. 17Comparisons of transmission loss using several kinds of optimization strategies
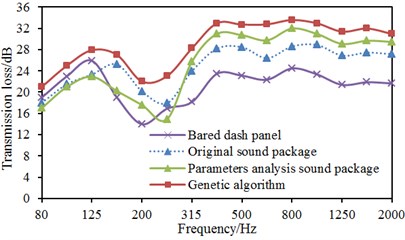
Fig. 18Comparisons of sound pressures using several kinds of optimization strategies
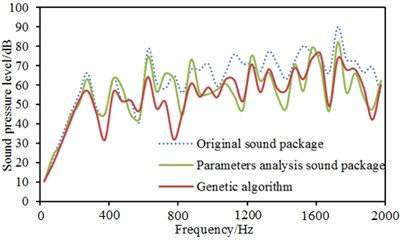
Fig. 19Contours of interior acoustic cavity under peak frequencies
a) 350 Hz
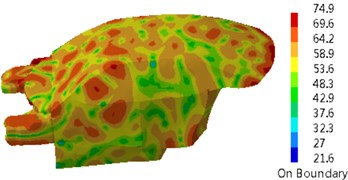
b) 650 Hz
c) 1150 Hz
d) 1350 Hz
e) 1550 Hz
f) 1750 Hz
7. Conclusions
1) The damping loss factor of the dash panel was not a constant value in the whole frequency domain. Especially within 2000 Hz, damping loss factor had a great change. The maximum value was 0.0025. Damping loss factor was imported into the coupling model between the dash panel and interior acoustic cavity to compute the sound pressure response of the driver. Sound pressure responses presented multiple peak values in the analyzed frequency band. Peak noises were 66.1 dB, 77.2 dB, 73.5 dB, 75.4 dB, 78.2 dB and 89.4 dB and corresponding frequencies were 350 Hz, 650 Hz, 1150 Hz, 1350 Hz, 1550 Hz and 1750 Hz, respectively. With the increase of the analyzed frequency, contours of noise at the surface of interior acoustic cavity became increasingly dispersed.
2) Reverberation chambers on both sides were coupled with the dash panel to establish AML model. In this way, the computational transmission loss would be more consistent with the actual situation. AML method can directly extract transmission loss. In reported papers, there are large differences between simulation and experiment because it is difficult to simulate boundary conditions. The computational results in this paper were more consistent with experimental results, which indicated that it was effective to use AML method to compute the transmission loss of the dash panel.
3) A sound package was applied in the dash panel to conduct parametric analysis. Results showed that increasing the thickness of the sound-absorption layer could effectively improve the transmission loss over 250 Hz. When the thickness of the sound-absorption layer was 15 mm, the transmission loss was relatively optimal. In addition, the thickness of air layer had little influence on the transmission loss.
4) Genetic algorithm was used to conduct multi-objective optimization for the transmission loss and sound pressure responses. Results showed that the optimized dash panel had a higher transmission loss, and total mass and sound pressure responses of the driver were also decreased. Moreover, the transmission loss and sound pressure responses of the driver optimized by genetic algorithm at all frequency points were improved to obtain a low-noise and lightweight structure.
References
-
Haase F., Kauba M., Mayer D., et al. Active vibration control of an automotive firewall for interior noise reduction. Adaptronics Congres, 2007.
-
Florentin J., Durieux F., Kuriyama Y., et al. A Steel Solution for a Firewall Using a Hybrid Test/CAE Approach. SAE Technical Paper, 2009.
-
Shivle S., Murthy A. V. Improvement in Noise Transmission Across Firewall of a Passenger Car. SAE Technical Paper, 2010.
-
Duval A., Baratier J., Morgenstern C., et al. Trim FEM simulation of a dash and floor insulator cut out modules with structureborne and airborne excitations. Journal of the Acoustical Society of America, Vol. 123, 2008, p. 5-3532.
-
De Oliveira L. P. R., Da Silva M. M., Sas P., et al. Concurrent mechatronic design approach for active control of cavity noise. Journal of Sound and Vibration, Vol. 314, Issue 3, 2008, p. 507-525.
-
Marburg S., Hardtke H. J. Efficient optimization of a noise transfer function by modification of a shell structure geometry-Part II: Application to a vehicle dashboard. Structural and Multidisciplinary Optimization, Vol. 24, Issue 1, 2002, p. 60-71.
-
Hao Z. Y., Ding Z. Y. Rapid optimization and design of Mag-based composite dash panel with SEA method. Journal of Tianjin University (Science and Technology), Vol. 48, Issue 1, 2015, p. 33-38.
-
Zhang Q., Hao Z. Y., Mao J., Chen X. R. Coupling and optimization analysis of magnesium bulkhead and interior sound field based on SEA. Automotive Engineering, Vol. 36, Issue 8, 2014, p. 1004-1009.
-
Bi C. X., Bolton J. S. An equivalent source technique for recovering the free sound field in a noisy environment. The Journal of the Acoustical Society of America, Vol. 131, Issue 2, 2012, p. 1260-1270.
-
Chang J. H., Jacobsen F. Sound field control with a circular double-layer array of loudspeakers. The Journal of the Acoustical Society of America, Vol. 131, Issue 6, 2012, p. 4518-4525.
-
Gauthier P. A., Camier C., Pasco Y., et al. Beamforming regularization matrix and inverse problems applied to sound field measurement and extrapolation using microphone array. Journal of Sound and Vibration, Vol. 330, Issue 24, 2011, p. 5852-5877.
-
Bolduc Maxime, Atalla Nourddine, et al. Measurement of SEA Damping Loss Factor for Complex Structures. SAE Paper, 2005.
-
Du G. H., Zhu Z. M., Gong X. F. Acoustic Basis. Nanjing University Press, Nanjing, 2001.
-
Moradi M. H., Abedini M. A combination of genetic algorithm and particle swarm optimization for optimal DG location and sizing in distribution systems. International Journal of Electrical Power and Energy Systems, Vol. 34, Issue 1, 2012, p. 66-74.
-
Vidal T., Crainic T. G., Gendreau M., et al. A hybrid genetic algorithm for multidepot and periodic vehicle routing problems. Operations Research, Vol. 60, Issue 3, 2012, p. 611-624.
-
Yen Y. S., Chao H. C., Chang R. S., et al. Flooding-limited and multi-constrained QoS multicast routing based on the genetic algorithm for MANETs. Mathematical and Computer Modelling, Vol. 53, Issue 11, 2011, p. 2238-2250.
-
Ahmadi P., Dincer I., Rosen M. A. Exergy, exergoeconomic and environmental analyses and evolutionary algorithm based multi-objective optimization of combined cycle power plants. Energy, Vol. 36, Issue 10, 2011, p. 5886-5898.
-
Fadaee M., Radzi M. A. M. Multi-objective optimization of a stand-alone hybrid renewable energy system by using evolutionary algorithms: a review. Renewable and Sustainable Energy Reviews, Vol. 16, Issue 5, 2012, p. 3364-3369.
-
Kumari M. S., Maheswarapu S. Enhanced genetic algorithm based computation technique for multi-objective optimal power flow solution. International Journal of Electrical Power and Energy Systems, Vol. 32, Issue 6, 2010, p. 736-742.
-
Rao R. V., Patel V. Multi-objective optimization of heat exchangers using a modified teaching-learning-based optimization algorithm. Applied Mathematical Modelling, Vol. 37, Issue 3, 2013, p. 1147-1162.
About this article

The Priority Academic Program Development of Jiangsu Higher Education Institutions (KYLX_1369).
