Abstract
The paper used the AML method to compute transmission loss of aircraft panels and verifies correctness of the numerical simulation model by experimental test. Finally, this paper used an improved genetic algorithm to conduct a multi-objective optimization for the cabin noise. When the analyzed frequency is less than 250 Hz, transmission loss decreased rapidly with the increased analysis frequency, and decreased from the maximum 63.2 dB to 18.5 dB. Within 250 Hz-4000 Hz, the transmission loss gradually increased with the increased analysis frequency. At 250 Hz, the transmission loss had an obvious valley value. Sound radiation power was then computed based on boundary element method, and panel contribution analysis was conducted to find those panels which had an obvious impact on the cabin noise. Therefore, a multi-objective optimization was conducted on these panels and reinforced ribs. In order to further verify effectiveness of the MPP-NSGA method, it was compared with the traditional GA model and NSGA model. Optimization accuracy using MPP-NSGA model is increased, and optimization time is reduced. Through optimization with traditional GA method, the maximum sound power level decreased by 15.4 %, and the total sound power level decreased by 21.9 %. Through optimization with the NSGA method, the maximum sound power level decreased by 21.7 %, and the total sound power level decreased by 29.0 %. Through optimization with the MPP-NSGA method, the maximum sound power level decreased by 46.3 %, and the total sound power level decreased by 36.0 %. Therefore, compared with other two kinds of genetic algorithms, the MPP-NSGA method is obviously superior in noise optimization in the cabin. In the whole analysis frequency band, noise of the optimized cabin panel at each frequency point was smaller than that of the original structure, fully verifying feasibility of the optimization algorithm proposed in the paper. In addition, in the optimized structure, no panel made obvious contributions to the cabin noise, and each panel showed an equivalent contribution level. Transmission loss of the optimized cabin panel was obviously improved. However, the sound insulation valley still appeared at 250 Hz, but it was not so obvious like the original structure. After optimization, the sound insulation valley was 31.6 dB. The sound insulation valley of the original structure was 18.5 dB. Obviously, the sound insulation valley value of the optimized structure was increased by double compared with the original structure. This paper provided a valuable reference for noise reduction in the aircraft cabin.
1. Introduction
With the rapid development of the aviation industry, aircraft noise problems become more and more obvious. The noise level in an aircraft cabin directly affects riding comfort and language communication convenience of passengers. Therefore, how to reduce the noise level in the aircraft cabin and create a low-noise riding environment has become a research hot topic in aviation acoustics [1-6]. The noise in an aircraft cabin is mainly sourced from structural vibration and air noise caused by an engine outside the cabin as well as air flows. To reduce vibration and noise, traditional measures mainly control low-frequency and mid-frequency structural vibration and noise through applying a damping layer to the panels, and sound absorption cotton is also laid to absorb high-frequency air noise [7-10].
In order to rapidly predict transmission loss of aircraft panels with laid constraint damping, Feng [1] analyzed effects of constraint damping mass, damping loss factor and damping thickness on transmission loss of the aircraft panel based on tested results of transmission loss of a homogeneous panel under impedance tube conditions as well as computational results of a finite element model. He [2] used the transmission matrix method to analyze effects of different distribution types of heat-sound-insulation layers of a civil aircraft on sound insulation performance of aircraft panels. Li [3] used the FE-SEA hybrid method to establish a noise prediction model of the aircraft cabin, proposed a sub-system division method of the aircraft cabin and conducted prediction researches of mid-frequency noise in the aircraft cabin under 4 different excitation conditions. Liu [14] proposed a method which predicts the sound radiation of aircraft panels subjected to turbulent boundary layer excitation. The method is the extension of an earlier deterministic approach, where the modal expansion and receptance methods were used to predict random noise transmission through curved aircraft panels with stringer and ring frame attachments. Rocha [15] studied how sensitive the response of an aircraft panel is to the change of the turbulent flow parameters. Data from flight tests and estimates provided by the empirical models are used to predict radiated sound power, and the results are compared. A sensitivity analysis is performed and the relative contribution of each boundary layer parameter to the radiated sound power is obtained. Aiming at the actual situations that noise is too large in an aircraft cabin under some special conditions, Sun [16] used a micro-perforated panel with sound absorption structure to control the aircraft cabin noise. Aiming at the problem that sound field response characteristics of an aircraft cabin cannot be obtained directly by ANSYS, Wang [17] proposed a numerical simulation computation method of cabin vibration combining with ANSYS and SYSNOISE.
However, the mentioned researches studied aircraft cabin noise mainly based on experiments or numerical simulation, but failed to adopt any optimization algorithm to study aircraft cabin noise. Zhou [18] replaced the finite element model of an aircraft cabin by a surrogate model, and used the traditional genetic algorithm to optimize cabin noise, but the accuracy of surrogate model is lower than that of the finite element model, and the traditional genetic algorithm could easily fall into local extreme values during optimization. The paper uses the AML method to compute transmission loss of aircraft panels and verifies correctness of the numerical model by experiments. Finally, this paper used an improved genetic algorithm to conduct a multi-objective optimization for aircraft cabin noise. Noise reduction effects are obvious. The research is very important for improvement of cabin noise.
2. Establishment and verification of computational model of transmission loss
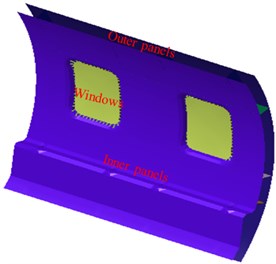
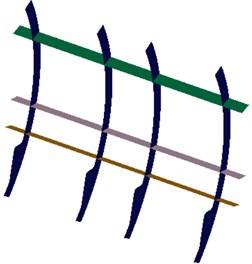
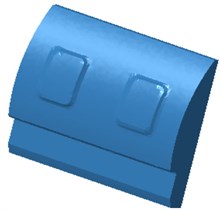
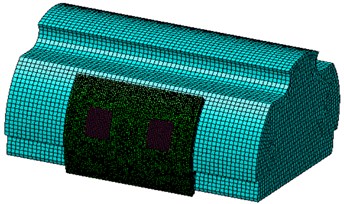
As shown in Fig. 1, a part of the geometric model of aircraft cabin panels were selected as the research. The aircraft cabin panel is composed of an outer panel, an inner panel, reinforced ribs and window glass. Noise generated from external airflow noise and engine vibration firstly causes vibration of the outer cabin panel, and then the noise is transmitted to the cabin by the middle reinforced ribs. It is shown in the figure that the thickness of cabin panels is very small compared with sizes in other directions, so shell elements could be used for mesh division of the cabin panels. Different finite element analysis software has different requirements for quality of elements, where elements with higher quality facilitate smoother finite element analysis. Therefore, element size standards shall be set before mesh division of structural models, so that elements could be modified more easily. During element division, occurrence of finite element meshes shall be avoided as much as possible. A quadrilateral element shall not have too big obtuse angles or too small acute angles, so that appearance of morbid structural rigidity matrices and the consequent accuracy decrease of computational results could be avoided. Intermediate transition shall be set between large and small elements, so the difference of element edge lengths would not be too large. Finer division of element meshes is not always better, where quantities of nodes and elements shall be determined appropriately. According to element division principles, the quadrilateral shell elements were finally applied to all the components, there were 35098 elements and 42087 nodes. Different components of cabin panels were connected by co-nodes.
Fig. 1Geometric model of the aircraft cabin panel
a)
b)
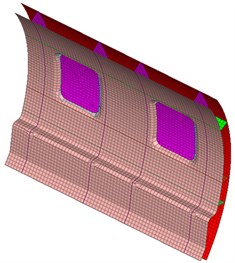
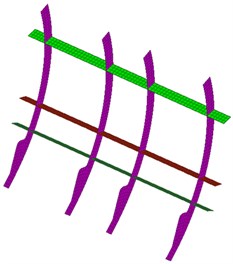
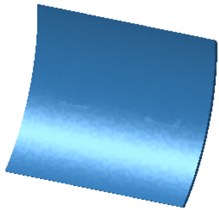
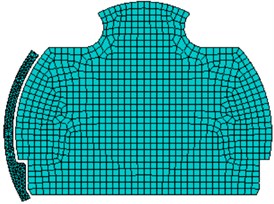
Fig. 2Mesh model of the aircraft cabin panel
a)
b)
Mesh model in Fig. 2 was input VIRTUAL.LAB software. The AML method was used to compute transmission loss of cabin panels. Regarding the AML method, computation of external field noise could be completed with a layer of convex-face enveloped meshes merely. Meshes are automatically generated in a solver, so they could be adjusted automatically according to computational frequency. Firstly, acoustic mesh pretreatment should be conducted. After the treatments, all the normal directions of acoustic mesh pointed to the side with a sound field, namely the outer side of testing parts. Then, fluid material attributes and structural material attributes were defined. The fluid here is air with the attributes as follows: sound velocity of 340 m/s and density of 1.225 kg/m3. Aircraft panels are made of steel, so elasticity modulus is 210 GPa, Poisson's ratio is 0.3, and density is 7800 kg/m3. As for the damping material, elasticity modulus is 450 MPa, Poisson's ratio is 0.45, density is 2700 kg/m3, and the structure loss factor is 0.6. As for aircraft cabin glass, elasticity modulus is 30 GPa, Poisson’s ratio is 0.5, and density is 1200 kg/m3. Similar with the direct boundary element method, the AML method also needs to define mesh type, element group, constraint and excitation. The difference is that the AML attribute is defined on the outermost layer of enveloped meshes. A reverberation chamber was located on the left side. An anechoic chamber was located on the right side. Outer surfaces on two sides of the model were defined as AML faces. The structure could be coupled with meshes on both sides of the sound field very easily. The coupling could be conducted correctly even if nodes and elements of the meshes are inconsistent. As for constraint definition, constraints in 3 directions were still applied to peripheral planes of the panel. Here, two coupling relations should be defined, namely coupling between inner side and panel of the reverberation chamber as well as the coupling between the outer side of panel and inner side of the anechoic chamber. Then, a reverberation sound source was defined. Therefore, the direct sound vibration coupling response solver could be used for solution. Solution parameters were set before the solution: computational frequency of 4000 Hz, and computational step length of 20 Hz.
Fig. 3Computational model of transmission loss of the cabin panel
a) Anechoic chamber
b) Reverberation chamber
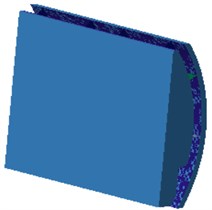
c) AML model
Fig. 4 shows the 1/3 octave transmission loss of cabin panels obtained by the AML method. It is shown in the figure: when the analyzed frequency is less than 250 Hz, transmission loss decreased rapidly with the increased analysis frequency, and decreased from the maximum 63.2 dB to 18.5 dB. Within 250 Hz-4000 Hz, the transmission loss gradually increased with the increased analysis frequency. At 250 Hz, the transmission loss had an obvious valley value mainly because of structural resonance. At this moment, the structural modal frequency of cabin panels coincided with the excitation, causing an obvious resonance. No obvious peaks existed at other frequency points of transmission loss.
Fig. 4Transmission loss of the cabin panel
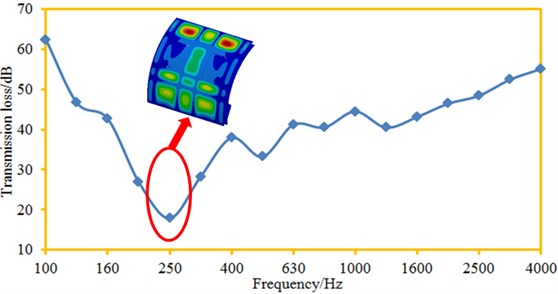
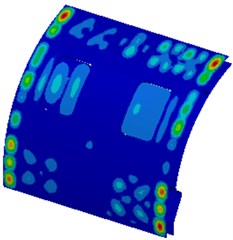
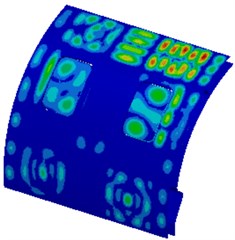
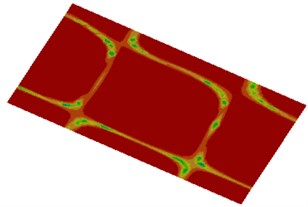
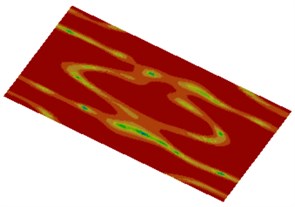
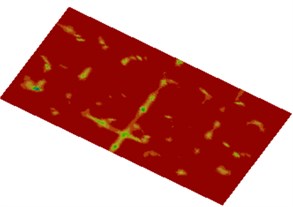
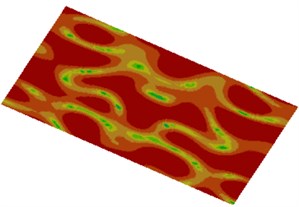
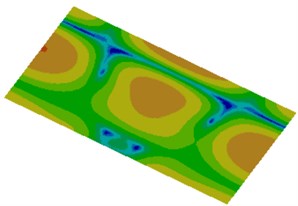
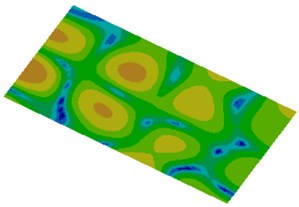
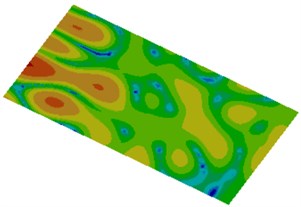
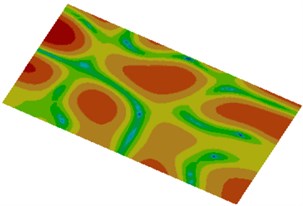
Fig. 5 shows a contour about vibration displacement of the cabin panel at each frequency point. It is shown in the figure that vibration displacement distribution of the cabin panels is basically symmetric. In some local areas of the cabin panel, vibration displacement obvious exceeded those at other positions. Vibration was more serious in upper areas of the cabin panel.
Computational model of the cabin panel is relatively complicated, so correctness of the numerical computation model shall be verified by experiments. In order to obtain ideal sound vibration characteristics and accurately assess noise reduction effects obtained through panel vibration suppression, the experimental environment shall be quiet enough, and interference brought by reflected sounds to experimental work shall be eliminated. Therefore, all the acoustic experiments shall be conducted in an anechoic chamber. The anechoic chamber is experimental equipment which provides an approximate free sound field for acoustic testing. All the boundaries are covered by a sound absorption material which can effectively absorb sound energy, so an effective free sound field can be formed indoors. In order to obtain the boundary condition of four-edge fixation, a clamp shall be designed aiming at cabin panels. The clamp shall not only be able to clamp the cabin panel but shall also ensure that an excitation source will not spread noise to other directions except for panel vibration excitation and thus effects on a sound-pressure meter can be avoided. The opened face of the reverberation chamber has an inner diameter of 800*1000 mm, satisfying size of the tested and clamped panel, as shown in Fig. 6. An excitation loudspeaker was located in the reverberation chamber; the inner wall is wrapped by sound absorption cotton; 18 threaded holes were drilled in each side edge of the opened face and used for testing part fixation. During the experiment, a pink noise source was set in the reverberation chamber. After formation of stable reverberation effects, sound pressure levels at each microphone was measured synchronously. Each group of data was recorded for 8 s; each panel was measured for 3 times; sampling frequency was 65536 Hz. PULSE software was used to process the collected data, so experimental transmission loss of the cabin panels could be obtained. The experimental results were compared with numerical simulation results, as shown in Fig. 7.
Fig. 5Vibration displacement of the cabin panel
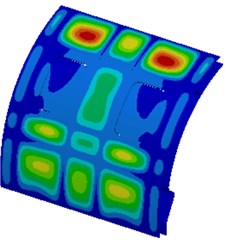
a) 250 Hz
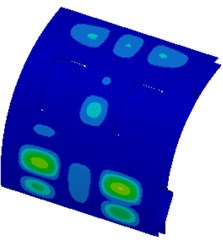
b) 500 Hz
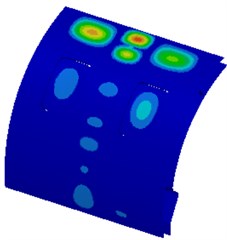
c) 1000 Hz
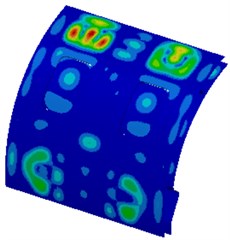
d) 2000 Hz
e) 3000 Hz
f) 4000 Hz
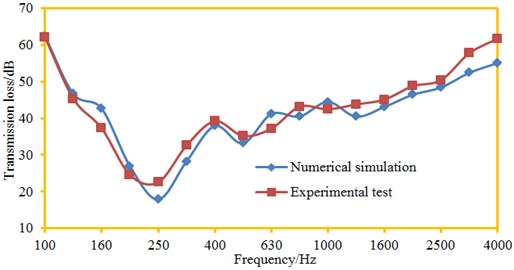
It is shown in Fig. 7 that changing trends of experimental results and numerical simulation result are completely consistent. For both of them: when the analyzed frequency is less than 250 Hz, transmission loss decreased sharply with the increased analysis frequency. When the analyzed frequency is more than 250 Hz, transmission loss increased slowly with the increased analysis frequency. In addition, an obvious valley value appeared on the numeral and experimental transmission loss curves at 250 Hz, respectively, wherein the experimental valley value was 22.5 dB, and the numerical simulation valley value was 18.5 dB. Within the whole analysis frequency band, the largest difference between the experiment and the numerical simulation was 5.2 dB. Experimental results are not completely consistent with numerical simulation results because: sound leakage exists inevitably when transmission loss of the cabin panel is tested, but numerical simulation is completely rational and sound leakage does not exist; in addition, numerical simulation is greatly affected by boundary conditions. However, as a whole, accuracy of the numerical computation model is high, so it can replace experimental test.
Fig. 6Experimental test of transmission loss of the cabin panel
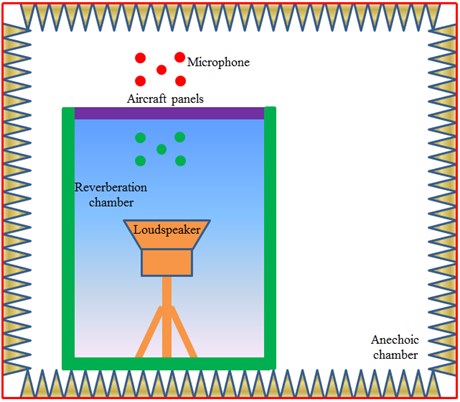
Fig. 7Comparison between experimental and simulation results of transmission loss
3. Numerical computation of noises in the cabin
It is shown in above analysis that transmission loss of the cabin panel still has serious defects and needs to be further improved. Vibration is the source for noise generation. Therefore, we only need to recognize which part of cabin panel structure makes large contribution to noise and then make improvement of it. Acoustic panel contribution analysis could be used to solve these problems effectively. However, published acoustic computation software could not compute acoustic panel contribution while computing the transmission loss. Panel contributions could be obtained during separation computation of cabin radiated noise. As shown in Fig. 8, a sound cavity model of a part of the cabin was established. Shape of the sound cavity model considers effects of luggage cases and other accessories, satisfying the actual situations.
During computing transmission loss of aircraft panels, structural responses of panels could be obtained, as shown in Fig. 5. In VIRTUAL.LAB, the structural response data was input as the boundary condition of boundary element simulation. Size of boundary element meshes was different from the size of finite element meshes, namely element nodes of structural meshes and boundary element meshes could not be matched. As a result, they were inconsistent in element size, element density, node coordinates, etc. Therefore, data transfer processing should be conducted in the software. Acoustic boundary element meshes are directly correlated with computational frequency. As for the boundary element computation software, at least 6 elements should be distributed within one wavelength. The wavelength of air noise was 340 mm at 4000 Hz, so the size of sound field boundary element was set to be 5 mm. In order to observe noise in the cabin, an observation point and an observation plane were set in the cabin. Finally, the computational model of noise was obtained, as shown in Fig. 9. It contains 10267 elements and 15982 nodes.
Fig. 8Geometric model of sound cavity in the cabin

a)

b)
Fig. 9Computational model of noise in the cabin
a)
b)
Fig. 10Radiated sound power in the cabin
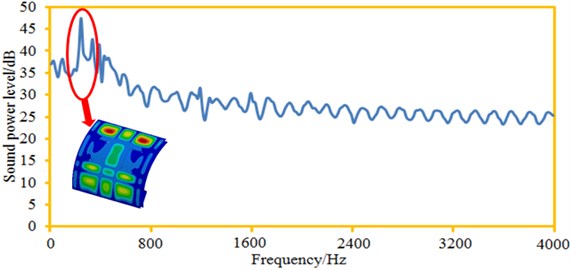
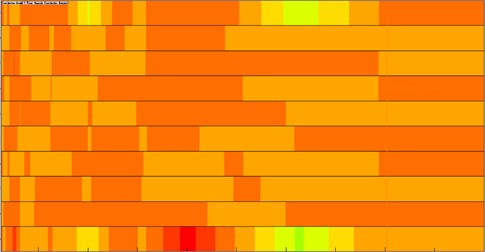
The sound power curve of the observation point was extracted, as shown in Fig. 10. It is shown in the figure: when the analyzed frequency is less than 250 Hz, the sound radiation power increased sharply with the increased analysis frequency. When the analyzed frequency is more than 250 Hz, the sound radiation power gradually decreased till a steady state with the increased the analysis frequency. An obvious peak value appeared at 250 Hz because of structural resonance, which is exactly corresponding to the valley value frequency point of the transmission loss curve. This result indirectly verifies that the cabin noise computation model established in this paper is corrected. Maximum sound radiation power was 47.5 dB; minimum sound radiation power was 24.1 dB; radiated sound power ranged greatly. When the analyzed frequency is more than 2000 Hz, the sound radiation power presented certain periodicity because the cabin panel structure was obviously symmetric, and the excitation was the structural vibration response caused by a reverberation sound source composed of 12 planar waves.
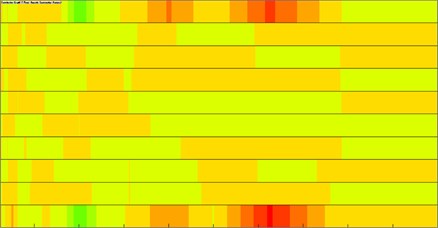
During computing radiated noise in the cabin, the cabin panel was divided into 9 different areas, as shown in Fig. 11. Division of panels obeys the principle of similarity. The window glass was taken as a separate panel. Contributions made by each panel of the cabin panel at the observation point were extracted. Results are shown in Fig. 12. It is shown in the figure that only several panels made outstanding contributions to cabin noise.
Fig. 11Panels of the cabin panel
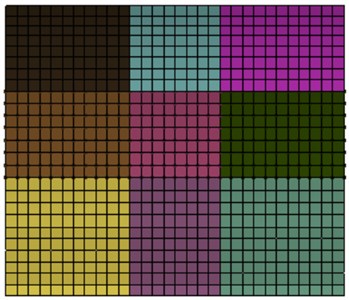
Fig. 12Panel contribution distribution of the cabin panel
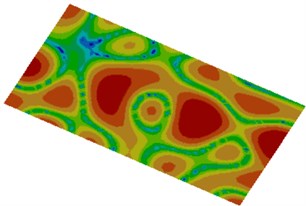
Distribution contours of the radiated sound field visually reflect distribution of sound radiation powers under different frequencies, as shown in Fig. 13. It is shown in the figure that sound radiation power distribution of plane field points in the cabin was basically symmetric because the cabin panel is a highly symmetric structure and the applied excitation was also distributed uniformly. In addition, it is shown in the figure that the contours of sound radiation power distribution became increasingly dispersed with the increase of the analyzed frequency.
4. Numerical optimization of noises in the cabin
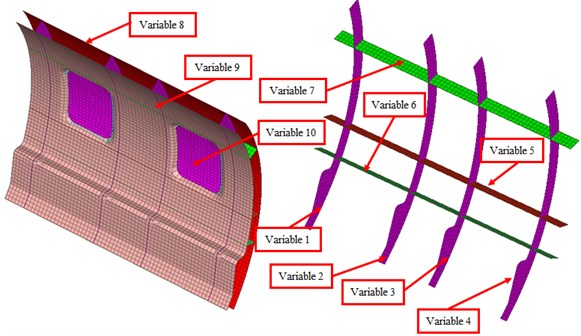
Large radiated noise of the cabin will seriously weaken riding comfort of passengers and will also cause sound fatigue of the cabin panel structures. Therefore, it is necessary to adopt relevant measures to optimize radiated noise of the cabin panel. The design variable of the paper is thickness of all the components, as shown in Fig. 14. In this way, only the thickness needs to be changed in processing of optimized parts, and structures need not to be redesigned. Radiated noise in the cabin has very large peak sound power, so minimization of the maximum sound power and the total sound power is taken as the objective, wherein it is set as . It is necessary to avoid mass increase during reducing noise in the cabin, so as to save materials and cost. Therefore, mass of the cabin panel is taken as the constraint function and set as . Its mathematical model is as follows:
where: denotes the maximum radiated sound power level of the cabin panel; denotes the total sound power level of the cabin panel; denotes the design variable; original mass of the cabin panel is 25 kg; denotes the lower limit of design variable; denotes the upper limit of design variable.
Fig. 13Distribution cloud picture of in-cabin radiation noise
a) 250 Hz
b) 500 Hz
c) 1000 Hz
d) 2000 Hz
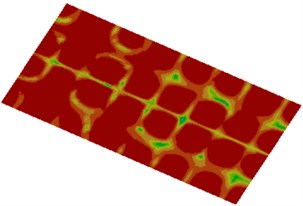
e) 3000 Hz
f) 4000 Hz
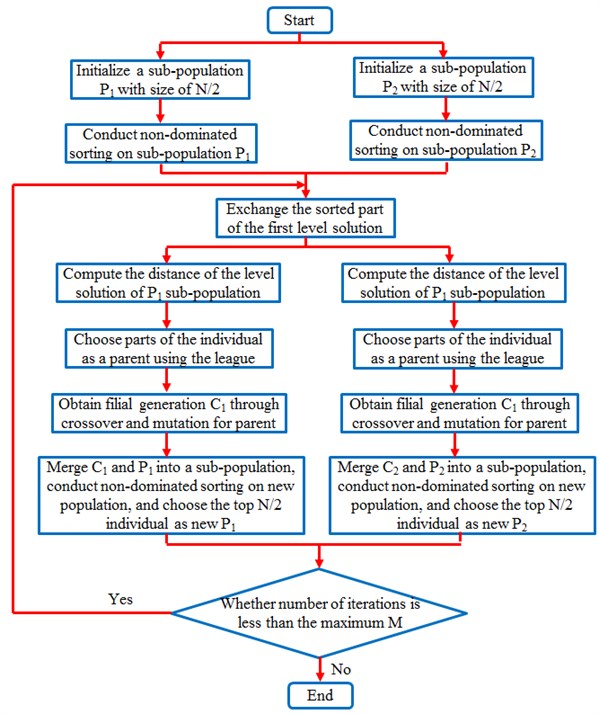
In order to improve timeliness and robustness of the NSGA algorithm [19-24], the paper makes necessary improvements to the basic NSGA-II algorithm. The paper proposed the non-dominated sorting genetic algorithm based on multiple parallel evolutions of sub-populations (MPP-NSGA). It is assumed that the initial population size is . Then, with this method, the cyclic core code will be executed for times. The paper divides the large population into two small populations for parallel evolution, so each small population cycle core will be executed for times. The sum of cycle core execution times of the two small populations is , which is over 50 % lower than the of the original NSGA. Multiple parallel evolutions of sub-populations proposed by the paper obey the idea that: A large population was divided into multiple populations at first, and then evolution was conducted based on the original non-dominated sorting algorithm. Processes of the improved NSGA-II algorithm are shown in Fig. 15. Specific realization processes are as follows:
1) Two sub-populations and with population size of /2 ( is size of whole population) are initialized. Each individual in the population is ; is a decision variable dimension; is the random number of each decision variable value range. Iteration ending conditions are determined. iterations are set as the iteration ending condition in this paper.
2) Non-dominated sorting is conducted to individuals in each sub-population.
3) A part of first-grade solutions of two sub-populations after the sorting are exchanged.
4) Distance of each grade individual is computed. During computation, corresponding grade individuals of two sub-populations are integrated into a complete grade set. Then, the distances of corresponding grade individuals in the complete grade set is computed.
5) The tournament selection method is conducted to each sub-population. Half of the individuals are selected as parent individuals. Later generations and could be generated after crossover and variation.
6) The sub-population and the original population are integrated into a population. The sub-population and the original population are integrated into a population. The two newly formed populations are sorted in a non-dominated manner. The first /2 individuals are taken as and respectively.
7) Whether the result satisfies the iteration condition is judged. If the condition is satisfied, Step (3) would be started.
8) After the iteration, response grade solutions of the two sub-populations are combined to constitute the final complete solution set.
Fig. 14Variable distribution of radiated noise of the cabin panel
In order to further verify effectiveness of the MPP-NSGA after parameter selection, it was compared with the traditional GA model and NSGA model. GA, NSGA and MPP-NSGA adopted the same population to conduct a multi-objective optimization for maximum sound power and total sound power of the cabin panel. Prediction errors of three kinds of optimization algorithms are shown in Fig. 16. Iteration ending condition of three kinds of algorithms is the reaching of a set iteration generation. It is shown in Fig. 16 that error convergence values of GA, NSGA and MPP-NSGA were 0.128, 0.105 and 0.035 when the iteration reached the 85th generation. All of them were not lower than the error critical value. When the iteration reached 120th generation, the error of MPP-NSGA model was 0.001, smaller than the set critical error value of 0.0015. At this moment, errors of GA and NSGA were 0.128 and 0.105, far exceeding the critical error value. When the iteration reached 85th-260thgeneration, the GA model fell into local extreme values. When the iteration reached 310th generation, the NSGA converged. At this moment, the error was 0.0015, still exceeding the set critical error. When the iteration reached the 380thgeneration, the GA model converged. At this moment, the error was 0.0025, exceeding the critical error. When iteration of MPP-NSGA reached the 120th generation, the prediction error was 0.001, smaller than the set critical error. Therefore, optimization accuracy is increased, and optimization time is reduced.
Fig. 15Optimization processes of MPP-NSGA algorithm
In order to present iteration processes of three kinds of algorithms more vividly, the maximum sound power level and total sound power level are taken as longitudinal and horizontal coordinates respectively, so the population figure of the cabin panel can be obtained, as shown in Fig. 17. It is shown in Fig. 17 that performance of most individuals in the optimization is better than that of original individuals while the whole population had a high evolution level. The original maximum sound power level was 47.5 dB; total sound power level was 28.3 dB. Through optimization with traditional GA method, the maximum sound power level was 40.2 dB; total sound power level was 22.1 dB; obviously, the maximum sound power level decreased by 15.4 %, and the total sound power level decreased by 21.9 %. Through optimization with the NSGA method, the maximum sound power level was 37.2 dB; the total sound power level was 20.1 dB; obviously, the maximum sound power level decreased by 21.7 %, and the total sound power level decreased by 29.0 %. Through optimization with the MPP-NSGA method, the maximum sound power level was 35.2 dB; the total sound power level was 18.1 dB; obviously, the maximum sound power level decreased by 46.3 %, and the total sound power level decreased by 36.0 %. Therefore, compared with other two kinds of genetic algorithms, the MPP-NSGA is obviously superior in noise optimization in the cabin.
Fig. 16Comparison of prediction errors of three kinds of algorithms

Fig. 17Optimized iteration processes of three kinds of algorithms
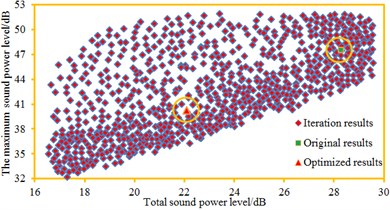
a) GA method
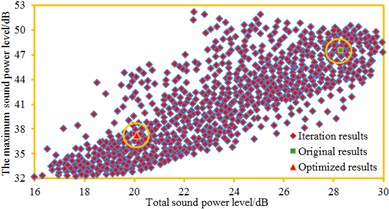
b) NSGA method
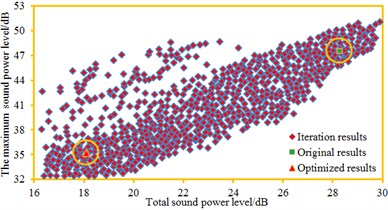
c) MPP-NSGA method
Table 1Comparison of the variable between original and optimized values
Parameters | Original values/mm | Optimized values/mm |
Variable 1 | 2.5 | 2.4 |
Variable 2 | 2.5 | 2.2 |
Variable 3 | 2.5 | 2.2 |
Variable 4 | 2.5 | 2.6 |
Variable 5 | 2.5 | 2.3 |
Variable 6 | 3.0 | 2.7 |
Variable 7 | 3.0 | 2.6 |
Variable 8 | 2.0 | 1.8 |
Variable 9 | 1.5 | 1.6 |
Variable 10 | 25 | 24.3 |
According to optimization parameters in Table 1, a new geometric model was established. Further, a corresponding acoustic computation model was obtained. Optimized cabin noise was computed and compared with original results, as shown in Fig. 18. It is shown in the figure that the noise of the optimized cabin was obviously lower than that of the original structure. The maximum sound power level decreased from the original 47.5 dB to 35.2 dB. In the whole analysis frequency band, noise of the optimized cabin panel at each frequency point was smaller than that of the original structure, fully verifying feasibility of the optimization algorithm proposed in the paper. In order to further observe noise improvements after the optimization, contributions of the cabin panel were also computed, as shown in Fig. 19. It is shown in Fig. 19 that in the optimized structure, no panel made obvious contributions to the cabin noise, and each panel showed an equivalent contribution level.
Fig. 18Radiated sound power in the cabin
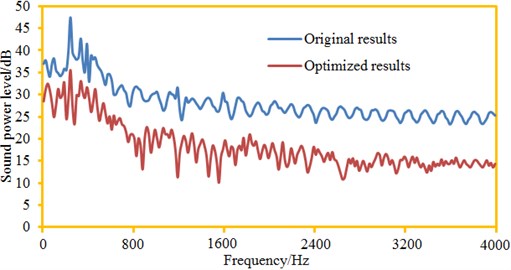
Fig. 19Panel contribution distribution of the cabin panel
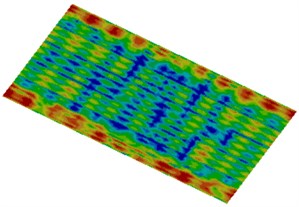
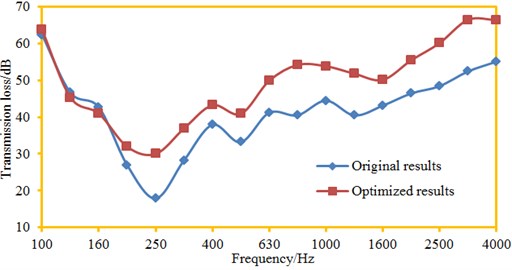
The sound field distribution contour of plane observation points in the cabin was extracted, as shown in Fig. 20. Compared with Fig. 13, the cabin noise after optimization was obviously smaller than that of the original structure. After the optimization, the cabin noise also showed symmetry in low frequency bands, but the symmetry was not so obvious like the original structure. Transmission loss of the cabin panel was the initial research index of the paper. Therefore, numerical computation was also conducted to the transmission loss of the optimized cabin panel structure. The computational results were compared with results of the original structure, as shown in Fig. 21. It is shown in the figure that transmission loss of the optimized cabin panel was obviously improved. However, the sound insulation valley still appeared at 250 Hz, but it was not so obvious like the original structure. After optimization, the sound insulation valley was 31.6 dB. The sound insulation valley of the original structure was 18.5 dB. Obviously, the sound insulation valley value of the optimized structure was increased by double compared with the original structure. In addition, when the analyzed frequency was lower than 160 Hz, transmission loss of the optimized structure was not larger than that of the original structure. On one hand, low frequency bands could be obviously affected by boundary conditions; the optimized structure remodeled the cabin panel, so boundary conditions might not be consistent with the original structure. On the other hand, computation of transmission loss was not based on radiated noise of one observation point in the cabin; instead, average radiated noise of multiple observation points was taken as the computational basis. At all the frequency points, the radiated noise of observation points extracted by the paper was smaller than the original results, but the radiated noise of all the observation points in the cabin decreased in all the frequency bands. Therefore, decrease of radiated noise at one observation point after the optimization does not mean that the transmission loss at all the frequency points would exceed that of the original structure.
Fig. 20Distribution contours of radiated noise in the cabin
a) 250 Hz
b) 500 Hz
c) 1000 Hz
d) 2000 Hz
e) 3000 Hz
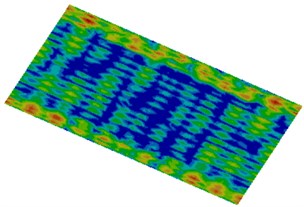
f) 4000 Hz
Fig. 21Transmission loss of the cabin panel before and after optimization
5. Conclusions
The paper used the AML method to compute transmission loss of aircraft panels and verifies correctness of the numerical simulation model by experimental test. Finally, this paper used an improved genetic algorithm to conduct a multi-objective optimization for the cabin noise, and these addressed conclusions can be achieved:
1) When the analyzed frequency is less than 250 Hz, transmission loss decreased rapidly with the increased analysis frequency, and decreased from the maximum 63.2 dB to 18.5 dB. Within 250 Hz-4000 Hz, the transmission loss gradually increased with the increased analysis frequency. At 250 Hz, the transmission loss had an obvious valley value mainly because of structural resonance.
2) Changing trends of experimental test and numerical simulation result are completely consistent. In addition, an obvious valley value appeared on the numeral and experimental transmission loss curves at 250 Hz, respectively, wherein the experimental valley value was 22.5 dB, and the numerical simulation valley value was 18.5 dB. As a whole, accuracy of the numerical computation model is high, so it can replace experimental test.
3) When the analyzed frequency is less than 250 Hz, the sound radiation power increased sharply with the increased analysis frequency. When the analyzed frequency is more than 250 Hz, the sound radiation power gradually decreased till a steady state with the increased the analysis frequency. An obvious peak value appeared at 250 Hz, which is exactly corresponding to the valley value frequency point of the transmission loss curve. This result indirectly verifies that the cabin noise computation model established in this paper is corrected.
4) In order to further verify effectiveness of the MPP-NSGA after parameter selection, it was compared with the traditional GA model and NSGA model. They adopted the same population to conduct a multi-objective optimization for maximum sound power and total sound power of the cabin panel. Optimization accuracy using MPP-NSGA model is increased, and optimization time is reduced. Through optimization with traditional GA method, the maximum sound power level was 40.2 dB; total sound power level was 22.1 dB; obviously, the maximum sound power level decreased by 15.4 %, and the total sound power level decreased by 21.9 %. Through optimization with the NSGA method, the maximum sound power level was 37.2 dB; the total sound power level was 20.1 dB; obviously, the maximum sound power level decreased by 21.7 %, and the total sound power level decreased by 29.0 %. Through optimization with the MPP-NSGA method, the maximum sound power level was 35.2 dB; the total sound power level was 18.1 dB; obviously, the maximum sound power level decreased by 46.3 %, and the total sound power level decreased by 36.0 %. Therefore, compared with other two kinds of genetic algorithms, the MPP-NSGA is obviously superior in noise optimization in the cabin.
5) In the whole analysis frequency band, noise of the optimized cabin panel at each frequency point was smaller than that of the original structure, fully verifying feasibility of the optimization algorithm proposed in the paper. In the optimized structure, no panel made obvious contributions to the cabin noise, and each panel showed an equivalent contribution level.
6) Transmission loss of the optimized cabin panel was obviously improved. However, the sound insulation valley still appeared at 250 Hz, but it was not so obvious like the original structure. After optimization, the sound insulation valley was 31.6 dB. The sound insulation valley of the original structure was 18.5 dB. Obviously, the sound insulation valley value of the optimized structure was increased by double compared with the original structure.
References
-
Salamone S., Bartoli I., Di Leo P., et al. High-velocity impact location on aircraft panels using macro-fiber composite piezoelectric rosettes. Journal of Intelligent Material Systems and Structures, Vol. 21, Issue 9, 2010, p. 887-896.
-
Bravo T., Maury C. A. synthesis approach for reproducing the response of aircraft panels to a turbulent boundary layer excitation. The Journal of the Acoustical Society of America, Vol. 129, Issue 1, 2011, p. 143-153.
-
Fidell S., Mestre V., Schomer P., et al. A first-principles model for estimating the prevalence of annoyance with aircraft noise exposure. The Journal of the Acoustical Society of America, Vol. 130, Issue 2, 2011, p. 791-806.
-
Mallardo V., Aliabadi M. H., Brancati A., et al. An accelerated BEM for simulation of noise control in the aircraft cabin. Aerospace Science and Technology, Vol. 23, Issue 1, 2012, p. 418-428.
-
Khan W. S., Asmatulu R., Yildirim M. B. Acoustical properties of electrospun fibers for aircraft interior noise reduction. Journal of Aerospace Engineering, Vol. 25, Issue 3, 2011, p. 376-382.
-
Campolina B. A., Atalla A. N., Dauchez N., et al. Four-pole modelling of vibration isolators: Application to SEA of aircraft double-wall panels subjected to mechanical excitation. Noise Control Engineering Journal, Vol. 60, Issue 2, 2012, p. 158-170.
-
Palumbo D., Klos J. The effects of voids and recesses on the transmission loss of honeycomb sandwich panels. Noise Control Engineering Journal, Vol. 59, Issue 6, 2011, p. 631-640.
-
Anoshkin A. N., Zuiko V. Y., Tashkinov M. A., et al. Repair of damage in aircraft composite sound-absorbing panels. Composite Structures, Vol. 120, 2015, p. 153-166.
-
Arunkumar M. P., Pitchaimani J., Gangadharan K. V., et al. Sound transmission loss characteristics of sandwich aircraft panels: influence of nature of core. Journal of Sandwich Structures and Materials, Vol. 19, Issue 1, 2017, p. 26-48.
-
Qian Z., Chang D., Liu B., et al. Prediction of sound transmission loss for finite sandwich panels based on a test procedure on beam elements. Journal of Vibration and Acoustics, Vol. 135, 2013, https://doi.org/10.1115/1.4023842
-
Feng Z. X., Han F., Feng M., Wang X. L., Huang Z. Y. Effects of constrained layer damping patches on the sound insulation characteristics of aircraft panels. Noise and Vibration Control, Vol. 36, Issue 3, 2016, p. 76-80.
-
He L. Y., Hu Y. Influence of distribution mode of thermal/acoustic insulation blankets on the transmission loss of airplanes. Noise and Vibration Control, Vol. 35, Issue 6, 2015, p. 123-126.
-
Li B., Chen K. A., Pan K., Hu Y. Prediction and validation of aircraft cabin noise by hybrid FE-SEA method at mid-frequency range. Noise and Vibration Control, Vol. 8, Issue 4, 2011, p. 60-63.
-
Liu B. L. Noise radiation of aircraft panels subjected to boundary layer pressure fluctuations. Journal of Sound and Vibration, Vol. 314, 2008, p. 693-711.
-
Rocha J., Palumbo D. On the sensitivity of sound power radiated by aircraft panels to turbulent boundary layer parameters. Journal of Sound and Vibration, Vol. 331, Issue 21, 2012, p. 4785-4806.
-
Sun Y. F., Chen R. W., Xu Z. W., Gong H. Y., Wang X. W. Experimental research of noise control in the flighter cockpit using microperforated panel absorber structure. Acta Acoustica, Vol. 28, Issue 4, 2003, p. 294-298.
-
Wang L. L., Li S. M., Yu G. Q., Wang Q. The modeling of civil aircraft cabin and numerical simulation of radiation noise based on FEM/BEM. Machine Design and Manufacturing Engineering, Vol. 42, Issue 11, 2013, p. 10-13.
-
Zhou Y., Zhao Y., Meng Z. Design on low noise and lightweight of aircraft equipment cabin based on genetic algorithm and variable-complexity model. Journal of Vibroengineering, Vol. 17, Issue 4, 2015, p. 2066-2076.
-
Ramesh S., Kannan S., Baskar S. Application of modified NSGA-II algorithm to multi objective reactive power planning. Applied Soft Computing, Vol. 12, Issue 2, 2012, p. 741-753.
-
Sadeghi J., Sadeghi S., Niaki S. T. A. A hybrid vendor managed inventory and redundancy allocation optimization problem in supply chain management: An NSGA-II with tuned parameters. Computers and Operations Research, Vol. 41, 2014, p. 53-64.
-
Tomoiagă B., Chindriş M., Sumper A., et al. Pareto optimal reconfiguration of power distribution systems using a genetic algorithm based on NSGA-II. Energies, Vol. 6, Issue 3, 2013, p. 1439-1455.
-
Pires D. F., Antunes C. H., Martins A. G. NSGA-II with local search for a multi-objective reactive power compensation problem. International Journal of Electrical Power and Energy Systems, Vol. 43, Issue 1, 2012, p. 313-324.
-
Honda S., Igarashi T., Narita Y. Multi-objective optimization of curvilinear fiber shapes for laminated composite plates by using NSGA-II. Composites Part B: Engineering, Vol. 45, Issue 1, 2013, p. 1071-1078.
-
Kalaivani L., Subburaj P., Iruthayarajan M. W. Speed control of switched reluctance motor with torque ripple reduction using non-dominated sorting genetic algorithm (NSGA-II). International Journal of Electrical Power and Energy Systems, Vol. 53, 2013, p. 69-77.
About this article

This work was supported by the National Natural Science Foundation of China (No. 51504080), by the National Natural Science Foundation of Hebei Province (No. E2017209178), Science and Technology Project of Hebei Province (No. 15214104D) and the National Natural Science Foundation of Hebei Education Department (No. QN2016088).
Jie Li completed the writing, Weixing Liu completed the experimental test, Yuzhu Zhang provided the idea in this paper, and Ling Zhang, Shanshan Li finished the translation and submission.
