Abstract
The kurtogram analysis presents some limitations when diagnosing gearbox systems, particularly in time domain. Its envelop signal analysis is not able to detect any defects. This paper presents a new approach to enhance the detection and diagnosis in gearbox systems. This new approach is based on Maximum Correlated Kurtosis Deconvolution combined with Spectral Kurtosis fault diagnosis methodology. This technique allows us to obtain better detection in the gearbox system which is not the case of the spectral kurtosis analysis alone. For this purpose, a dynamical model of a simple stage gearbox is proposed. The approach can detect and identify at early stage the gearbox and also the crack tooth defects.
1. Introduction
Reducers (or multipliers) gears are widely used in mechanics; they are used in all types of industries, such as in processes; automotive (gear boxes), flying (helicopters), cement plants, refineries. These mechanical elements are much solicited, complex to be dimensioned and to be fabricated which may present some defects, limiting their life time. For this reason, we may find various studies in the literature concerning their dimensioning, materials study, lubrication, defect analysis [1-3], supervision technics and so on to avoid sudden failures and reduce maintenance costs in industrial environment by applying the so called conditional maintenance [4-7].
In general, gears work under severe conditions consequently they are subject to progressive deterioration of their state, namely at the teeth level. The gear defects induce generally mechanical effects in machines such as sound increased level [8] and vibrations. However, the presence of the tooth crack defect appears at its basis and progress each time when running the machine. It appears especially on fine stainless steels, it became hard by heat treatment, which are very sensitive to stress constrains. The tooth crack appearance is a result of the stress at the tooth basis which exceeds the fatigue limit of the material. This tooth crack does not modify the contact rigidity, but affects the tooth flexion rigidity. This results in a change in the vibration behavior [9, 10]. Hence the need to supervise these gear vibrations continuously to detect at an early stage any emerging defects [11].
Several supervision methods of machines have been proposed in the literature. Certainly, the most commonly used is vibration analysis [12, 13]. Indeed, this method can give qualitative information on the efforts developed within the machine components and can detect eventual defect through an appropriate technique. Recently, many signal processing techniques have been developed [14]. They have been proposed for the diagnosis and detection of gear faults in early stages of their appearance.
Techniques based on Fourier analysis, give satisfactory results for defect qualified as ‘simple defect’, (they are the mostly used), such as the unbalance system, some bearing fault. They are often ineffective when defects are characterized by complex variations of the spectrum, and particularly for non-stationarity in the vibration signal. This is the case for gears that generate rich vibrational signatures; it is often difficult to follow their evolutions and, in some particular defects (leading quickly to breaking teeth) makes early detection difficult.
Demodulation [15, 16], envelope analysis [17, 18], time-scale methods, Cepstre [19, 20], time-frequency methods [21, 22] and minimum entropy deconvolution [23] are diagnosis methods. To make an efficient diagnosis, we must understand how the gear vibration results under the meshing defects. The time-frequency methods allow locating characterized events in time by complicated contained frequency. Among these methods, the Wavelet Transform (WT), proposed by Morlet [24], was used to solve problems encountered while implementing the Short Time Fourier Transform (STFT) and the Wigner Ville Distribution (DWV).
The WT uses short duration windows for high frequencies and long duration windows for low frequencies, which allows us to have multi analysis resolutions. However, this last one is subject to Hisenberg inequality and also the signal vibration analysis by WT depends strongly on the analyzed wavelet. But the Spectral kurtosis (SK) which is one of the high orders spectral analyses (fast kurtogram) is an efficient tool to characterize the dynamic behavior of the speed reducer system.
This paper presents the use of Maximum Correlated Kurtosis Deconvolution (MCKD) filter combined with Spectral Kurtosis in the early detection and advancement monitoring of gear tooth crack fault. For this purpose, an electromechanical system consisting of one stage gear box (with and without defects) is proposed. This approach is used to characterize the signature of a pitting tooth defect. This method is suited for such diagnosis and gives valuable and efficient information about the presence and effects of tooth crack defect.
2. Correlated kurtosis
Numerous components in equipment can produce impulse signals, which generate many issues in fault feature extraction. To address this problem, McDonald [25] proposed the Correlated Kurtosis (CK), which reflects the strength of the periodicity impulsion components in the vibration signals. Its formula is expressed as follows:
where represents the filtered signal and is the cycle of the fault impulse signal. represents the number of migration cycles; CK considers both impulsion and cyclicity. CK overcomes the limitation of kurtosis in which the component feature of the specific signal cannot be reflected as a local index. When is set, CK can reflect the periodicity impulsion strength of the signal, precisely for the bearing surface fault. A high CK value indicates that the weight generated by the periodicity impulsion components of the signal is heavy.
3. Maximum correlated kurtosis deconvolution
The maximum correlated kurtosis deconvolution technique is a type of system identification method which searches for an optimum set of filter coefficients to recover the desired input signal. The filter design aims at the maximum value of correlated kurtosis in output signal. The process of MCKD is shown in Fig. 1.
The algorithm is performed by McDonald [25], where he explains all the steps. The main content is listed as follows:
The objective of the algorithm is to find the filter coefficients which maximize the correlated kurtosis of the output signal :
Fig. 1Inverse filtering (deconvolution) process of MCKD

The output signal can be described as a convolution given by Eq. (3):
Optimum filter settings occur when the derivative of the objective function ObjM(T) given by Eq. (2) achieves zero. This can be written as follows:
Combining Eqs. (2), (3) and (4), we end up by the following expression:
where:
In order to obtain the filer coefficients, we have developed the following iterative process:
Step 1: Set the period of interest of impulse and the order shift .
Step 2: Assume the initial value of the inverse filter coefficients .
Step 3: Compute the output . Using the filter coefficients and input signal using Eq. (3).
Step 4: Update the new filter coefficients .using Eq. (5).
Step 5: Compute the error criterion of the algorithm until it reaches the zeroing:
If the ‘err tolerance’ given in Eq. (6) is not reached, the iterative process will continue the computation of the filter coefficients by updating their values restarting from step 3. On the other hand, when the ‘err tolerance’ is reached, the iterative process will stop execution. The obtained filter coefficients are the best fitted.
4. Spectral kurtosis and kurtogram
Spectral Kurtosis (SK) is gaining ground as an effective signal processing method in vibration analysis. The specific characteristics of the signal under study can be identified with the aid of analysis or decomposition techniques. Based on time-frequency analysis, it is possible to identify for each frequency band where the signal energy is concentrated by calculating the Kurtosis values [26].
The SK concept analysis was first developed by Antony [27] as a tool which was able to trace non-Gaussian features in different frequency bands using the fourth order moment of the real part of the Short Time Fourier Transform (STFT). Dwyer [28] investigated the SK application on stationary processes but did not account non-stationary vibration signatures typical those of rotating machines. To date the most comprehensive calculations of the SK have been developed by Antony [27] as the fourth order cumulant of the spectral moment ():
and:
is estimated using the STFT given by Eq. (9):
where is the sampled version of the signal and is the window function having zero value outside the chosen interval.
To validate the above estimation function, the size of the window () should be smaller than the length between two repetitive pulses and longer than the length of each pulse. In other words, the analyzed signal should be locally stationary.
Using the definition given by Antony et al. [27-29], where they developed the concept of the Kurtogram to detect the non-Gaussianity in the signal. A Kurtogram simply maps the STFT-based SK values as functions of frequency and window size. Antony [29], suggested to use the Kurtogram for designing the band-pass filter which can be applied to increase the signal-to-noise ratio, thereby preserving the pulse-like nature of the signal.
The frequency and window size (bandwidth) at which the Kurtogram is at its maximum was employed to build the band-pass filter that was subsequently employed in the analysis of the measured signal. In a separate investigation [30] Antony proposed an algorithm for fast computation of the Kurtogram. In this method instead of using STFT at different window lengths, the signal is decomposed by means of quasi-analytic low-pass and high-pass filters to generate a pyramidal filter-bank tree with 2 bands in each level (). Thus, the Kurtogram is computed by calculating the kurtosis of all frequency bands as given by Eq. (10):
where is the sequence of the coefficient from the th filter at th level.
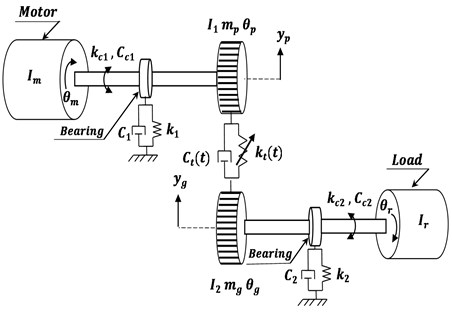
5. Gearbox system
The considered gearbox is given in Fig. 2. It is a simple stage gear with right teeth. We consider the gear as if it is a couple of rigid cylinders bounded by stiffness of engaging representing the whole contributions of the deformable teeth.
The system is composed by two rotary trees, reducer entry tree with revolution number Wm, output shaft , engine, wheel, pinion and a receiver, all have rotations , , , respectively, a pair of gears and rolls of the dice.
Fig. 2Dynamic gearbox system with 6-degree-of-freedom
5.1. General assumptions
The following assumptions are generally taken by most researchers.
• Vertical rigidities are equal, .
• Vertical damping coefficients are equal, .
• Damping Coefficient (DC) is supposed to be proportional to the rigidity of total engaging , where is a constant equal to 3.99×10⁻⁶.
Table 1Major parameters of the spur gears used in this model
Symbol | Value | Description |
0.023976 kg m2 | Moments of inertia for electric motor | |
4.3659×10⁻⁴ kg m2 | Moments of inertia for pinion | |
8.3602×10⁻³ kg.m2 | Moments of inertia for output gear | |
0.01015 kg m2 | Moments of inertia for driven machine | |
25 N·m | Output torque from load | |
6.56×10⁷ N/m | Radial stiffness of the bearing | |
4.4×10⁴ Nm/rad | Torsional stiffness of the flexible coupling | |
1.8×10⁵ N.s/m | Viscous damping coefficient of the bearing | |
5×10⁵ Nm s /rad | Viscous damping coefficient of flexible coupling | |
2.88 Kg | Mass of the gear | |
0.96 Kg | Mass of the pinion | |
0.0301 m | Base circle radius of pinion | |
0.0761 m | Base circle radius of output gear | |
, | 19, 48 | Number of teeth on pinion and gear |
0 | The contact angle |
The equations motions of the system are as follows:
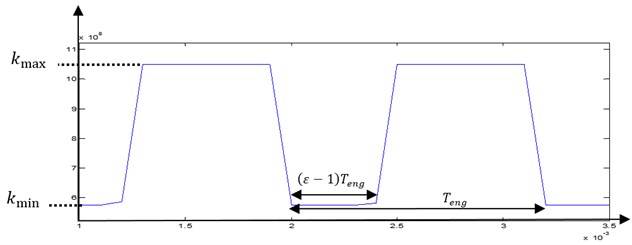
5.2. Gear mesh stiffness evolution
When the system is in normal functioning, the teeth in healthy gear will be under stress when applying load. The meshing process is always varying from one and two pairs of teeth in contact [31]. The contact duration depends on the contact ratios . As a consequence, the gear mesh stiffness will fluctuate around the mean value as shown in Fig. 3.
Consequently, gear mesh stiffness , can be approximated as given by Chaari et al. [31]:
where represents the contact ratio and n is an integer representing the th gear mesh period.
Fourier development of is given by Eq. (18):
with:
and:
By introducing the gear stiffness ratio and using some mathematical transformations, the maximum and minimum value of the gear stiffness can be calculated according to Saeed [32]:
where, 2.068 1011 N/m² is the Young’s modulus mean value of the gear bodies, 0.16 m is the effective width of meshing gears, 0.47 is the shape factor and 0.5476 is the stiffness ratio.
Fig. 3Pair gears time variation of stiffness gear mesh kt
This meshing process is considered as the main excitation source of the system. The vibratory response will be dominated by the gear mesh frequency , and its harmonics, which are defined by Eq. (22):
where and are the rotational frequency of pinion and gear respectively. and are the tooth numbers of the pinion and gear respectively.
5.3. Tooth crack effects on the gear mesh stiffness evolution
Choy et al. [33] have established that the gear tooth failure induces amplitude and phase changes in vibration. This phenomenon can be represented by magnitude and phase changes in gear mesh stiffness.
The undamaged configuration of the mesh stiffness is given by 0 % phase change and 0 % amplitude reduction. Amplitude and phase changes are applied on gear mesh stiffness from these reference values to simulate the tooth cracking.
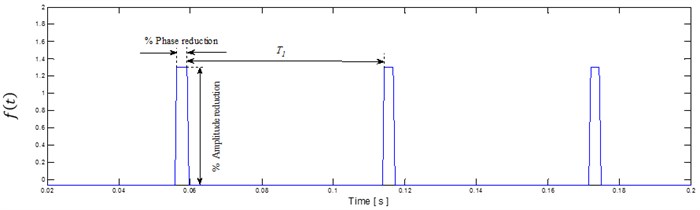
An amplitude modulation of the gear mesh signal is expected from these induced-defect changes (Fig. 5). In fact, the new gear mesh signal, resulting from the defect modeling can be expressed by Eq. (23):
where is the modulating function.
The tooth failure which induces variations in gear mesh stiffness used for the simulations is given in Fig. 4. From this figure, it can be observed that as the size of the pitting surface grows, the total mesh stiffness when the cracking tooth is in meshing becomes much lower.
As a result of this amplitude modulation, an exciting force appears and the frequency content of the response is also affected.
Fig. 4Induced tooth failure in variations in gear mesh stiffness
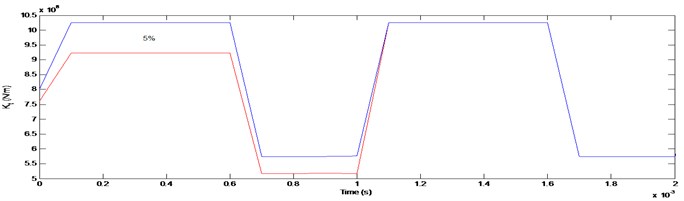
Fig. 5Modulating function
6. Simulations based on waveform direct analysis
The proposed gearbox system was analyzed under the considered assumptions given in Section 5.1. The gear speed reduction was simulated under nominal functioning conditions with respect to the behavior change regime of the mechanical system. The obtained signal is considered as the signal reference of the mechanical system under normal functioning. Fig. 6 shows the pinion vibration displacement signal in healthy functioning mode of the gearbox.
The mathematical pinion vibration displacement equations as function of time were obtained. The vibration displacement response of the healthy gearbox with 0 % crack was simulated. The obtained results are given in Fig. 6.
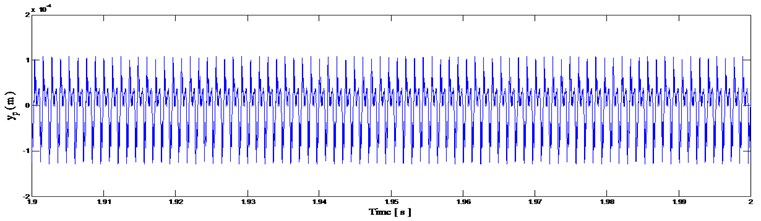
We have simulated the tooth crack defect on the wheel tooth by 3 % amplitude reduction of gear mesh stiffness operating in modulation function . The obtained simulation result of the pinion vibration displacement in presence of tooth crack defect is shown in Fig. 7. Comparing these two signals given in Fig. 6 and Fig. 7, it is clear that we cannot distinguish any defect of the gear tooth crack. The two signals look like to be identical. Thus, we deduce that from the waveform direct analysis of the pinion vibration displacement it is not possible to differentiate these two signals (healthy and defect modes).
Fig. 6Pinion vibration displacement signal in healthy functioning mode of the gearbox
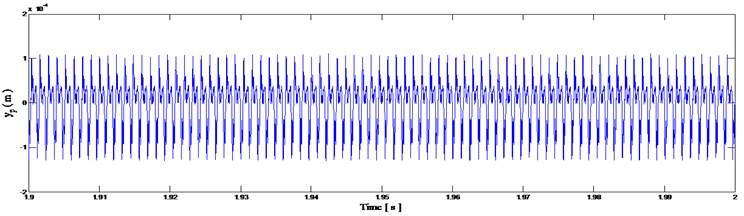
Fig. 7Pinion vibration displacement signal with tooth crack defect
7. Detection and diagnosis by SK
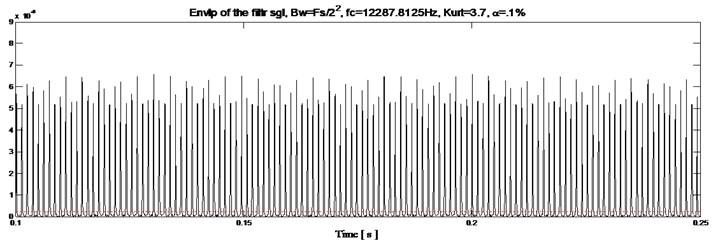
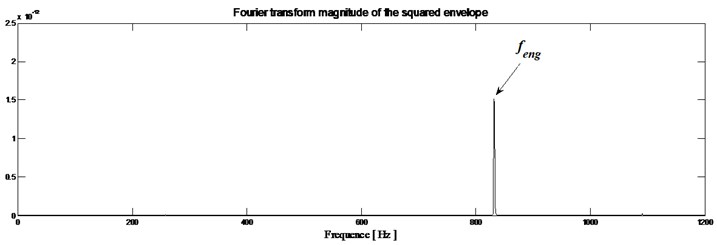
The corresponding envelope magnitude spectrum signal obtained in case of healthy gearbox is shown in Fig. 8(b), whereas for faulty gearbox the obtained signal is shown in Fig. 9(b). Comparing these two signals, we can see immediately the defect through the frequency component of the envelope spectrum signal. The defect is related to the rotational tooth frequency at 43.83 Hz and its harmonics.
However, Fig. 8(a), shows the obtained envelope magnitude signal of the pinion vibration displacement in case of healthy gearbox, whereas Fig. 9(a) shows the tooth crack defect of the gearbox. We deduce that the envelope magnitude direct analysis of the pinion vibration displacement is not suited to detect the gear tooth crack defect. The envelope signal does not provide any information regarding the defect.
8. Detection and diagnosis using the new approach
Our approach consists of using the maximum correlated kurtosis deconvolution and the spectral kurtosis. By this combined tools we have the guaranty to detect any tooth crack defect of the gearbox. We have applied the Fast Kurtugram with seven levels (7) by preprocessing the signal. Then we have considered firstly the healthy gearbox and secondly the faulty mode and finally a comparison is made between the two states.
Fig. 8Healthy gearbox signal: a) envelope magnitude which maximizes the kurtogram together with its 0.1 % signification threshold, b) envelope spectrum as provided by Fourier transforms
a)
b)
Fig. 9Defected gearbox signal: a) envelope magnitude which maximizes the kurtogram together with its 0.1 % signification threshold, b) envelope spectrum as provided by Fourier transforms
a)
b)
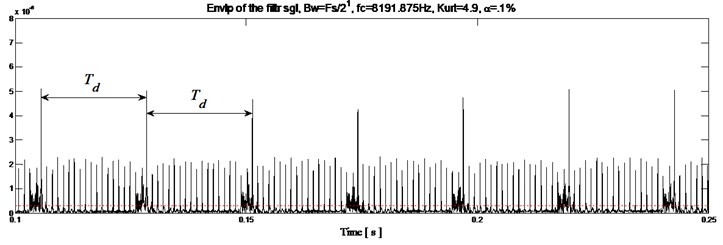
First information: Fig. 10 shows the Kurtogram of Fig. 6, the maximum value of the spectral kurtosis occurs at 3.7 corresponding to the bandpass filter with a center frequency 8191.875 Hz and the bandwidth 12287.8125 Hz. On the other hand, when we consider the tooth crack defect on the wheel (3% reduction in the wheel mesh stiffness), the obtained results are given in Fig. 11, the kurtogram has an abnormally high value of its spectral kurtosis (5) at dyad (8191.875 Hz/16383.75 Hz). This reveals clearly the presence of sharp abnormal shocks in the signal.
Fig. 10Fast kurtogram of the signal shown in Fig. 5, Kmax= 3.7 is reached at dyad (12287.8125 Hz/8191.875 Hz)
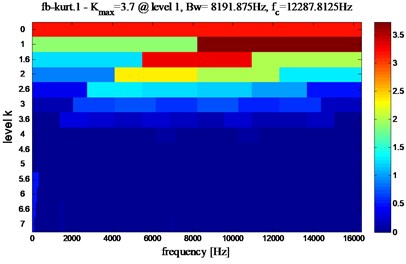
Fig. 11Fast kurtogram of the signal shown in Fig. 6, Kmax= 5 reached at dyad (8191.875 Hz/16383.75 Hz
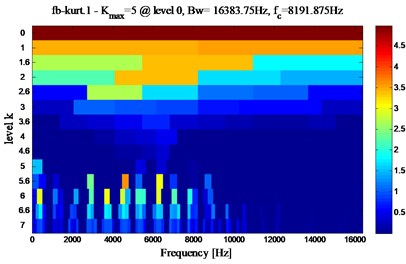
Fig. 12Healthy gearbox: a) envelope magnitude which maximizes the Kurtogram, together with its 0.1 % signification threshold, b) envelope spectrum as provided by the Fourier transforms
a)
b)
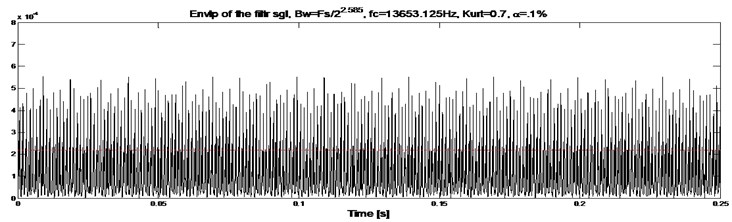
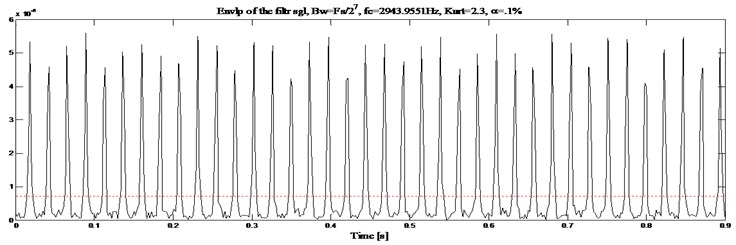
Second information: The squared envelope of the filtered signal which represents the time domain of the system (Fig. 12(a)) shows the gearbox in healthy mode. The faulty mode of the squared envelope signal is shown in Fig. 13(a). Through these obtained two signals we can observe that the main difference is the appearance of periodic peaks at period equal to 0.022815 s corresponding to . This obtained result is in conformity with theoretical calculation of the default time component related to the rotational tooth frequency denoted ().
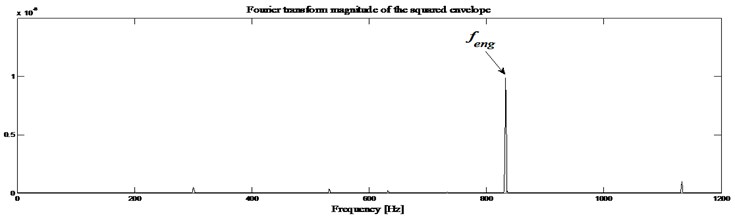
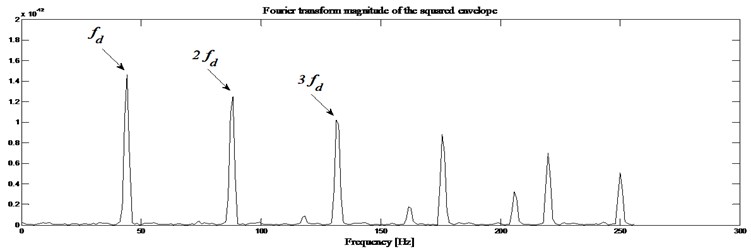
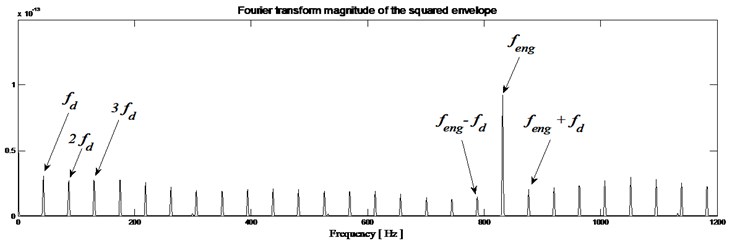
Third information: The squared envelope spectrum of the filtered signal is obtained and the result is shown in Fig. 12(b). On this squared envelope spectrum, only the meshing frequency (832 Hz) can be observed. Fig. 13(b) shows this meshing frequency surrounded by a family of periodic lateral stripes of period equal to the rotational frequency of the analyzed wheel. So, the envelope spectrum immediately indicates a fault frequency component related to the rotational tooth frequency ( 43.83 Hz) and its harmonics (2, 3).
Fig. 13Gearbox with defect: a) envelope magnitude which maximizes the Kurtogram, together with its 0.1 % signification threshold, b) envelope spectrum as provided by the Fourier transforms
a)
b)
9. Conclusions
This paper presents a new approach to enhance the supervision and diagnostic capability of spectral kurtosis. The method is based on squared envelope analysis to detect the tooth crack defect through vibration signal analysis. The gearbox system is used as a study case to show the developed approach efficiency in detecting the defect at its early stage of appearance. We show that the spectral kurtosis is not efficient in time domain (envelope magnitude). However, when we combine the spectral kurtosis and the Maximum Correlated kurtosis deconvolution methods, we improve considerably the failure detection analysis where the envelope signal gives more information in time domain.
According to our approach, it handles three important information regarding to the defect detection, which are fast Kurtogram map, time domain introduced by magnitude envelope signal and frequency domain introduced by spectral analysis of magnitude envelope. By using this new approach, we are sure to detect the defect in both domains, temporal and frequency domains.
References
-
Hui M. Fault features analysis of cracked gear considering the effects of the extended tooth contact. Engineering Failure Analysis, Vol. 48, 2015, p. 105-120.
-
Edgar E., Ilmar S. Controllable lubrication for main engine bearings using mechanical and piezoelectric actuators. Transactions on Mechatronics, Vol. 17, Issue 2, 2012, p. 279-287.
-
Liang Xihui, Ming J. Z., Mohammad R. H. Vibration signal modeling of a planetary gear set for tooth crack detection. Engineering Failure Analysis, Vol. 48, 2015, p. 185-200.
-
Suratsavadee K., Himanshu J., Wei-Jen L., Chiman K. Wireless health monitoring system for vibration detection of induction motors. Industrial and Commercial Power Systems Technical Conference, Vol. 978, Issue 1, 2010, p. 4244-4262.
-
Al-Badour F., Sounar M., Cheded L. Vibration analysis of rotating machinery using time-frequency analysis and wavelet techniques. Mechanical Systems and Signal Processing, Vol. 25, Issue 6, 2011, p. 2083-2110.
-
Luisa F. V., Anıbal R., Jose R. P., Luis De J. M. Statistical fault diagnosis based on vibration analysis for gear test-bench under non-stationary conditions of speed and load. Mechanical Systems and Signal Processing, Vol. 29, 2012, p. 436-446.
-
Ebersbach S., Peng Z., Kessissoglou N. J. The investigation of the condition and faults of a spur gearbox using vibration and wear debris analysis techniques. Wear, Vol. 260, Issues 1-2, 2006, p. 16-24.
-
Raymond A. G. Rolling Bearings Handbook and Troubleshooting Guide, Chilton Book Compagny. Radnor, Pennsylvania, 1996.
-
Pattantyus J., Lakis A. A., Marsan S., Robertson B. Gearbox vibration diagnosis and failure analysis. Compte Rendu du 20th Séminaire, 125000 HP, 2002.
-
Sawalhi N., Randall R. B. Simulating gear and bearing interactions in the presence of faults. Mechanical Systems and Signal Processing, Vol. 22, Issue 8, 2008, p. 1924-1951.
-
Haloui N., Chikouche D., Benidir M. Diagnosis of gear systems by spectral analysis of vibration signals. International Journal of Computer Science and Network Security, Vol. 7, Issue 10, 2007, p. 285-293.
-
Lokesha M. Fault diagnosis in gear using wavelet envelope power spectrum. International Journal of Engineering, Science and Technology, vol.3, Vol. 8, 2011, p. 156-167.
-
Aherwa A. Vibration analysis techniques for gearbox diagnosis. International Journal of Advanced Engineering Technology, Vol. 3, Issue 2, 2012, p. 4-12.
-
Lebold M., McClintic K. Review of vibration analysis methods for gearbox diagnostics and prognostics. Proceedings of the 54th Meeting of the Society for Machinery Failure Prevention Technology, Virginia Beach, VA, Vol. 1, Issues 4-2000, 2000, p. 623-634.
-
Wang W. Early detection of gear tooth cracking using the resonance demodulation technique. Mechanical Systems and Signal Processing, Vol. 15, Issue 5, 2001, p. 887-903.
-
Ghasemloonia A. Gear tooth failure detection by the resonance demodulation technique and the instantaneous power spectrum method – a comparative study. Shock and Vibration, Vol. 18, Issue 3, 2011, p. 503-523.
-
Cousinard O., Marconnet P. Détection de l’endommagement d’un engrenage par l’emploi de l’analyse cepstrale et de la détection d’enveloppe application et validation industrielles pour le diagnostic d’un réducteur fonctionnant à faible vitesse. 16th Congrès Français de Mécanique, Paris, 2003, (in French).
-
Merzoug M., Miloudi A. Diagnostic des transmissions par engrenages double étages via l’analyse d’enveloppe. 18th Congrès Français de Mécanique, Grenoble, 2007, (in French).
-
Hui L., Yuping Z., Haiqi Z. Gear fault detection and diagnosis under speed-up condition based on order cepstrum and radial basis function neural network. Mechanical Science and Technology, Vol. 23, Issue 10, 2009, p. 2780-2789.
-
Chaari F., Fakhfakh T., Haddar M. Simulation numérique du comportement dynamique d’une transmission par engrenages en présence de défauts de dentures. Mécanique and Industries, Vol. 6, Issue 6, 2005, p. 625-633, (in French).
-
Safizadeh M. S., Lakis A. A., Thomas M. Gear fault diagnosis using time-frequency methods. Compte Rendu du 20th Séminaire en Vibration de Machines, Vibration Québec – Canadian Machinery Vibration Association, Vol. 7, Issue 19, 2002, p. 7-29.
-
Enayet B. H., Sirish L. S., Ming J. Z., Houkat Choudhury M. A. A. Fault detection of gearbox from vibration signals using time-frequency domain averaging. Proceedings of the American Control Conference, Choudhury, 2006, p. 4430-4435.
-
Endo H., Randall R. B. Enhancement of autoregressive model based gear tooth fault detection technique by the use of minimum entropy deconvolution filter. Mechanical Systems and Signal Processing, Vol. 21, Issue 2, 2007, p. 906-919.
-
Jing L., Liangsheng Q. U. Feature extraction based on Morlet wavelet and its application for mechanical fault diagnosis. Journal of Sound and Vibration, Vol. 234, Issue 1, 2000, p. 135-148.
-
McDonald G. L., Zhao Q., Ming J. Z. Maximum correlated Kurtosis deconvolution and application on gear tooth chip fault detection. Mechanical Systems and Signal Processing, Vol. 33, 2012, p. 237-255.
-
Millioz F., Martin N. Circularity of the short-time Fourier transform and Spectral Kurtosis for time-frequency segmentation in Gaussian environment. Transactions on Signal Processing, Vol. 59, Issue 2, 2011, p. 515-524.
-
Antoni J. The spectral Kurtosis: a useful tool for characterizing non-stationary signals. Mechanical Systems and Signal Processing, Vol. 20, Issue 2, 2006, p. 282-307.
-
Dwyer R. F. Detection of non-Gaussian signals by frequency domain Kurtosis estimation. Proceedings of the International Conference on Acoustic, Speech and Signal Processing, Boston, Vol. 8, 1984, p. 607-610.
-
Antoni J., Randall R. B. The spectral Kurtosis: application to the vibratory surveillance and diagnostics of rotating machines. Mechanical Systems and Signal Processing, Vol. 20, Issue 2, 2006, p. 308-331.
-
Antoni J. Fast computation of the Kurtogram for the detection of transient faults. Mechanical Systems and Signal Processing, Vol. 21, Issue 1, 2007, p. 108-124.
-
Chaari F., Fakhfakh T., Haddar M. Simulation numérique du comportement dynamique d’une transmission par engrenages en présence de défauts de dentures. Mécanique and Industries, Vol. 6, Issue 6, 2005, p. 625-633, (in French).
-
Ebrahimi S., Eberhard P. Rigid-elastic modeling of meshing gear wheels in multibody systems. Multibody System Dynamics, Vol. 16, 2006, p. 55-71.
-
Choy F. K., Polyshchuk V., Zakrajsek J. J. face pitting and wear on the vibration of a gear transmission system. Tribology International, Vol. 29, 1996, p. 77-83.
Cited by
About this article

