Abstract
It is hard to diagnose the rolling element bearing fault occurring in gearbox due to the complexity and the probable mutual coupling among the kinds of signals. A novel diagnosis method of rolling element bearing fault arising in gearbox based on morphological component analysis (MCA) originating from sparse representation theory is proposed in the paper. By selecting proper dictionaries, different morphological components can be separated successfully from the complex rolling fault signal arising in gearbox, which helps to improve the efficiency and accuracy of diagnosis result. The effectiveness of the proposed method is verified through simulations firstly. Then the proposed method is used in fault feature extracting of complex vibration signals collected from rotating machinery, and the effectiveness of the proposed method is further verified. Besides, the advantage of the proposed method over other relative method is presented.
1. Introduction
It is meaningful to extract the fault feature of rolling element bearing effectively because the rolling bearing is one of the most commonly used and easily damaged mechanical components. In recent years, various signal processing techniques have been developed to extract the fault features of machinery. Traditional statistical features on time series are usually used to monitor machinery condition [1, 2]. Frequency domain method can identify frequency structure of signal, and it’s widely used in gearbox signal analysis [3, 4]. After analyzing the shortcomings of current feature extraction and fault diagnosis technologies of rolling bearing, the wavelet packet decomposition and empirical mode decomposition were combined in paper [5] to extract fault feature frequency, and the extracted feature was used as the input of neural network. At last the rotating machinery’s early fault was diagnosed successfully. A new bearing fault diagnosis method named cyclic spike detection method was proposed to extract the features of bearing’ weak fault [6]. Two multi-component signal mixtures, including a simulated signal and a real vibration signal collected from an industrial machine were used to validate the effectiveness of the proposed method. The results demonstrated that the proposed method can extract the bearing weak fault features from other strong masking vibration signals and noise. The minimum variance cepstrum (MVC) was used to detect the early fault in automotive ball bearing and the experiment results demonstrated that MVC could determine bearing fault periods more clearly than other methods under the given condition [7]. The discrete wavelet transform (DWT) and artificial neural network (ANN) were combined to diagnose gear box incipient fault in paper [8]. The extracted features from DWT were used as the inputs of a neural network for classification purposes. The results showed that the developed method can diagnose different conditions of the gear box reliably. Q. Hai et al. compared the performance of wavelet decomposition-based de-noising method and wavelet filter-based de-noising method based on signals collected from mechanical defects [9]. The comparison results revealed that wavelet filter-based de-noising method is much more suitable and more reliable to detect a weak signature of mechanical impulse-like defect signals, whereas the wavelet decomposition de-noising method can achieve satisfactory results on smooth signal detection. Aiming at the difficulty of early weak impulse fault feature extraction of rolling bearings, an integrated algorithm based on resonance demodulation method and entropy threshold de-noising of wavelet packet coefficients was proposed to determine the resonance modulation bands resulted by early weak impulse faults signals accurately [10]. The validity and practicability of the proposed method in feature extraction of rolling bearing’ early weak impulse fault were proved through experiment.
MCA based on sparse decomposition uses basic pursuit to separate the signal components by utilizing multiple dictionaries [11]. The assumption about MCA lies that each dictionary is efficient in sparsely representing one component but being highly inefficient in representing others. MCA has many successful applications on image processing [12, 13] and source separation [14, 15]. Vibration signal usually contains complex components from different sources, and these components are always morphologically different. By separating components from vibration signal using MCA method, fault related signal can be distinguished from the rest parts.
The paper is organized as follows. Section 2 is dedicated to sparse representation and MCA. Section 3 is simulation verifying the effectiveness of the proposed method. In Section 4 the experimental analyzed results of rolling element bearing fault arising in gearbox are presented. In Section 5, the analyzed experimental results using independent component analysis (ICA) as comparison are presented and the advantages of the proposed method are verified. Conclusions obtained from the above results are given in Section 6.
2. Morphological component analysis based on sparse representation
2.1. Sparse representation
Mallat and Zhang put forward the idea of decomposing signal which aims to seek the sparsest or nearly-sparsest representations of signal basing on particular over-complete dictionaries [21]. The over-complete dictionary taking wavelet dictionary, Gabor dictionary and so on for example is over-complete which is composed of number of atoms. The sparse mode means representing the original signal using atoms as few as possible:
In the above equation, is the analyzed discrete-time signal, is a redundant dictionary which can span the entire Hilbert space . If , the can be defined as over-complete dictionary. The coefficients for each atom are represented as .
For the reason of over-completeness, there are numerous methods for the solution of in Eq. (1). The preference is made towards the one with the minimum norm among the numbers of methods. The sparse decomposition is determined by:
The minimization of norm in Eq. (2) is a NP-hard problem which is difficult to solve. Therefore, alternative solutions such as MOF (Method of Frame), MP (Matching Pursuit) and BP (Basis Pursuit) are proposed based on different strategies. MOF chooses the composition with minimum norm of coefficients. BOB finds the orthogonal basis by minimizing the entropy measure of coefficients. MP selects atoms through a stepwise greedy approximation algorithm. BP selects the representation with minimum norm. Compared with other algorithms, BP has advantages of better sparseness and accuracy, but suffers from slower computation speed. The comparison of the main sparse decomposition algorithms is shown in Table 1.
Table 1Comparison of sparse decomposition algorithms
Algorithms | Sparseness measurement | Sparseness of the solution result | Calculation speed | Accuracy |
CM | Optimal | Very slow | Very good | |
BP | Very good | Slow | Very good | |
MP | Sub or local optimal | Good | Moderate | Good |
FOCUSS | , | Very good | Slow | Very good |
MOF | Not good | Very fast | Poor | |
IPM | Sub or local optimal | Good | Fast | Moderate |
BOB | Sub or local optimal | Good | Fast | Moderate |
2.2. Over-complete dictionary
It is very important to select or construct reasonable over-complete dictionaries to obtain the representation of the analyzed signal as sparse as possible besides the sparse solution algorithms discussed above. The selection of proper over-complete dictionary plays an important role in sparse representation. The structure of atoms must be similar to the main components of a signal. Only by selecting proper dictionary, the signal can be represented with a few atoms. Otherwise, the signal can’t be reconstructed with a sparse and succinct representation form.
Generally speaking, the over-complete dictionary can be divided into two categories: the first category is named as analysis dictionary such as Dirac dictionary, Fourier dictionary, wavelet dictionary, Gabor dictionary, Chirplet dictionary and the atomic structure of them is fixed. The second category is called self-learning dictionary based on some training algorithms. The methods of optimal directions (MOD), K-SVD and so on are the common used training algorithms.
2.3. The construction of over-complete dictionaries for sparse decomposition of gear and bearing fault signals
According to the dynamic model of fixed-axis gear system, its vibration equation can be expressed by [16]:
where is the gear vibration, is the meshing frequency, is the amplitude of vibration, is the phase. and is the modulation function, is the random noise. and are the amplitude and phase modulation factors. is the rotating frequency. is the order. and are the initial phase angles.
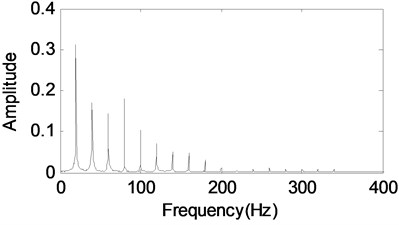
Set the parameters in the gear model, and the time-domain and frequency-domain waveforms are shown in Fig. 1(a) and (b). Based on Fig. 1, the main components of gear vibration signal are cosines. So, the cosine packet over-complete dictionary is used for analysis of gear vibration signal.
Fig. 1Simulated signal of fault gear
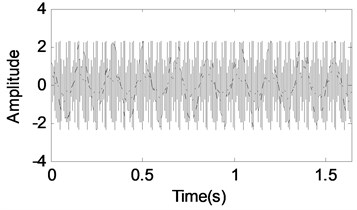
a) Time-domain waveform
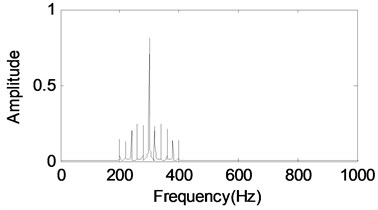
b) Frequency-domain waveform
Using the rolling bearing fault mode whose mathematical model [17, 18] is expressed in equation (4). is the tiny fluctuation around mean period :
Set the parameters in the bearing fault model, and the time-domain and frequency-domain waveforms are shown in Fig. 2(a) and (b). Based on Fig. 2, the main components of bearing fault vibration signal are impulses. The symmlet8 wavelet packet is taking on impulse characteristic, so the symmlet8 wavelet packet dictionary is a good candidate for bearing fault signal impulse extraction.
Fig. 2Simulated signal of rolling element bearing
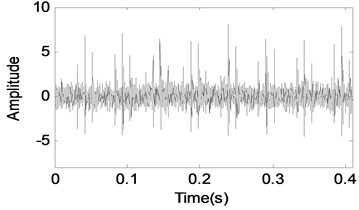
a) Time-domain waveform
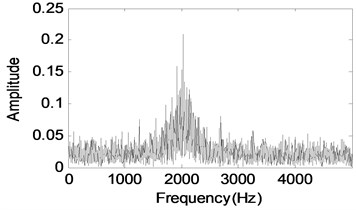
b) Frequency-domain waveform
2.4. MCA using multiple dictionaries
Morphological component analysis can decompose a signal into its building parts. Assume that the signal is a linear combination of components , , where represents each type of signals to be decomposed. The MCA model also assumes that a possibly over-complete dictionary exists for each , in which each component admits a sparse representation while its decomposition over other is non-sparse. Ideally, the MCA model can be described as follows:
This optimization task is likely to lead to a successful separation of the signal. This expectation relies on the assumption made earlier about the over-complete dictionary being efficient in sparsely representing and being highly inefficient in representing other components.
The minimization of norm in Eq. (5) is still a non-convex optimization problem and difficult to solve. So, the norm is used in the optimization problem. In addition, due to additive noise or model dis-match, signal will generally not decompose cleanly into components. We propose the alternative optimization problem by relaxing the constraint as follows:
The signal can be decomposed into signal-plus-residual with sparse representation:
where , and . The residual is controlled by the parameter . For an exact representation of the data, must be set to zero. But when noise is contained in data, should be set to few times the noise standard deviation . Assuming the dictionary is normalized, we usually set , where is the cardinality of the dictionary.
Considering that the dictionary is over-complete, storing and manipulating coefficients requires large memory. We can obtain a simplified optimization problem:
where ; is Moore-Penrose pseudo-inverse matrix. The optimization problem above can be used to solve each component directly, which helps to reduce the computational complexity and save the computer memory.
The optimization problem in Eq. (8) is still complex to solve. By using Block Coordinate Relaxation (BCR) method [18], the above optimization problem can be replaced by a sequence of easier problems. Assuming that are all known, we can get a simplified task as:
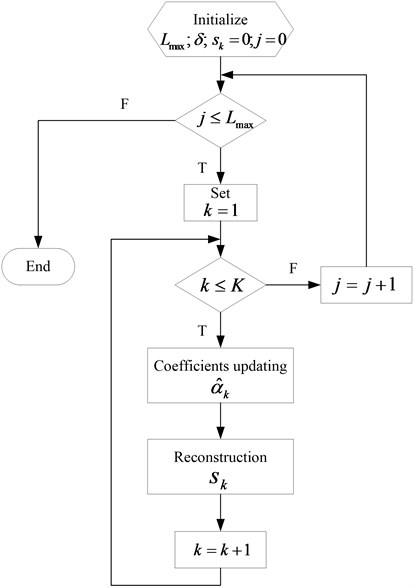
Here, an iterative thresholding algorithm is proposed to update coefficients, using a threshold which decreases linearly towards zero with iterations. As displayed in Fig. 3, the MCA algorithm based on BCR is as follows:
(1) Initialize the number of iterations and threshold .
(2) Perform times:
For :
– Calculate the residual ;
– Calculate the coefficients ;
– Threshold the coefficients with the threshold and obtain ;
– Reconstruct component by .
(3) Update the threshold exponentially.
(4) If , return to Step (2). Else, finish.
In Step (2), a hard threshold towards the end of the iterative process may lead to better results compared with soft threshold, which is given by:
Fig. 3The flowchart of MCA algorithm based on BCR
3. Simulation
The study focus of the paper is the performance of MCA in separating the collected signal from gearbox which containing both gear vibration and fault rolling element bearing vibration. The simulation vibration signal can be represented by the time-domain addition of Eq. (3) and Eq. (4) as following:
Set the sampling frequency as 10 kHz, and the parameters of rolling element bearing inner fault are set as follows: the rotating frequency 50 Hz, the natural frequency 2 kHz and the inner race frequency 96 Hz. The parameters of gear vibration are set as follows: the moderating frequencies of the amplitude moderated and frequency moderated are , 2, 3, 4 and 5, and the corresponding moderating coefficients are 1, 0.8, 0.7, 0.6, 0.5.
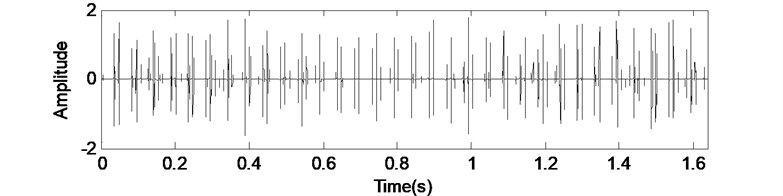
The time-domain waveforms of the gear vibration and rolling element bearing inner fault vibration are shown in Fig. 4(a) and (b). Fig. 4(c) is the random white noise, and the combined signal of (a), (b) and (c) is shown in Fig. 4(d).
Envelope analysis based on Hilbert transformation is used for demodulation, which is usually used to extract fault characteristic frequencies in vibration signal.
Hilbert transformation of a real signal is defined as:
Fig. 4Simulated signal of fault gearbox
a) Time-domain waveform of gear
b) Time-domain waveform of rolling element bearing inner race fault
c) Random white noise
d) Combined signal
The analytical signal is defined as the combination of and its Hilbert signal as:
The envelope of the given signal is defined as:
By performing FFT on the envelope , we can obtain the envelope spectrum of the given signal. Fault characteristic frequencies in this envelope spectrum can indicate machinery fault features.
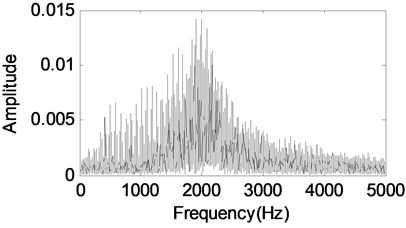
Apply envelope demodulation spectrum to the signal shown in Fig. 4(d) and the analyzed result is given in Fig. 5 from which the inner race fault characteristic frequency could not be extracted.
Fig. 5The envelope demodulation spectrum of the signal shown in Fig. 4(d)
Fourier dictionary is effective in analyzing harmonic components, and the symmlet8 wavelet packet atoms can match the bearing fault model well as the above stated. So, these two types of dictionaries are exploited to extract gear vibration and bearing fault vibration.
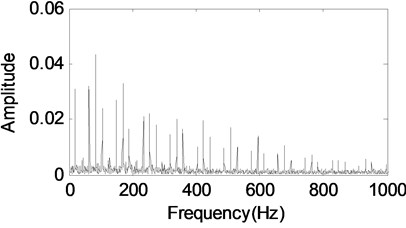
Two components are extracted from the raw signal after using MCA method. The first component in Fig. 6(a) which is reconstructed with the Fourier dictionary. It can be defined as the gear vibration signal. Its PSD estimation gives a detailed frequency structure in Fig. 6(b). We can clearly see the gear meshing frequency and its sidebands. In Fig. 6(c), the envelope demodulation spectrum of the extracted signal shown in Fig. 6(a) is given, and the main components of spectrum structure are rotating frequency with its harmonics.
Fig. 6Gear signal separated by MCA
a) The separated gear signal using MCA
b) The fft of the signal shown in Fig. 6(a)
c) The envelope demodulation spectrum of the signal shown in Fig. 6(a)
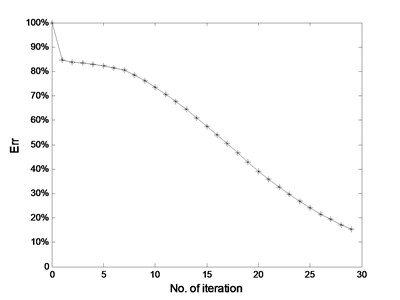
The second separated component in Fig. 7(a) which is reconstructed with the Symmlet8 wavelet packet dictionary. It identifies transient features from rolling element bearing inner race fault. Its fft and envelope analysis are presented in Fig. 7(b) and (c). The inner race fault feature frequency and its harmonics are extracted successfully based on Fig. 7(c). Besides, the moderating frequency (rotating frequency) is also extracted. Much better separated results will be obtained if updating the threshold exponentially as shown the step 3 in Fig. 3 [19], and the Fig. 8 shows the threshold value decreases exponentially. Fig. 9 shows that the residual error decreases quickly with the number of iteration.
Fig. 7Bearing inner race fault signal separated by MCA
a) The separated rolling element bearing inner race fault signal using MCA
b) The fft of the signal shown in Fig. 7(a)
c) The envelope demodulation spectrum of the signal shown in Fig. 7(a)
Fig. 8Threshold updating with an exponential method
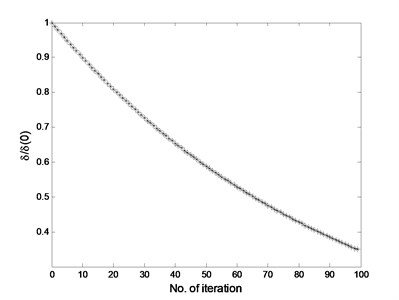
Fig. 9The residual error for reconstructed signal using MCA
The simulation example shows that different components can be extracted successfully from vibration signal collected for gearbox by selecting proper dictionaries, which offers a potential way to detect machinery fault arising in gearbox.
4. Experiment
The experimental gearbox test rig is shown in Fig. 10. During the test, the motor speed is adjusted by the inverter control. The magnetic power brake is used to adjust the load. The gearbox is a single stage transmission, and the two shafts of the gear box are supported by four rolling bearings of the same type of NSK#1302.There are four acceleration sensors and one data acquisition card USB9234 in the data acquisition system. The programming of data acquisition software is realized by National Instruments LabView. The transmission structure and the arrangement of measuring points are shown in Fig. 11.
The inner race of the 2nd measuring point bearing is processed pitting failure using EDM (Electron Discharge Machining) in the experiment, and the other three measuring points of the bearings are normal. The pitting failure is located in the inner race of the test bearing and the size of the failure is 1 mm×1 mm. The sampling frequency is 44.1 kHz, and the rotation frequency of the input shaft is 100/6 Hz. As can be seen from Fig. 1, the transmission ratio is 39/28, and the gear modulus is 2. The rated power of variable frequency of motor is 0.55 kw. The geometric parameters of the fault bearing are shown in Table 2, and the relationship of the theoretical characteristic frequencies of the fault bearing and the rotation frequency are shown in Table 3.
Fig. 10The test rig
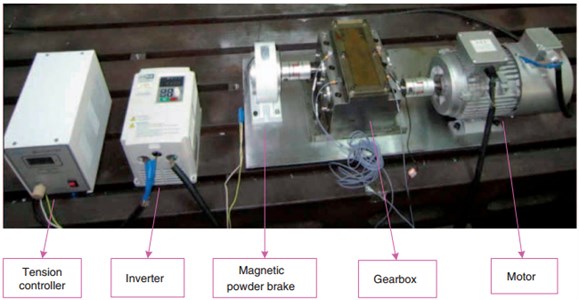
Fig. 11The structure of the transmissions and the layout of measuring points
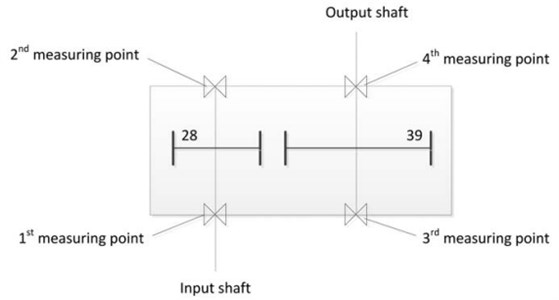
Table 2Geometrical parameters of bearing NSK#1302
Type | Number of balls | Ball diameters (mm) | Pitch diameter (mm) | Contact angle |
NSK#1302 | 10 | 6.2 | 27.5 | 9°00" |
Table 3Characteristic Frequency of test bearing 6023
Type | |||||
NSK#1302 | 16.6 | 6.5 | 38.8 | 103.9 | 64.8 |
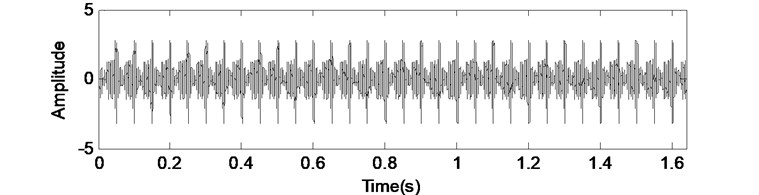
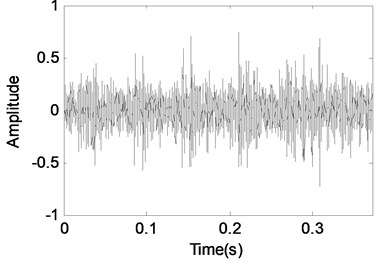
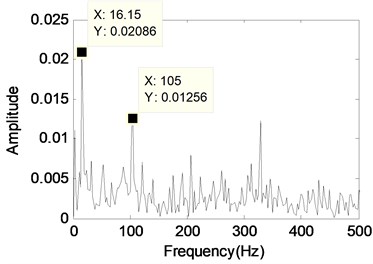
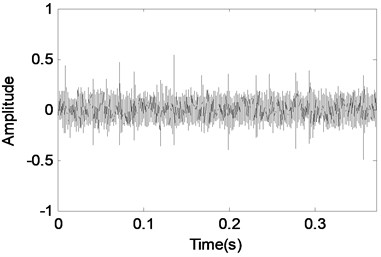
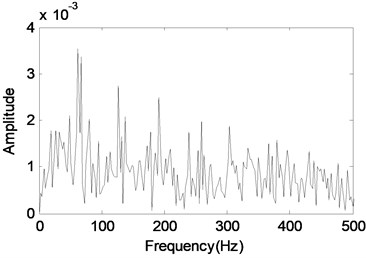
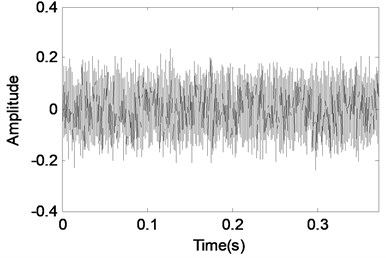
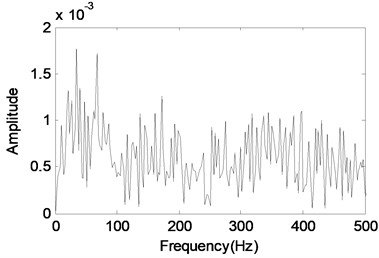
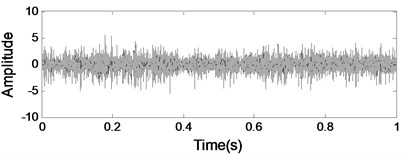
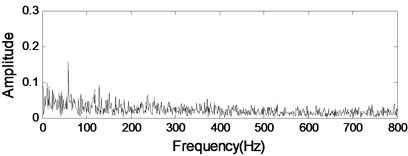
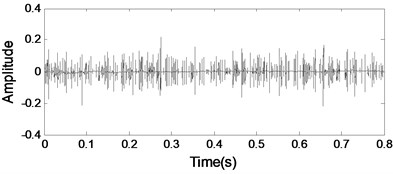
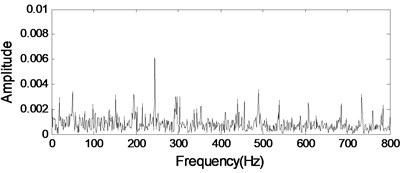
The time-domain waveform and the envelope spectrum of the fault signal are shown in Fig. 12(a) Fig. 12(b). We could not identify the bearing fault basing on Fig. 12(a) because the impulse characteristic is buried in the strong background noise. In the Fig. 12(b), the spectrum lines of the spectrum are very chaotic, which could not reflect the fault characteristic information. By the above analysis results, although the acceleration sensor is so close to the fault bearing, using the traditional signal processing methods could not effectively extract the bearing fault signal characteristics. The main reasons can be summarized as follows: the vibration signal of the gear box is complex which contains the gear meshing signal components, the vibration of shaft, the vibration of fault bearing and the vibration of the motor, etc. Therefore, it is very necessary and significant to further separate the signal of the gear box in order to better extract the fault characteristic signals.
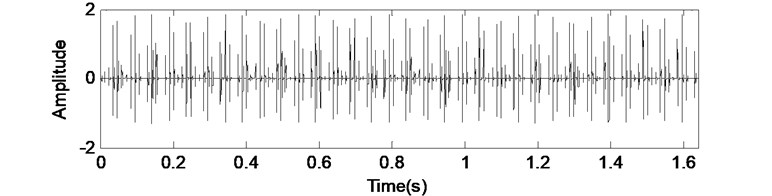
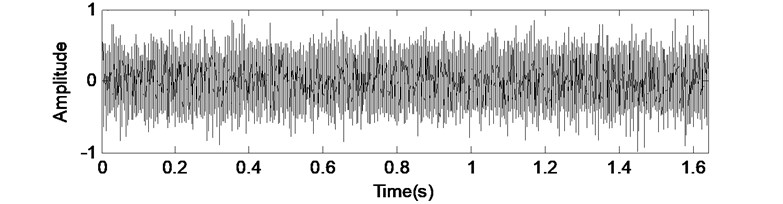
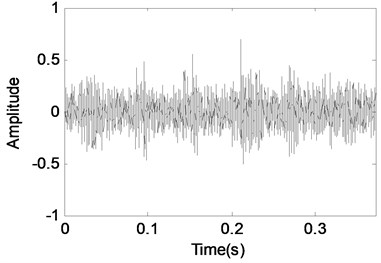
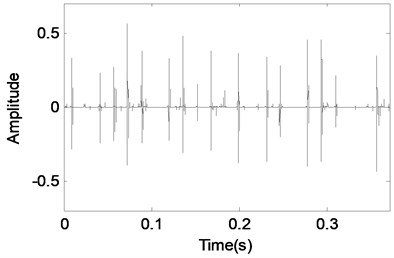
The analysis results of the experimental signal shown in Fig. 12(a) based on MCA are given. Same as the discussions in Section 2 and 3, the Cosine packet over-complete dictionary and Symmlet8 wavelet packet over-complete dictionary are used to match the gear vibration signal and bearing fault vibration signal separately. Besides, the updating of the threshold exponentially is also same as the Fig. 8. Two components are obtained after MCA analysis and their corresponding time-domain waveforms are shown in Fig. 12(c) and (e). The second component shown in Fig. 12(e) can be identified as the bearing fault vibration signal because it takes on impulse characteristic, and the characteristics of the second component shown in Fig. 12(c) is much close to the gear vibration signal.
Fig. 12MCA analysis of the gearbox signal with an inner race defect bearing
a) The time-domain waveform of the gearbox signal with an inner race fault bearing
b) The envelope demodulation spectrum of the signal shown in Fig. 12(a)
c) Component 1 separated using MCA
d) The envelope demodulation spectrum of the signal shown in Fig. 12(c)
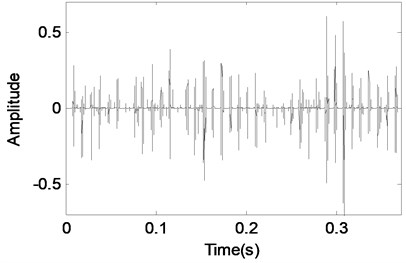
e) Component 2 separated using MCA
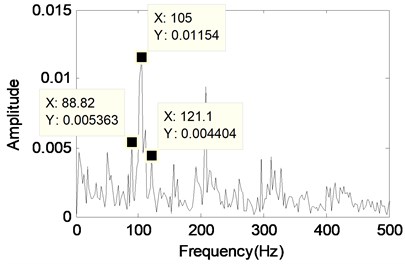
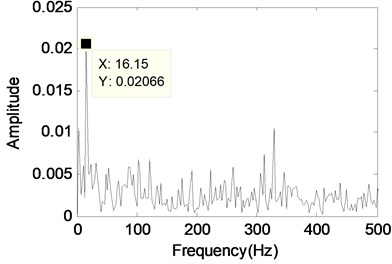
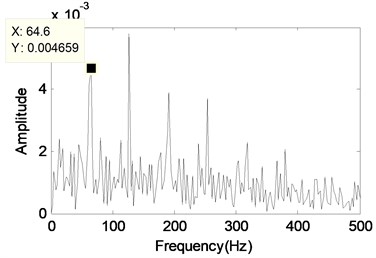
f) The envelope demodulation spectrum of the signal shown in Fig. 12(e)
The envelope demodulation spectrum analysis results of the two components are also given in Fig. 12(d) and (f) respectively in order to reflect the separated results much clearer. In Fig. 12(f) the values of spectral lines are mainly distributing on 105 Hz and its harmonics. It can judge the 105 Hz is bearing inner race fault characteristic frequency through comparison the fault characteristic frequencies shown in Table 2 (There exists 1.1 Hz error due to the manufacture and installation error). The effectiveness of MCA in separating gear vibration and bearing fault vibration signal is verified again through the above experimental signal analysis results.
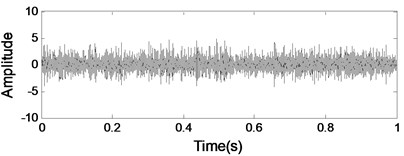
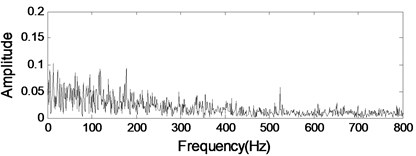
Same as the above experiment and analysis process, a bearing with an outer race fault is installed near the 2nd measuring point, the other three bearings are normal, and the corresponding analyzed results are given in Fig. 13. Though the envelope demodulation analyzed shown in Fig. 13(b) of the original fault signal shown in Fig. 13(a) can extract the outer race characteristic frequency roughly, the analyzed result shown in Fig. 13(f) is much better after MCA handling.
Fig. 13MCA analysis of the gearbox signal with an outer race defect bearing
a) The time-domain waveform of the gearbox signal with an outer race fault bearing
b) The envelope demodulation spectrum of the signal shown in Fig. 13(a)
c) Component 1 separated using MCA
d) The envelope demodulation spectrum of the signal shown in Fig. 13(c)
e) Component 2 separated using MCA
f) The envelope demodulation spectrum of the signal shown in Fig. 13(e)
5. Comparison
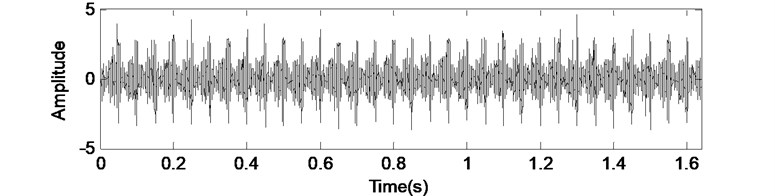
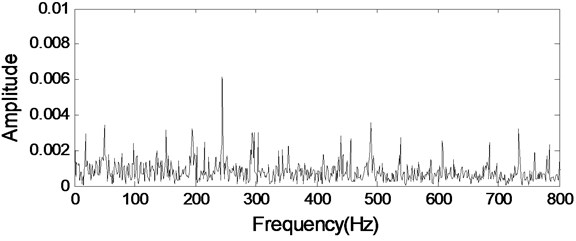
Independent component analysis is a well-known method for the blind source separation while assuming that the sources are statistically independent and non-Gaussian [20]. But ICA is unsuitable for underdetermined cases where sensors are less than sources. Therefore, it cannot separate multiple sources from only single-channel data. Here, the analysis results of the gearbox signal with an inner race fault bearing using ICA are given in Fig. 14 as comparison 1. Neither of them can detect bearing fault feature in gearbox signal.
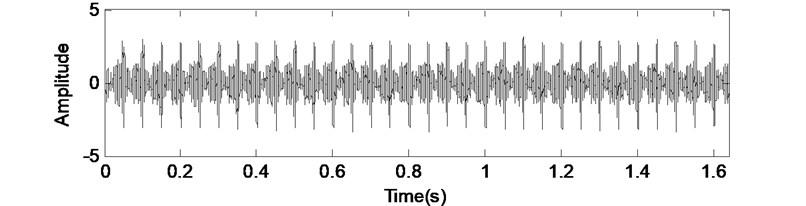
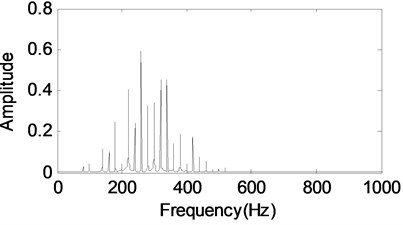
The analysis results of the gearbox signal with an inner race fault bearing using MP are given in Fig. 15 as comparison 2. Neither of them can detect bearing fault feature in gearbox signal same as the analysis results using ICA method.
Fig. 14Analysis result using ICA
a) Component I
b) Envelope analysis of Component I
c) Component II
d) Envelope analysis of Component II
Fig. 15Analysis result using MP
a) Component I
b) Envelope analysis of Component I
c) Component II
d) Envelope analysis of Component II
6. Conclusions
The principle and algorithm of MCA method basing on sparse representation theory is discussed in the paper, then the characteristics of proposed method is described by the simulation, and the separation different morphological constituents ability of the proposed method is verified through simulation and experiment. Besides, compared with other transformations such as FFT or wavelet, the MCA can represent a signal with much lesser atoms by using proper over-complete dictionary, which can capture the underlying signal structure and save storage.
With morphological diversity in dictionaries, MCA can separate a given signal into its additive components. It solves single channel blind source separation problem that ICA cannot deal with, and the comparison result of the proposed method with ICA is given at last. The advantage of the proposed method is verified furthermore.
References
-
Lybeck N., Marble S., Morton B. Validating prognostic algorithms: a case study using comprehensive bearing fault data. IEEE Aerospace Conference Proceedings, 2007, p. 1-9.
-
Xi F. F., Sun Q., Krishnappa G. Bearing diagnostics based on pattern recognition of statistical parameters. Journal of Vibration and Control, Vol. 6, 2000, p. 375-392.
-
Inalpolat M., Kahraman A. A theoretical and experimental investigation of modulation sidebands of planetary gear sets. Journal of Sound and Vibration, Vol. 323, 2009, p. 677-696.
-
McFadden P. D., Smith J. D. Explanation for the asymmetry of the modulation sidebands about the tooth meshing frequency in epicyclic gear vibration. Proceedings of the Institution of Mechanical Engineers Part C Mechanical Engineering Science, Vol. 199, 1985, p. 65-70.
-
Bin G. F., Gao J. J., Li X. J. Early fault diagnosis of rotating machinery based on wavelet packets-empirical mode decomposition feature extraction and neural network. Mechanical System and Signal Processing, Vol. 27, 2012, p. 696-711.
-
Wang D., Guo W., Wang X. J. A joint sparse wavelet coefficient extraction and adaptive noise reduction method in recovery of weak bearing fault features from multi-component signal mixture. Applied Soft Computing, Vol. 13, 2013, p. 4097-4104.
-
Park C. S., Choi Y. C., Kim Y. H. Early fault detection in automotive ball bearings using the minimum variance cepstrum. Mechanical Systems and Signal Processing, Vol. 38, 2013, p. 534-548.
-
Saravanan N., Ramachandran K. I. Incipient gear box fault diagnosis using discrete wavelet transform (DWT) for feature extraction and classification using artificial neural network (ANN). Expert Systems with Application, Vol. 37, 2010, p. 4168-4181.
-
Qiu H., Jay L., Lin J., Yu G. Wavelet filter-based weak signature detection method and its application on rolling element bearing prognostics. Journal of Sound and Vibration, Vol. 289, 2006, p. 1066-1090.
-
Cui L. L., Kang C. H., Xu Y. G., Gao L. X. Integrated algorithm research on early impactive fault feature extraction of rolling bearing. Chinese Journal of Scientific Instrument, Vol. 31, 2010, p. 2422-2427.
-
Starck J. L., Elad M., Donoho D. Redundant multiscale transforms and their application for morphological component separation. Advances in Imaging and Electron Physics, Vol. 132, 2014, p. 287-348.
-
Yang P. L., Fomel S. Seislet-based morphological component analysis using scale-dependent exponential shrinkage. Journal of Applied Geophysics, Vol. 118, 2015, p. 66-74.
-
Wen J., Zhao J. S., Wang C. L. Improved morphological component analysis for interference hyperspectral image decomposition. Computers and Electrical Engineering, Vol. 46, 2015, p. 394-402.
-
Bobin J., Moudden Y., Starck J. L., Elad M. Morphological diversity and source separation. Signal Processing Letters, IEEE, Vol. 13, 2006, p. 409-412.
-
Bobin J., Starck J. L., Fadili J., Moudden Y. Sparsity and morphological diversity in blind source separation. IEEE Transactions on Image Processing, Vol. 16, 2007, p. 2662-74.
-
Wang Y. C., Xie M., Ding K. Envelope analysis technique and its application in the gear failure vibration diagnosis. Journal of Chongqing University (Natural Science Edition), Vol. 18, 1995, p. 87-91.
-
Antoni J., Bonnardot F., Raad A., Badaoui M. E. Cyclostationary modeling of rotating machine vibration signals. Mechanical System and Signal Processing, Vol. 18, 2004, p. 1285-1314.
-
Randall R. B., Antoni J., Chobsaard S. The relationship between spectral correlation and envelope anlysis in the diagnostics of bearing faults and other cyclostationary machine signals. Mechanical Systems and Signal Processing, Vol. 15, 2001, p. 945-962.
-
Bruce A. G., Sardy S., Tseng P. Block coordinate relaxation methods for nonparamatric signal denoising. Proceedings of the Aerospace/Defense Sensing and Controls, 1998, p. 75-86.
-
Ajami A., Daneshvar M. Data driven approach for fault detection and diagnosis of turbine in thermal power plant using independent component analysis (ICA). Electrical Power and Energy Systems, Vol. 43, 2012, p. 728-735.
-
Mallat S. G., Zhang Z. Matching pursuits with time-frequency dictionaries. IEEE Transactions on Signal Processing, Vol. 41, 1993, p. 3397-3415.
Cited by
About this article

The author(s) disclosed receipt of the following financial support for the research, authorship, and/or publication of this article: the research is supported by the Program for Science and Technology Innovation Talents in Universities of Henan Province (China) (approved Grant: 164200510004, 17HASTIT028) and the National Nature Science Foundation (China) (approved Grant: 51405453, 51205371)
