Abstract
Increased requirements regarding safety, reliability and early detection of failures of industrial machines stimulate the development of new methods and tools for purposes of condition monitoring. The paper presents original concept of the Teager-Kaiser energetic trajectory representing an examined signal on the Teager-Kaiser energy plane. The Teager-Kaiser energetic trajectory illustrates simultaneously changes of instantaneous values of the Teager-Kaiser energy indicator and the velocity of change of the energy indicator. At the beginning of the paper, the Teager-Kaiser energetic trajectory is presented and described followed by examples of trajectories of simulated signals. In the next section, the author presents and discusses the model of signal simulating occurrence of a failure in a gearbox. Finally, the paper presents representations of signals recorded form gearbox during fatigue tests. The paper concludes with the discussion on application options of the Teager-Kaiser energetic plane in condition monitoring of rotation machinery.
1. Introduction
A failure of an industrial machine or a civil engineering structure can result in high environmental costs as well as in casualties and fatalities. As a result, there is a constant pressure on research and development of reliable techniques for detection of technical condition of systems. Among various research activities one can recall: the use of new techniques of signal processing [1-3], the application of new measurement strategies [4, 5] such as sensors embedded in structure [6] or the use of different physical phenomena for the detection of early stages of failures [7-10].
The emergence and development of a failure in a component of a machine result in the change of energetic structure of a vibro-acoustic signal generated during operation [3, 7, 9]. In particular, this change is related to the disturbance of amplitude and frequency structure of the signal [9, 11] which can be considered as diagnostic symptoms. Usually symptoms related to early phases of failure development cause a low-energetic change in the signal. The detection of such low-energetic symptoms in diagnostic signal is a difficult task due to the noise and overlap of vibrations from different sources. However, if the failure is correctly identified, it is possible to monitor its further development and to choose the optimal maintenance strategy and obtain notable savings.
Bearings and gearboxes are the most common components of almost all machines. There is a wide variety of types of gearboxes, but the most basic mechanisms of toothed wheels damage are: the fatigue break of tooth and the pitting [12, 13]. The detection of diagnostic information (the symptoms) concerning failure requires the use of suitable signal processing and analysis techniques. There is a wide range of signal analysis methods among which the most popular are:
– methods based on the analysis of average measures of signals e.g.: RMS, kurtosis [14];
– methods based on analysis of modulation phenomena [15-17];
– methods based on spectrum analysis [18], time-frequency and wavelets [19-23].
In the literature [3] it is pointed out that the main disadvantage of methods mentioned above is the use of integration operators in the process of searching of diagnostic information. The integration operators cause averaging of signals which can lead to the loss of diagnostic information about the early symptoms of failures. At present, research is focused on the development of differential methods. These methods are supposed to be sensible to transient disturbances, appearing in the diagnostic signal, which are related with early-phases of failures. The analysis of envelope contact factor [3] or the analysis of Teager-Kaiser energy of signal [24, 25] are examples of such methods.
In this paper, the author presents the concept of Teager-Kaiser energetic plane which, with the use of Teager-Kaiser energy operator, represents an examined signal in the form of the energetic trajectory. The energetic trajectory illustrates simultaneous changes of instantaneous values of the energy indicator and the velocity of change in the value of energy indicator. The Teager-Kaiser energetic trajectory is an innovative tool of representing a signal which allows the detection of disturbances related to diagnostic symptoms in the energetic structure of the signal. The presentation of the Teager-Kaiser energetic plane is supported by examples of the trajectories of simulated signals and the discussion of results.
2. Teager-Kaiser energetic plane
The idea underlying the creation of the Teager-Kaiser energetic plane was the hypothesis that the emergence and development of a failure affect the energetic structure of a signal resulting in the occurrence of disturbances characterized by high values of the energy as well as high velocity of change of energy. The motion of components not disturbed by failure can be described by harmonic functions while failure introduce effects of changes of amplitude or/and phase. Symptom of emergence of failure is disturbance of oscillatory motion resulting from disturbance of mating of machine components. The one can analyze those effects using classical well established integral operators such as Hilbert transform or to analyze the signals energy – dose it grows and how fast this growth occurs. The change of the energy caused by early and low-energetic stage of failure can shift the energy not much while the energy itself will be changing rapidly due to nonlinear phenomena related with failure. Taking in to account the energy and its velocity of change, the failure can be not only detected but also its stage of development can be followed. Considering two events causing the same change of the energy, the one of them which is characterized by more rapid changes (increase and decrease) of the generated energy seems to be more significant than other. More likely the event with high velocity of change of the energy will be the one leading to faster development of degradation process.
Taking into account both measures, i.e. the energy and the velocity of energy, it is possible to determine the significance of observed phenomena. The application of the Teager-Kaiser energy operator [24-29] to calculate the energy of signals is related to its ability to detect changes appearing in the amplitude and frequency structure of the signal. Even a small and transient variation of the value of the amplitude or the frequency of the signal will cause corresponding change in energy indicator waveform .
The Teager-Kaiser energetic plane is defined by canonical coordinates: – the energy indicator of the signal and – the velocity of change of energy indicator of the signal , both calculated with the use of the Teager-Kaiser energy operator . For a given time signal , and simultaneously presented on the energetic plane create trajectory called the Teager-Kaiser energetic trajectory or shortly the energetic trajectory.
The Teager-Kaiser energy operator was first presented in [26, 28]. The definition of equations for for continuous time and discrete signals can be found in [24-26]. The Teager-Kaiser energy operator for continuous time signals is defined as Eq. (1):
where: is continuous time signal and is Teager-Kaiser energety operator. As a result of acting TKEO on signal under consideration its energy indicator is obtained in form of continuous time waveform. For discrete signals TKEO is given by following Eq. (2):
where: is th sample discrete signal.
In [25] authors presented higher order differential energy operators among which, the third-order differential energy operator calculates energy velocity of continuous time signal Eq. (3):
As a result of acting on signal the velocity of change of energy indicator is obtained.
However, presented in [25] discrete-time version of the third-order equation differential energy operator Eq. (4) is incorrect resulting in incorrect values and erroneous shape of expected waveform of the energy velocity:
Therefore, for the calculation of the it is necessary to use one of the numerical methods for the calculation of the derivative of a signal or equation such as Eq. (5):
The reader might sense some similarity between the concept of the Teager-Kaiser energetic plane and the phase plane [30]. However, it must be pointed out that the representation of analyzed signals on plane is a significantly different approach from the phase plane.
The next section presents examples and discussion of energetic trajectories of signals with different types of modulations and signals generated by a model simulating the occurrence of a failure in the gearbox.
3. Energetic trajectories of signals with modulations
The trajectory of a signal on the Teager-Kaiser energetic plane presents simultaneous changes of and . As a result, signals with different parameters, for example modulation parameters, will have different trajectories. Additionally, due to the sensitivity of the Teager-Kaiser energy to transient events, the energetic trajectory can be used for the detection of changes of modulation parameters of a signal with amplitude-frequency structure.
The figures below (Figs. 1-5) present trajectories of simulated signals. Due to this, no units are presented on axis of and . Fonts in the used calculation software did not allow to inscribe symbol, the axis of are marked as “energy ” and the axis of are marked as “velocity of change of energy ”.
In the case of the harmonic signal, modelled as:
where: – carrier amplitude, – carrier frequency, – initial phase;
due to the constant value of the amplitude and frequency of the signal, the signals energy is constant and its representation on the plane is a single point.
If during the duration of a signal its instantaneous value of amplitude or/and frequency changes, the Teager-Kiser energy waveform will also change. The figure below (Fig. 1) presents trajectories of signals with amplitude modulation (AM) modelled as:
For presentation reasons the following values of parameters were chosen: – carrier amplitude equal 2, – carrier frequency equal 500 Hz, – initial phase equal 0, – modulation depth equal: 0.05 or 0.1 or 0.5, – modulation frequency equal 25 Hz.
Fig. 1Energetic trajectories of AM signals with different values of modulation depth M
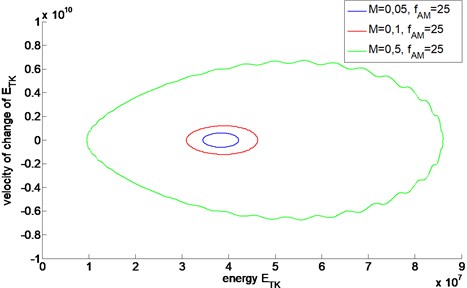
Although the trajectories have similar shapes, their magnitudes differ due to different values of the modulation depth . If a change in the technical condition of a machine manifested itself in the change of amplitude modulation, the energetic trajectory would be affected and manifest the change in the technical condition. The magnitude of the trajectory is related to the magnitude of modulation parameters: and .
The change of instantaneous frequency of the signal can be related to frequency modulation (FM). A change in of the frequency modulation index can be related to the operation abnormality of a machine component [31]. Fig. 2 presents a set of trajectories calculated for FM signals which differ in the value of index, only. The signals were modelled as:
The trajectories presented below (Fig. 2) where created with the following set of parameters: – carrier amplitude equal 2, – carrier frequency equal 500 Hz, – initial phase equal 0, – modulation index, for reason of example equal: 0, 5, 1 or 2, – modulation frequency equal 25 Hz.
Fig. 2Energetic trajectories of FM signals with different values of modulation index m
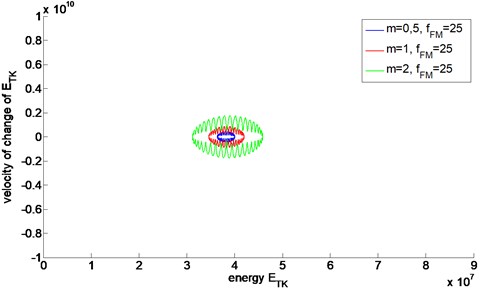
It can be easily seen that energetic trajectories of FM signals are significantly different from the ones calculated for AM signals. The main difference is the magnitude of the trajectory which is related to the energy of modulation phenomena. The second significant difference is the shape of the trajectory which is strictly related to the type of modulation. The representation of a signal with AM modulation on the energetic plane has an elliptic and rather smooth shape while the trajectory of a signal with FM modulation is strongly rippled vertically.
Most often, failures of machine components, such as gears or bearings, introduce amplitude-frequency modulation (AMFM) in a vibration signal [31]. The most common model of a signal with AMFM modulation is defined by the following equation:
Fig. 3 presents trajectories of signals with AMFM modulations of different parameters of the modulation depth and the modulation index. The signals’ energetic trajectories were calculated with values of the parameters the same as the ones used in AM and FM examples.
Fig. 3Energetic trajectories of AMFM signals with different value of M and m
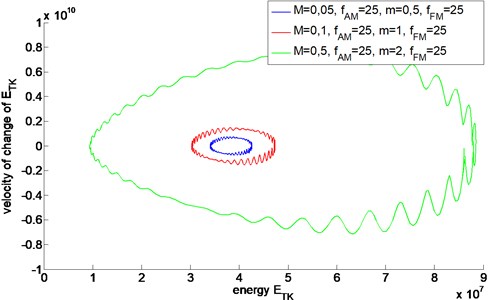
As the result of the amplitude-frequency modulation of a signal, the Teager-Kaiser energetic trajectory has the shape of superposition of the shapes characteristic for the AM and FM modulations. The modulation parameters and of the signal affect both the magnitude and shape of the energetic trajectory. Additionally, the shape of the trajectory can be affected by phase relationship between AM and FM modulations.
4. Influence of noise on representation of signal on Teager-Kaiser energetic plane
In the first publication on the TKEO Kaiser [24] pointed out that energy operator is sensitive to noise, especially wideband or one with large amplitudes compared to signal's amplitude. For signal contaminated with additive zero-mean uncorrelated Gaussian noise with variance the expected value of the output of TKEO is biased by the variance of the noise. As a solution, Kaiser suggested to perform low-pass filtration in order to reduce effects of the noise.
Since this time development of methods for suppressing noise became important task allowing extending applicability of TKEO. In [32] authors propose use of bank of band-pass filters to improve estimation of instantaneous frequency of signal with noise. Dimitriadis and Maragos [33] applied method using smooth splines to increase robustness of TKEO approach for identification of AM and FM components of a signal with AMFM modulation phenomena. In [34] authors evaluated cumulants and probability density functions and applied a three-point binomial filter at output of TKEO for separation of modulation components from signal with noise.
The quality of information carried by presented energetic trajectory depends on quality of analyzed signal. The signal should have as good as can be, meaning high signal to noise ratio (SNR) Eq. (10):
where: is variance operator, – noise-free signal, – noise.
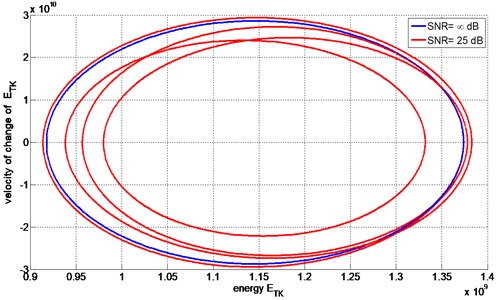
Increase of SNR can be achieved by filtration or synchronous averaging. To decrease disturbance of diagnostic information the signal should be band-pass filtered to the band of interest [35]. To analyze influence of additive zero-mean Gaussian noise on representation of amplitude modulated signal on energetic trajectory the noise with SNR 25 dB and 15 dB were added to the signal. Next contaminated signals were band-pass filtered using Gabor filter Eq. (11) [35]:
where is the center frequency of the band-pass filter, is the width of the filter.
From filtered signals energetic trajectories were calculated. Fig. 4 presents example of energetic trajectory for signal with SNR 25 dB and energetic trajectory of pure signal.
Deviations of the trajectory are caused by unfiltered noise however characteristic shape is kept. RMS value of relative error for signal with SNR equal 25 dB was 0.84 while for signal with SNR equal 25 dB was 1.26. Keeping in mind sensitivity of the Teager-Kaiser energy trajectory to noise, ensuring proper processing of diagnostic signal, the method might be useful diagnostic tool.
Fig. 4Example of energetic trajectories of AM signals with (SNR = 25) and without (SNR = ∞) noise contamination
5. Impact of signals transient disturbance on energetic trajectory
Next to the pitting, the fatigue break of tooth is one of most common causes of the damage of toothed wheels in the gearbox. The fatigue of the tooth is a fast developing process which usually leads to the entire break of the tooth. To analyze the impact of the emergence and the development of fatigue break of tooth on signals representation, the model Eq. (12) presented in [36] was used:
The function allows the model to describe phenomena of contact of teeth one of which has a lower stiffness then the other. It is assumed that this decrease of stiffness can result from fatigue break of a tooth. As the result of a local decrease of stiffness, in signal there appears transient and local disturbance in the modulation depth of the signal. For time instants corresponding to mesh of tooth following tooth with reduced stiffness, successive values of were calculated using the Gauss shape function and for all residual time moments value of was equal 0. As a result (Fig. 5), during duration of complete period of there appeared a single short time change in the resulting value of modulation depth ).
The damage, modelled as transient and local disturbance in modulation depth, causes a very small change in the signal. Practically it does not influence any average measures of signals such as RMS value, Crest Factor or kurtosis and based on them, the damage is undetectable. In mentioned measures 4 digit after coma was change or no change at all was observed. Also, spectrum of signal was not influenced by introduced local disturbance in modulation depth. However, comparing Teager-Kaiser energetic trajectory of signals, one without modulation depth disturbance ( for all ) and the other with modulation depth disturbance ( for specified ), resulting from a modelled damage, the change in the signal can be easily detected (Fig. 6). Significant divergence between trajectories appears for time instants moments of increased values of modulation depth.
Fig. 5Instantaneous values of modulation depth (M+MZ(t) of xAM Z(t) signal modelling local damage (two complete periods of signal)
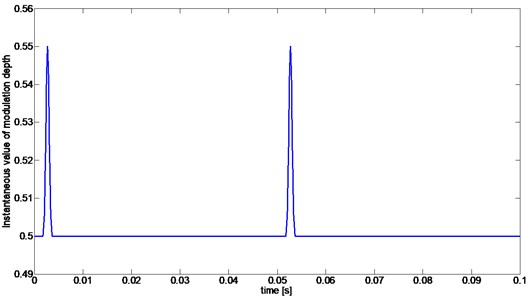
Fig. 6Overlay of the energetic trajectories of the signals with and without damage modelled as transient disturbance of modulation depth of the signal (two periods of the signals)
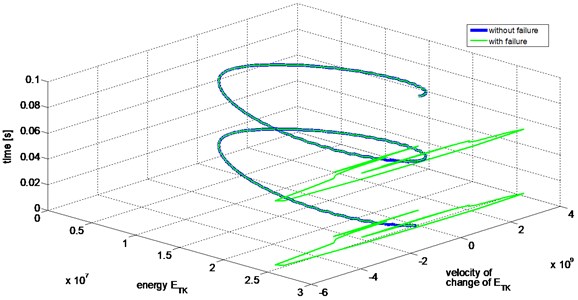
The magnitude of the modelled disturbance will influence the magnitude of its representation on the energetic plane. The shape of disturbance governed by mathematical model will also influence the representation. The sharper shape of the sharper its representation along both axis of the energetic plane.
6. Energetic trajectories of gearbox vibration signals
As mention before, fatigue break of tooth is next to pitting one of the most common degradation processed in gearboxes. Break of tooth can develop very fast and its early stage symptoms are difficult to detect with the use of standard measures.
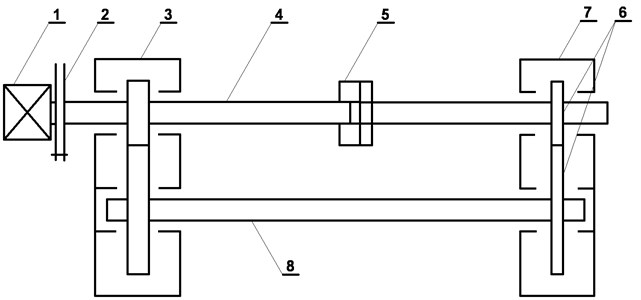
Vibration acceleration signals, recorded during diagnostic experiment of fatigue break of tooth, were analyzed in order to identify potentials and limitations of the energetic trajectories of real life signals. The experiment was conducted on a back-to-back tester (Fig. 7). This test stand allows for accelerated fatigue tests of gears.
Results presented below were obtained during a 72-minutes experiment. During the experiment, vibrations of gear housing synchronized with trigger signal from the induction sensor placed on the pinion shaft were recorded. The investigated gears were spur gears with 27 teeth in the pinion and 35 teeth in the gear. During the test the gears were loaded with a torque of ca. 1300 Nm generated by load clutch. The investigated gear pair had no artificial defects such as a notch, cut or crack. The experiment was conducted until a single pinion tooth was completely broken.
During the whole test, the signals were recorded continuously (without breaks) in 6 second data blocks. All in all, 718 data blocks were recorded. The Bruel&Kjaer 4504A vibration sensors and National Instruments NI-PXI 8186 measuring computer with NI-PXI 4472B DSA measuring card were used during the test. Sampling frequency was set at 25,6 kHz while the rotational frequency of the pinion shaft was ~25 Hz.
Fig. 7Diagram of the back-to-back tester (1 – motor, 2 – clutch, 3 – closing gearbox, 4 – pinion shaft, 5 – load clutch, 6 – gears under investigation, 7 – tested gearbox, 8 – shaft)
The records from the test could be assigned in general to three technical conditions. The first one could be referred to as fully operational (healthy), the second one as partly operational (intermediate) in which it was expected that the fatigue damage has already begun. The last one could be referred to as the condition of non-operation (failure), in which it was possible to detect symptoms of fatigue break of tooth such as the increase of Envelope Contact Factor (ECF) [37].
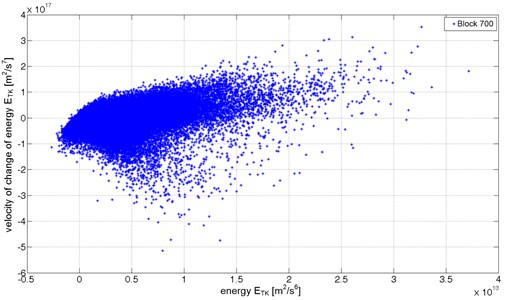
The figures below (Fig. 8 to 10) present energetic trajectories for selected recordings (6-seconds data blocks) from each of the technical conditions. The energetic trajectories, for readability reasons, are presented as a cloud of points, revealing the change in spatial distribution of points that create the trajectories. The trajectory for the fully operational condition (Fig. 8) occupies the lowest area. The energetic trajectory for partly operational condition state (Fig. 9) is bigger than the one for fully operational condition state. In this case, there are mostly points with higher values of the Teager-Kaiser energy and some which have additionally higher values of . Fig. 10 presents a cloud of points creating energetic trajectory for one of data blocks for non-operation damage condition of the gearbox. In this case, one of teeth has a fatigue crack in its base causing transient disturbance in the meshing. The energetic trajectory is made of widely dispersed points with many points with high and values. Those points indicate rapid and highly energetic transient events caused by an impulsive mesh of pair of teeth. These significant changes in the character of the energetic trajectories can be used to detect early stages of damages both in gearboxes and bearings. The high energy and the high velocity of change of the energy components in energetic trajectory, caused by the developing damage, appear earlier then symptoms based on classical measures. Upon completing the experiment, the pinion tooth No. 11 was completely fractured.
Fig. 8The energetic trajectory for fully operational condition (data block 200)
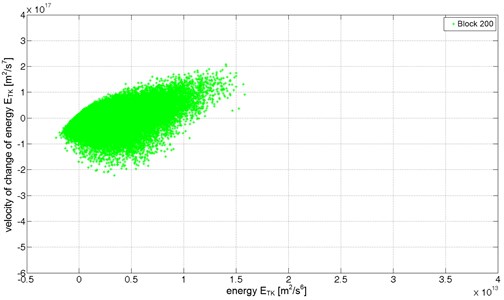
Fig. 9The energetic trajectory for partly operational condition (data block 500)
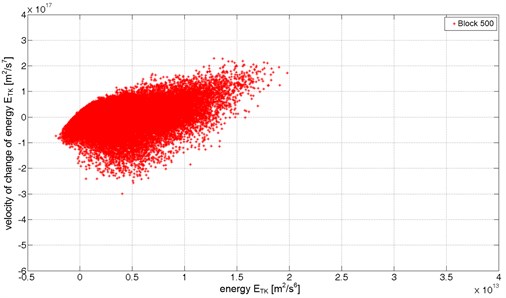
Fig. 10The energetic trajectory for non-operational condition (data block 700)
7. Conclusions
The concept of the Teager-Kaiser energetic trajectory presented in the paper is a novel approach to signal analysis based on the assumption that the emergence of damage will influence the amplitude-frequency structure of the signal. As presented earlier, in the example of signals with different types of modulations (AM, FM and AMFM), the energetic trajectories have characteristic shapes resulting from the type of the modulation of the examined signal.
It is worth noticing that representation of the signal on the plane is sensitive to local and transient disturbances resulting from early stages of damage s which might not be detected early enough using integral methods such as e.g. the methods based on the spectrum analysis. As presented using numerical model, the emergence and development of damage that impacts the amplitude-frequency structure of the signal causes the change in the magnitude and the shape of the energetic trajectory.
The Teager-Kaiser energetic trajectory of examined signal might be difficult to use straightforward for condition monitoring of machines. For application of the energetic trajectory in such task proper descriptors must be created. The trajectory can be described i.e. by statistical parameters such as: location of the center of gravity, maximum values of and , range of values along and axes and others. The development of methods, which would allow to apply the energetic trajectory for condition monitoring and detection of anomalies in real-life diagnostic signals, constitutes the area of future research.
Future research will test influence of such a factors as noise, load or rotating speed of gearbox on the Teager-Kaiser energy trajectory. Additionally, research will be extended on application of the Teager-Kaiser energetic plane for condition monitoring of bearings.
References
-
Dybała J. Vibrodiagnostics of gearboxes using NBV-based classifier: a pattern recognition approach. Mechanical Systems and Signal Processing, 2012, https://doi.org/10.1016/j.ymssp.2012.08.021.
-
Delvecchio S. On the use of wavelet transform for practical condition monitoring issues. Advances in Wavelet Theory and Their Applications in Engineering. Physics and Technology, InTech, 2012, https://doi.org/10.5772/35964.
-
Mączak J. Local meshing plane analysis as a source of information about the gear quality. Mechanical Systems and Signal Processing, 2012, https://doi.org/10.1016/j.ymssp.2012.09.012.
-
Radkowski S., Guminski R. Energy of vibroacoustic signal as parameter of logistics model of the tooth's crack development. Proceedings of the ASME 11th Biennial Conference on Engineering Systems Design and Analysis, Vol. 1, 2012, p. 271-272.
-
Radkowski S., Jasinski M. Use of condition monitoring in the proactive maintenance strategy. 8th World Congress on Engineering Asset Management (WCEAM), Hong Kong, China, 2015, p. 601-610.
-
Orlowska A., Kolakowski P., Holnicki-Szulc J. Detecting delamination zones in composites by embedded electrical grid and thermographic methods. Smart Materials and Structures, Vol. 20, Issue 10, 2011, https://doi.org/10.1088/0964-1726/20/10/105009.
-
Gałęzia A. Utilization of components of signals from high frequency range in condition monitoring of bearings. Diagnostyka, Vol. 3, Issue 55, 2010, p. 35-44.
-
Gontarz S., Szulim P., Seńko J., Dybała J. Use of magnetic monitoring of vehicles for proactive strategy development. Transportation Research Part C: Emerging Technologies, Vol. 52, 2015, p. 102-115.
-
Radkowski S., Gumiński R. Impact of vibroacoustic diagnostics on certainty of reliability assessment. Engineering Asset Lifecycle Management, Vol. 16, 2010, p. 574-582, https://doi.org/10.1007/978-0-85729-320-6_66.
-
Gontarz S., Mączak J., Szulim P. Online monitoring of steel constructions using passive methods. Engineering Asset Management – Systems, Professional Practices and Certification, Springer International Publishing, 2015, p. 625-635.
-
Cempel C., Żółtowski B. Inżynieria Diagnostyki Maszyn. PTDT/ITE, 2004, (in Polish).
-
Radkowski S. Non-linearity and intermodulation phenomena tracking as a method for detecting early stages of gear failures. Insight, Vol. 50, Issue 8, 2008, p. 419-422, https://doi.org/10.1784/insi.2008.50.8.419.
-
Randall R. B. Vibration-based Condition Monitoring: Industrial, Aerospace and Automotive Applications. John Wiley and Sons, 2011.
-
Mechanical Vibration – Evaluation of Machine Vibration by Measurements on Non-Rotating Parts – Part 1: General Guidelines. ISO 10816-Part 1, International Organization for Standardization, Geneva, 1995.
-
Randal R. B. A new method for modelling gear faults. Journal of Mechanical Design, Vol. 104, 1982, p. 259-267.
-
McFadden P. D. Detecting fatigue cracks in gears by amplitude and phase demodulation of the meshing vibration. Journal of Vibration, Acoustics Stress and Reliability in Design, Vol. 108, Issue 2, 1986, p. 165-170.
-
McFadden P. D. Determining the location of a fatigue crack in a gear from the phase of the change in the meshing vibration. Mechanical Systems and Signal Processing, Vol. 2, Issue 4, 1988, p. 403-409.
-
Zakrajsek J. J. A Review of Transmission Diagnostics Research at NASA Lewis Research Center. Lewis Research Center, Cleveland. Ontario, 1994.
-
Antoniadis I., Yiakopoulos C.T., Maczak J., Rodopoulos K. Multicomponent decomposition of a time-varying acoustic Doppler signal generated by a passing railway vehicle using complex shifted Morlet wavelets. Transportation Research Part C Emerging Technologies, Vol. 7, Issue 2014, 2014, p. 34-51.
-
Barczewski R. Diagnostic Oriented Metods of Short-Time Processing of Vibroacoustic Signals (Diagnostycznie Zorientowane Metody Krótkoczasowego Przetwarzania Sygnałów Wibroakustycznych), Rozprawa Habilitacyjna. Wydawnictwo Politechniki Poznańskiej, 2013, www.wbc.poznan.pl:316720, (in Polish).
-
Łazarz B., Madej H., Wilk A., Figlus T., Wojnar G. Diagnostics of Complex Cases of Failures of Gearboxes (Diagnozowanie Złożonych Przypadków w Uszkodzeń Przekładni Zębatych). Wydawnictwo Instytutu Technologii Eksploatacji – Państwowego Instytutu Badawczego, Katowice, Radom, 2006, (in Polish).
-
Halim E. B., Shah S., Zuo M. J. Fault detection of gearbox from vibration signals using time-frequency domain averaging. Proceedings of American Control Conference. Minneapolis, Minnesota, USA, 2006, p. 4430-4435.
-
Pryor A., Lewicki D. G., Mosher M. The application of time-frequency methods to HUMS. American Helicopter Society’s 57th Annual Forum. Washington D.C., 2001, http://citeseerx.ist.psu.edu/viewdoc/summary?doi=10.1.1.15.8641.
-
Kaiser J. F. On a simple algorithm to calculate the ‘energy’ of a signal. Proceedings of IEEE International Conference on Acoustics, Speech, and Signal Processing, Albuquerque, NM, 1990, p. 381-384.
-
Maragos P., Potamianos A. Higher order differential energy operators. IEEE Signal Processing Letters, Vol. 2, Issue 8, 1995.
-
Kaiser J. F. On Teager’s Energy Algorithm and its generalization to continuous signals a simple algorithm to calculate the ‘energy’ of a signal. Proceedings of IEEE Digital Signal Processing Workshop, New Paltz, NY, 1990.
-
Kvedalen E. Signal Processing Using the Teager Energy Operator and Other Nonlinear Operators. Master of Science Thesis, University of Oslo, Department of Informatics, 2003.
-
Maragos P., Kaiser J. F. Quatieri T. F. On amplitude and frequency demodulation using energy operators. IEEE Transactions on Signal Processing, Vol. 41, 1992, p. 1532-1550.
-
Gałęzia A. Averaged signal measures of TKEO energy waveform in detection of tooth break in gearbox. Measurement Automation and Monitoring, Vol. 60, Issue 1, 2014, p. 31-34.
-
Batko W., Korbiel T., Pawlik P. Experimental analysis of the phase trajectory usefulness in diagnostics of rotating machines. Problemy Eksploatacji – Maintenance Problems, Vol. 1, 2012, p. 7-15.
-
Forrester D. B. Advanced Vibration Analysis Techniques for Fault Detection and Diagnosis in Geared Transmission Systems. Ph.D. Thesis, Swinburne University of Technology, 1996, http://researchbank.swinburne.edu.au/vital/access/manager/Repository/swin:7437.
-
Bovik A. C., Maragos P., Quatieri T. F. AM-FM energy detection and separation in noise using multiband energy operators. IEEE Transactions on Signal Processing, Vol. 41, 1993, p. 3245-3265.
-
Dimitriadis D., Maragos P. An improved energy demodulation algorithm using splines. IEEE International Conference on Acoustics, Speech, and Signal Processing, Piscataway, NJ, USA, Vol. 6, 2001, p. 3481-3484.
-
Banerjee P. K., Chakrabarti N. B. Noise Sensitivity of Teager-Kaiser Energy Operators and Their Ratios. arXiv:1504.08177.
-
Maragos P., Quatierit T. F., Kaiser J. F. Speech nonlinearities, modulations and energy operators. Proceedings of IEEE International Conference on Acoustics, Speech, and Signal Processing, 1991. https://doi.org/10.1109/ICASSP.1991.150366.
-
Dybała J., Radkowski S. Use of neural networks in recognition of time-frequency images of early stages of failures. Proceedings of 11th conference Diagnostics of Industrial Processes, Władysławowo, 2003, p. 503-508, (in Polish).
-
Maczak J. Local meshing plane analysis as a source of information about the gear quality. Mechanical Systems and Signal Processing, Vol. 38, Issue 1, 2013, p. 154-164.
Cited by
About this article

