Abstract
This paper investigates the application of the entropy parameter and support vector data description (SVDD) on signal processing and rolling bearing health status assessing. On this basis, a novel method for mechanical health status assessment method based on entropy and SVDD is presented, which uses the entropy parameters to reflect the health status of rolling bearing life cycle, and then these parameters are input into SVDD to accomplish health status assessment. The experimental result of the proposed method to health status assessing of the rolling bearing shows that this method can extract the health status features, which have better ability of reflecting the status degeneration, accordingly solve the problem of health status assessment with poor data.
1. Introduction
By reducing costs and decreasing the repair time, condition based maintenance becomes an efficient strategy in industry [1, 2]. Condition monitoring of rotating machinery is important in terms of system maintenance and process automation. Rolling element bearing failures are one of the foremost causes of failures in rotating machinery [3, 4]. Since vibration signals carry a great deal of information representing mechanical equipment health conditions, the vibration based signal processing technique is one of the principal tools for assessing bearing health status [5, 6].
Generally speaking, it is hard or even impossible to obtain the equipment whole lifetime running data [7]. So how to evaluate the health status of rolling element bearings without lifetime data is a big problem. In this paper, a novel method based SVDD and entropy parameters is presented, which uses the entropy parameters to reflect the health status of rolling bearing life cycle, and then these parameters are input into SVDD to accomplish health status assessment.
2. Health status assessment method
2.1. Support vector data description
SVDD [8] is a one-class classification method based on the idea of support vector machine, for which not the optimal separating hyperplane but the sphere with minimal volume containing all or most objects has to be found; its sketch in two-dimensional space is shown in Fig. 1. The method is often utilized for Novelty detection. Novelty detection based on boundary essentially is to find a sphere with minimum volume containing all (or most of) the normal data objects. For a data set including normal data objects, when there are one or several remote objects, a very large sphere is gained, which the data set will not be represented well.
Hence, the remote data points are allowed be outside of the sphere by introducing slack variable . And the sphere can be represented by center a and radius as follows:
where the variable is used for indicating the trade-off between scope of the sphere and the number of detection errors:
Setting the partial derivatives to 0, the constraints can be achieved:
Afterwards, the optimal equation can be transformed as follows:
In the preceding process, we can found that the sphere center is a linear combination of data objects using weight factors . Just a few objects satisfy the second equation in Eq. (1), which are on the sphere boundary. The objects with nonzero coefficients αi which are the support vectors, or also the support objects. All this indicate that SVDD holds sparseness, which proves its excellent computing ability.
The SVDD method constructs a sphere around the data in the primeval input space. Generally, the data samples are in discrete distribution, and a tight description of the data set is impossible to obtain. Consequently, the kernel function is introduced to replace inner products (), which implicitly maps the objects into feature space. If a appropriate feature space is constructed, a tighter description of the data set can be gained.
Different kernel functions will construct different description boundaries in the primeval input space. Gaussian kernel is used widely in so many domains, which described as follows:
where is the width parameter, also called extension constant. This function can convert the original data sets into high dimensional feature space.
2.2. Health status assessment model
However, there are some problems in applying SVDD to health state degradation assessment, because only normal state data could construct clustering structure during bearing’s (in fact almost all equipment) whole lifetime. In actual fact, the data during the bearing's degradation period are different which indicate various status, especially at the last stage of degradation, consequently it is improper to establish a clustering center through the data during the degradation process.
In this research, thinking about the reasons, normal data sets are regarded as one class whose clustering center is computed using SVDD and the data at final failure time (only one sample) is regarded as one class whose clustering center is itself. The range between test data sets and normal status is calculated through Eq. (6). Something should be pointed out is that the range should be calculated in kernel space, which have been studied in SVDD method. The kernel space Euclidean distance of and is calculated as follows:
where the adopted kernel function is indicated by . If Gaussian kernel function is employed, Eq. (7) will be as follows:
The degradation indicator (DI) was defined as the health status of the device, if , then DI = 0 indicates that the device is in a normal state of health; Else if , then indicates that the device has entered the degradation processes and quantitatively assess the degree of degradation. Therefore the range of DI is [0, 1], 0 means completely failure, 1 means completely normal. In fact, DI is often less than 1 as bearing is normal, because normal data often distribute around the normal state’s clustering center, and 1 only can be obtained when the tested data are the same as normal state’s clustering center.
3. Experimental setup and data acquisition
Most research concerning bearing diagnostics focuses on distinguishing different bearing faults. In addition, artificially seeded damage was frequently introduced in the machine with electrical discharge for method validation. However, in practice, without abrupt failure usually a bearing deteriorates from normal to failure. Besides, this propagation also addresses a bearing’s early fault stage. Therefore, this process by nature is better than that simulated by artificial seeded damage. Obtaining full lifetime vibration data under natural operation requires much time and cost. So, an accelerated life test is required. This experiment enforces a machine working under overload condition to accelerate machine degradation. In this paper, vibration signals collected from a mechanical diagnostics test bed (MDTB) is employed to prove the presented method. Vibration data is obtained from double row bearings, which is called Rexnord ZA-2115, are provided by the NSF I/UCR Center for Intelligent Maintenance Systems (IMS).
Fig. 1Bearing test rig and sensor placement illustration
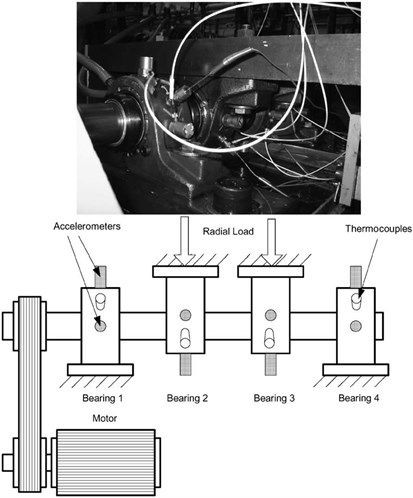
Test Rig Setup Four bearings were installed on a shaft. The rotation speed was kept constant at 2000 RPM by an AC motor coupled to the shaft via rub belts. A radial load of 6000 lbs is applied onto the shaft and bearing by a spring mechanism. All bearings are force lubricated. Rexnord ZA-2115 double row bearings were installed on the shaft as shown in Fig. 1. PCB 353B33 High Sensitivity Quartz ICP accelerometers were installed on the bearing housing (two accelerometers for each bearing [- and -axes] for data set 1, one accelerometer for each bearing for data sets 2 and 3). Sensor placement is also shown in Fig. 1. All failures occurred after exceeding designed life time of the bearing which is more than 100 million revolutions [9, 10].
4. Results and discussion
With the continuous operation of equipment, often accompanied by the occurrence of multiple failures and deterioration, resulting in intense vibration signal and complex spectrum. If only the fault characteristic frequencies are studied for the health status indicators of equipment, which could not meet the needs of effectively reflect the equipment health status degradation. Here, how to extract effective equipment health status indicators becomes a key issue.
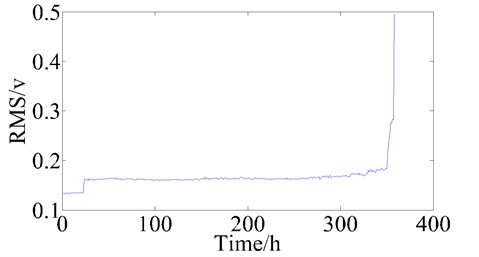
In Fig. 2-7, the changes of the pea – peak value, root mean square value, wavelet entropy, singular spectrum entropy, approximate entropy and sample entropy during the bearing whole lifetime is showed. We can find that the six parameters can reflect the trend of bearing health status degradation, therefore, these six parameters are used to assess the bearing health state.
Fig. 2The trend of pea – peak value during bearing lifetime
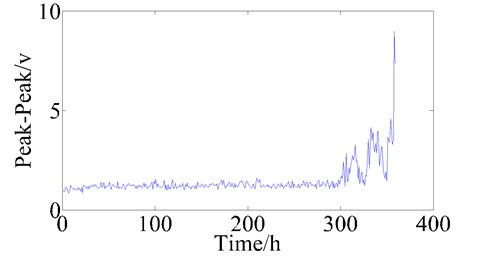
Fig. 3The trend of root mean square value during bearing lifetime
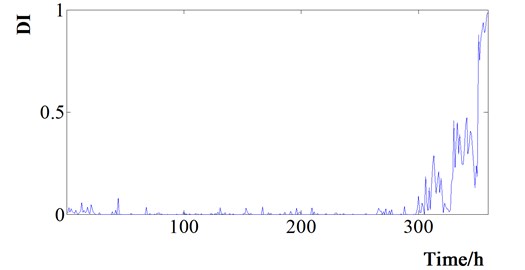
The six parameters were used to build the SVDD assessing model, which was used to evaluate the health status of the bearing. And the SVDD assessing results of the bearing is showed in Fig. 8.
The results of the SVDD evaluation is shown in Fig. 8, it can be found that the six parameters can reflect the bearing’s health status degradation. At the same time, the SVDD model could evaluate the bearing’s health status effectively and overcome the problem of absence of operating data.
Fig. 4The trend of wavelet entropy during bearing lifetime
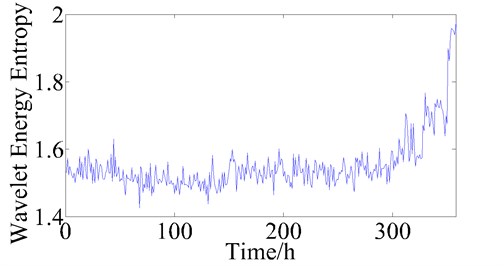
Fig. 5The trend of singular spectrum entropy during bearing lifetime
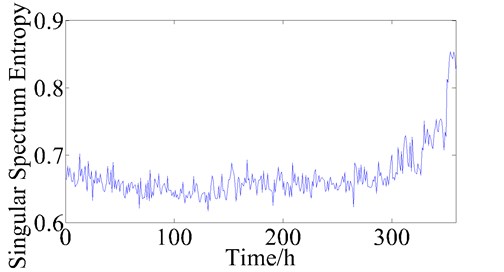
Fig. 6The trend of approximate entropy during bearing lifetime
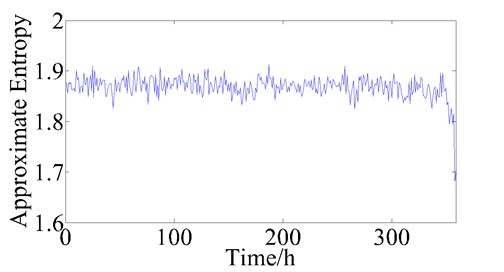
Fig. 7The trend of sample entropy during bearing lifetime
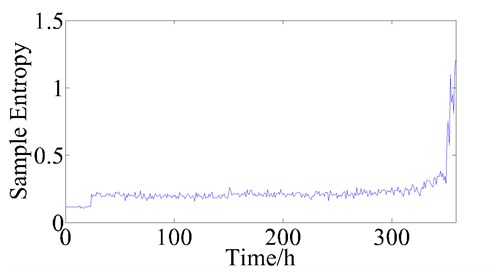
Fig. 8The SVDD assessing results of bearing
5. Conclusion
In this paper, a novel bearing health status access method based on SVDD is presented. Firstly, the statistical features and entropy based features pea – peak value, root mean square value, wavelet entropy, singular spectrum entropy, approximate entropy and sample entropy are employed as status parameters for reflecting the bearing condition. And SVDD method is used for bearing health status evaluating. The method could solve the status estimate problem with poor data. The validity of the proposed status assess method is verified by the application of practical experiments of the rolling bearing.
References
-
Peng Z. K., Chu F. L. Application of the wavelet transform in machine condition monitoring and fault diagnostics: a review with bibliography. Mechanical Systems and Signal Processing, Vol. 18, 2004, p. 199-221.
-
Rafiee J., Arvani F., et al. Intelligent condition monitoring of a gearbox using artificial neural network. Mechanical Systems and Signal Processing, Vol. 21, 2007, p. 1746-1754.
-
Lou Xinsheng, Loparo Kenneth A. Bearing fault diagnosis based on wavelet transform and fuzzy inference. Mechanical Systems and Signal Processing, Vol. 18, 2004, p. 1077-1095.
-
Paya B. A., Esat I. I., Badi M. N. M. Artificial neural network based fault diagnostics of rotating machinery using wavelet transforms as a preprocessor. Mechanical Systems and Signal Processing, Vol. 11, Issue 5, 1997, p. 751-765.
-
Lei Y.G., et al. Fault diagnosis of rotating machinery based on a new hybrid clustering algorithm. International Journal of Advanced Manufacturing Technology, Vol. 35, 2008, p. 968-977.
-
Zarei J., Poshtan J. An advanced Park’s vectors approach for bearing fault detection. Tribology International, Vol. 42, 2009, p. 213-219.
-
Ocak Hasan, Loparo Kenneth A., Discenzo Fred M. Online tracking of bearing wear using wavelet packet decomposition and probabilistic modeling: a method for bearing prognostics. Journal of Sound and Vibration, Vol. 302, 2007, p. 951-961.
-
Tax D. M. J., Duin R. P. W. Support vector domain description. Pattern Recognition. Vol. 20, Issues 11-13, 1999, p. 1191-1199.
-
Heng S. Y. A., Tan A. C. C., Mathew J., Yang B. Machine prognosis with full utilization of truncated lifetime. 2nd World Congress on Engineering Asset Management and the 4th International Conference on Condition Monitoring, Harrogate, UK, 2007.
-
Qiu H., Lee J., Lin J., et al. Robust performance degradation assessment methods for enhanced rolling element bearing prognostics. Advanced Engineering Informatics, Vol. 17, Issue 3, 2003, p. 127-140.
