Abstract
Bolted joints are widely applied in assembled mechanical structures. This paper focuses on the nonlinear modeling and parameter identification of bolted beams. Two Valanis models are respectively used to describe the nonlinear behaviors of the bolted joint and the boundary connection. Experimental tests at low and high excitation levels are performed to reveal the dynamic characteristics of the bolted beams. The Young’s modulus of the beams is identified via experimental test with low excitation level; whereas the parameters of Valanis model are identified by using optimization technique in order to minimize the residual error between the measured and the simulation data at a high excitation level.
1. Introduction
In the aeronautical and aerospace areas, much attention has been attracted by the assembled mechanical structures which consist of substructures or parts connected to each other through different sorts of connections [1, 2]. If the effects of the mechanical joints on the dynamics are ignored in the models of mechanical structures, there may exist a significant error between the theoretical and experimental results, especially in some cases with large excitation or motion levels. Many researchers have focused on how to solve such a problem employing the theoretical or experimental methods [3, 4]. For instance, Kuether et al. presented two modal sub-structuring techniques describing the nonlinear dynamic behaviors of an assembled structure [5]. Hammami et al. [6] presented a detailed review on damping design of a jointed structure. Segalman et al. [7] investigated a four-parameter model for lap-type joints in order to capture the dissipation fashions of harmonically loaded experiments.
Among the mechanical connections, bolted joints are applied in assembled mechanical structures most widely. A plenty of researchers have paid attention to developing predictive models for bolted joints in different structures. For instance, Song et al. [8] developed an adjusted Iwan model approach to simulate the non-linear dynamic behavior of bolted joints in beam structures. Jalali et al. [9] presented a nonlinear model of single degree of freedom to describe the governing equation of bolted joints interface between two beams. Ahmadian et al. [10] used a nonlinear spring to represent the softening phenomenon of the joint interface in the modeling of the joint which was in the mid span of an Euler-Bernoulli beam.
It is observed that relatively less attention has been paid to identifying a structure with not only nonlinear joint but also nonlinear boundary connection. The key purpose of the research is to explicitly and accurately model and to identify the structures with joint and boundary nonlinearity. For this purpose, two Valanis models are respectively used to describe the behaviors of the bolted joint and the boundary connection. The Young’s modulus of the beams is identified by using experimental tests with low excitation levels, whereas the parameters of Valanis model are identified by using optimization technique in order to lessen the residual error between the measured and the simulation data at a high excitation level.
2. The method of the identification
The nonlinear characteristics of the bolted joints, such as micro/macro-slip, may have a significant effect on the dynamic behavior of assembled structures. Therefore, it is of practical importance to accurately model the nonlinear characteristics of the interfaces of the bolted joints. The equation of motion for a nonlinear system with multiple degrees of freedom under harmonic excitation can be expressed as follows:
where and are the vectors of displacements and velocities, represents the nonlinear internal force which is a function of the displacements and velocities, is the amplitude vector of the excitation forces, is the excitation frequency, and , and denote the mass, damping and stiffness matrices, respectively. In the case of one nonlinear element between th and th degrees of freedom, the nonlinear force term can be expressed as:
where represents the displacement between th and th degree of freedom. The excitation forces can be written as:
where th represents the degree of freedom of exciting position. By neglecting high-order harmonic components due to nonlinear effects, the dynamic response of the bolted beam can be written as:
where is the response of Amplitude, is the excitation frequency, is the phase difference between the response and the excitation force signals. Transforming amplitude response into frequency domain yields:
where represents the function of nonlinear frequency response, is the excitation frequency, is the phase difference between this response and the excitation force signals. In order to identify the Valanis model parameters, optimization technique has been adopted in order to minimize the residual error between the measured and the simulation data. According to this particular requirement, the objective function can be expressed as follows:
Fig. 1 depicts the main procedure of the optimization task. The dynamic responses obtained by using simulations and experimental testing are used to establish the objective function and then optimization solver minimizes the residual error between the measured and the simulation data.
3. Simulation example
Fig. 2 shows a two-degree freedom system with a nonlinear boundary connection. 2, 3, 100, 250, 120. The equation of motion for a nonlinear system can be expressed as follows:
where and represent the amplitude of the excitation force and the excitation frequency, respectively. can be represented as a Valanis model [11], such that:
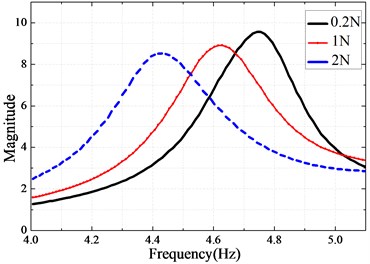
where , , , are the parameters of a Valanis model. Table 1 shows the initial values of the four parameters. Fig. 3 shows the frequency responses of the system at 1 N, 3 N, 5 N.
Fig. 1Flow chart of the identification algorithm
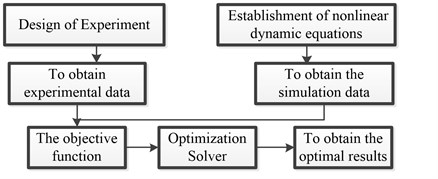
Fig. 2A two degrees of freedom system
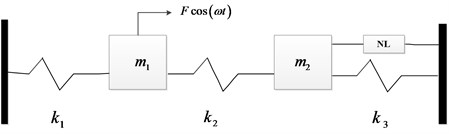
Table 1Initial value of the Valanis model
Parameters | ||||
Initial value | 0.6 | 12 | 100 | 10 |
Fig. 3Nonlinear frequency response function
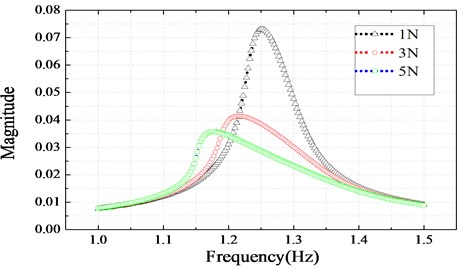
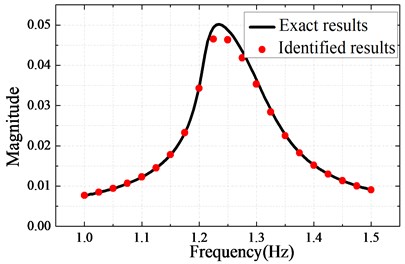
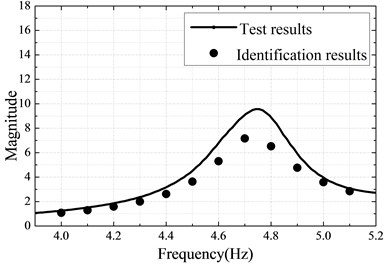
Fig. 3 shows the frequency responses in which the peak value of the structure response decreases with the amplitude of the exciting force. The parameters of the Valanis can be identified by using fminsearch solver. Table 2 shows the identified values whereas Fig. 4(a) and Fig. 4(b) show the identified (1 N) results and the predicted results respectively.
Table 2The identified results
Parameters | ||||
Exact value | 0.6 | 12 | 100 | 10 |
Initial value | 0.8 | 21 | 70 | 8 |
Identified value | 0.61 | 11.79 | 99.99 | 7.88 |
Fig. 4a) The identified results, b) the predicted results
a)
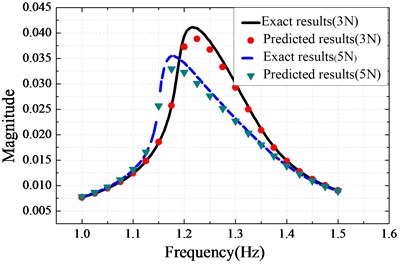
b)
4. Experimental studies
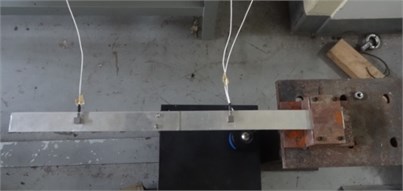
Experimental tests were conducted to investigate the dynamic characteristics of two beams connected through two bolts, as shown in Fig. 6. The bolted joint and the boundary connection are contained in the structure. The setup of the testing system consists of an electromagnetic vibration exciter, a power amplifier, a vibration test controller, etc. The input force and the dynamic responses of the system are measured using a force transducer and four acceleration sensors, respectively, as shown in Fig. 5 and Fig. 6.
Fig. 5A diagrammatical scene of the experimental setup
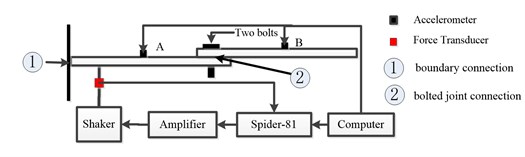
Fig. 6A formal outlook of the experimental setup
Two different stages of the experimental tests were carried out. In the first part, the bolted beams were excited by using two sinusoidal forces (0.1 N and 0.2 N), respectively. The excitation time of 5 minutes was set in the Spider-81 software system. Fig. 7(a) describes the Frequency Response Function (FRF) of the data acquired at sensor location B using the Engineering Data Management (EDM) software from Crystal Instruments. The experimental results obtained using the two sinusoidal excitations at small levels are almost the same since the assembled structure behaves linearly in the case of a small excitation level.
The linear material parameters of beams are identified by using optimization technique. The initial values of Young’s modulus are taken to be 80 GPa. Table 3 and Fig. 7(b) show the identified Young’s Modulus and the FRF obtained using the identified value, respectively.
Table 3Initial and updated Young’s modulus
Young’s modulus | Initial value | Identified value |
(Pa) | 8×10¹⁰ | 8.8×10¹⁰ |
Fig. 7a) Measured linear FRF at sensor location B, b) Linear identification results
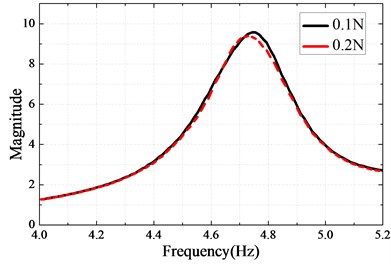
a)
b)
In the second part, the bolted beams were excited using the sinusoidal forces with much larger levels in order to identify the nonlinear characteristics of the system. Two different levels of excitation forces ( 1 N and 2 N) were considered for the experimental tests having range of testing frequency from 4 Hz to 6 Hz in software system. Quite different from the case of linear structure, Fig. 8 shows the measured FRF and the natural frequency of the structure which decreases with the amplitude of the exciting force.
Fig. 8Measured nonlinear frequency response function at sensor location B
In this part, two Valanis models are respectively used to describe the nonlinear behaviors of the bolted joint and the boundary connection. The parameters of the Valanis models are identified by minimizing the objective function defined in Eq. (7). The boundary connection and the bolted connection consisting of two bolts is respectively treated as a single nonlinear joint. The results of optimization are obtained using Matlab fminsearch solver and shown in Table 4-5 and Fig. 9. The responses of the identified model coincide well with that of the experimentally measured responses, as shown in Fig. 9(a). Finally, the proposed strategy is verified by comparing the frequency responses of the identified model and the experimental test under another exciting level (2 N). Fig. 9(b) demonstrates a good agreement between the dynamic responses of the identified model and the experimental tests under 2 N excitation force. It confirms that the identified models can characterize very well the nonlinear behavior of the beam with nonlinear connections subjected to the higher levels of excitations.
Table 4Identified parameters of Valanis model at the boundary connection
Parameters | ||||
Initial value | 0.1 | 800 | 30 | 100 |
Identified value | 0.04 | 1157.22 | 31.34 | 131.52 |
Table 5Identified parameters of Valanis model at the bolted joint connection
Parameters | ||||
Initial value | 0.1 | 800 | 100 | 80 |
Identified value | 0.10 | 923.44 | 93.35 | 66.65 |
Fig. 9a) Measured and identified responses with 1 N excitation; b) Measured and predicted responses with 2 N excitation
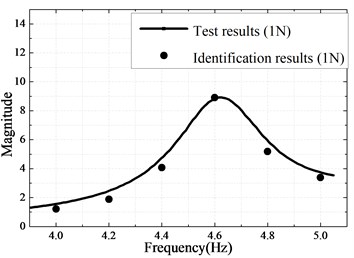
a)
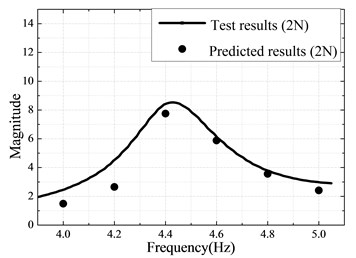
b)
5. Conclusions
The main purpose of this research is to analyze the beams with nonlinear joint and nonlinear boundary connection by using Valanis model. It has been depicted by experimental results that the dynamic responses of the bolted beams under low and high excitation levels are linear and nonlinear, respectively. The equivalent linear material parameters of the beam are obtained using the linear response at low excitation level. Two Valanis models are respectively used to describe the nonlinear behaviors of the nonlinear joint and nonlinear boundary connection. The parameters of two Valanis models are identified by minimizing the error between simulated and experimentally measured results under a high excitation level. It has been shown that the frequency response of the identified model and experimental tests matches well with each other.
References
-
Cheng H., Li Y., Zhang K., Su J. Efficient method of positioning error analysis for aeronautical thin-walled structures multi-state riveting. The International Journal of Advanced Manufacturing Technology, Vol. 55, Issue 1-4, 2011, p. 217-233.
-
Zhang K., Cheng H., Li Y. Riveting process modeling and simulating for deformation analysis of aircraft’s thin-walled sheet-metal parts. Chinese Journal of Aeronautics, Vol. 24, Issue 3, 2011, p. 369-377.
-
Carrella A., Ewins D. J. Identifying and quantifying structural nonlinearities in engineering applications from measured frequency response functions. Mechanical Systems and Signal Processing, Vol. 25, Issue 3, 2011, p. 1011-1027.
-
Ozer M. B., Ozguven H. N., Royston T. J. Identification of structural non-linearities using describing functions and the Sherman-Morrison method. Mechanical Systems and Signal Processing, Vol. 23, Issue 1, 2009, p. 30-44.
-
Kuether R. J., Allen M. S. Nonlinear modal substructuring of systems with geometric nonlinearities. 54th AIAA/ASME/ASCE/AHS/ASC Structures, Structural Dynamics, and Materials Conference, 2014, p. 19.
-
Hammami C., Balmes E., Guskov M. Numerical design and test on an assembled structure of a bolted joint with viscoelastic damping. Mechanical Systems and Signal Processing, Vol. 70-71, Issue 1, 2016, p. 714-724.
-
Segalman D. J. A four-parameter Iwan model for lap-type joints. Journal of Applied Mechanics – Transactions of The ASME, Vol. 72, Issue 5, 2005, p. 752-760.
-
Song Y., Hartwigsen C. J.,McFarland D. M.,Vakakis A. F., Bergman L. A. Simulation of dynamics of beam structures with bolted joints using adjusted Iwan beam elements. Journal of Sound and Vibration, Vol. 273, Issues 1-2, 2004, p. 249-276.
-
Jalali H., Ahmadian H., Mottershead J. E. Identification of nonlinear bolted lap-joint parameters by force-state mapping. International Journal of Solids and Structures, Vol. 44, Issue 25, 26, p. 8087-8105.
-
Ahmadian H., Jalali H. Identification of bolted lap joints parameters in assembled structures. Mechanical Systems and Signal Processing, Vol. 21, Issue 2, 2007, p. 1041-1050.
-
Valanis K. C. A theory of visco-plasticity without a yield surface. Archives of Mechanics, Vol. 21, 1971, p. 171-191.
About this article

This work was supported in part by the National Natural Science Foundation of China under Grants 11372130, and in part by the Foundation for the Author of National Excellent Doctoral Dissertation of China under Grant 201233.
