Abstract
To take maintenance measures timely and to prolong the lifetime of a bearing as a whole, bearing users need to know the current health state of the bearing. Those existing methods for health assessment are mostly based on fault samples and/or decline samples of bearings. However, the bearings are always not allowed to fail in the practical engineering application in consideration of the enormous harms and great damages might be caused by the bearing fault. So the fault samples or decline samples of bearing are often lacking. In this point of view, this paper presents a quantificational health assessment method for rolling bearing based solely on normal samples and SOM network. To demonstrate the capability of the proposed method, a series of vibration datasets of the bearings under various health states were employed to conduct case study. And this paper expresses the uncertainty of assessment results after training for many times by the probability density function (PDF).
1. Introduction
With the development of the fault diagnosis and health management method of rolling bearing, the state of rolling bearing could be divided into three categories: health, sub-health and fault [1]. A lot of researches on health assessment have been carried out in recent years. Jay Lee applied the Cerebellar Model Articulation Controller (CMAC) to monitor machine performance degradation [2]. Casoetto et al. used autoregressive model and feature mapping to assess the performance of the multi-sensor signal acquisition process of welding head [3]. Zhang et al. combined the principal component analysis and CMAC to evaluate the performance of the cutting tools of drilling machine [4]. Liu et al. combined the fault observer and SOM network to assess the performance degradation of hydraulic servo system [5]. Van Tung Tran et al. used proportional hazard model and support vector machine to conduct performance degradation assessment [6]. ZENG et al. presented that the assessment of equipment degradation could be conducted based on KPCA-HSMM and verified the feasibility of this method by the data of rolling bearings [7].
The above-mentioned research contributions were mostly based on the fault or decline samples of bearings and solved the problem of bearing fault diagnosis and health assessment to some sextent. However, there are often not enough fault samples or decline samples of bearings since the bearings are always not allowed to fail in the practical engineering application. Although there are some state assessment methods based on normal samples, the bearing users can only determine whether the bearing is fault or not according to the difference between current sample data and normal samples data of the bearing by those methods. And they cannot describe the current health state of the bearing quantificationally [8-12].
In order to solve those existing problems, this paper puts forward a quantificational health assessment method of rolling bearing based solely on normal samples. First, extract the time domain features of the vibration signal to reflect the state change of the bearing at the most extent. Then calculate the distance between the feature space corresponding to current state and the feature space corresponding to normal state. Finally, obtain the health value of the bearing under current state by the SOM network assessment model according to the distance. Moreover, this paper expresses the uncertainty of the health assessment results by probability density function (PDF). In case study, this paper uses the real vibration data of the bearings under different damaged states to demonstrate the capability of the proposed method.
2. Global feature extraction
The feature extraction methods commonly used in the field of bearing fault diagnosis mainly include time-domain analysis, frequency-domain analysis and time-frequency analysis [13-16]. This paper focuses on the health state assessment of the entire bearing with the consideration that it is more effective and reasonable for personnel to replace a bearing as a whole rather than any aspect of the bearing in real applications. That is to say, we don’t need to identify the faulted location is inner ring, outer ring or rolling element. Therefore, this paper uses the time-domain feature extraction method to extract the information included in the vibration signal and reflect the entire state of the bearing. The time-domain parameters of vibration signal are consisted of dimensional parameters and non-dimensional parameters. The dimensional time-domain parameters could be expressed as:
Mean:
Maximum:
Minimum:
Effective value:
Variance:
Peak-to-Peak Value : the difference between the maximum peak and the adjacent lowest peak.
Root Amplitude:
Average Amplitude:
Kurtosis: .
Among these parameters, the peak-to-peak value is considerably sensitive to the amplitude variation, and it will increase sensitively along with the increase of the amplitude of vibration signal. So, the peak-to-peak value is selected as a time-domain feature used in this paper. In addition to the above-mentioned dimensional parameters, there are also many non-dimensional parameters. The commonly used non-dimensional features in time-domain are as follows:
Crest factor:
Impulse Factor:
Margin Factor:
Kurtosis Factor:
Where the kurtosis factor is more sensitive to the bearing fault with shock pulse. And this parameter will increase obviously when the early failure occurs. So, the kurtosis factor is choosed to extract the information included in the vibration signal and reflect the state of the entire bearing in this paper. Both the sensitivity and stability of the feature parameter are considered by choosing appropriate time-domain features.
3. The health assessment model
3.1. The principle of SOM network
The self-organizing feature maps (SOM) network was first put forward by professor Kohonen in Finland in 1981. The algorithm used in SOM network called Kohonen algorithm, and its basic idea is that each neuron at output layer competes for the chance to respond to the input. Eventually only one neuron is the winner. And the winning neuron will affect its nearby neurons, for example, making the connection weight between the winning neuron and its nearby neurons changes for winning the chance [17]. In this paper, the SOM network is applied to bearing health assessment using only normal samples for its high generalization ability, fast learning rate and intuitive output layer results, which provides a new method for rolling bearing heath assessment. A two-dimensional model of SOM network is shown in Fig. 1.
Fig. 1A two-dimensional model of SOM network
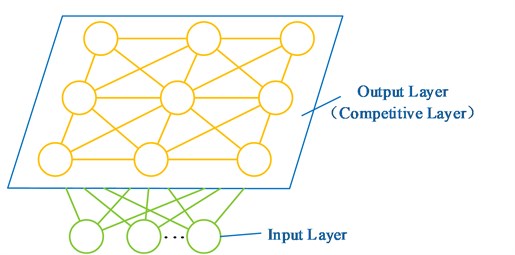
The training process of the SOM network using self-organizing competitive method is as follows:
1) Initialize the network.
Give a small random weight to each connection weight between the input unit and the output unit. And define the maximum length of training as the term of finishing the training.
2) Determine the best matching unit.
As for any sample in the training data set, calculate the Euclidean distance between the sampleand each output node and find out the output node that is the closest to the sample. Then the output node that is the closest to the sampleis called the best matching unit (BMU) of the sample and is denoted by . Then:
(3) Adjust the parameters.
At first, determine all of the nodes within the neighborhood of the best matching unit according to the neighborhood function. Then adjust the connection weight between the BMU and the nodes within its neighborhood:
where stands for the connection weight of node at step . And , which is a descending function, is the learning rate at step. is the neighborhood function.
(4) Train the network circularly. If the maximum length of training has not been achieved, turn back to step (2) and train again. Otherwise the training process is over.
3.2. Health assessment with a health indicator MQE
Train the SOM network by the time-domain feature of vibration data from the normal bearing. Then take the time-domain feature of vibration data from the bearing under current state as the test sample of SOM network. Next find out the best matching unit of each test sample in the output nodes of the trained SOM network. Finally, assess the current health state of the bearing by the distance between the test sample and best matching unit which is called Minimum Quantization Error (MQE):
where is the test vector of current state, and is the weight of the best matching unit.
Normalize the value of MQE and represent the current health state of the bearing using the normalized MQE. The larger the normalized MQE is, the better the health state of the bearing is. Moreover, this paper expresses the uncertainty of assessment results after training for many times through the probability density function (PDF), and take the health assessment value that is corresponding to the maximum value of probability density function as the final assessment result, i.e. this assessment result is the most likely outcome.
4. Case study
In this paper, the bearing fault experiments were conducted by the Case Western Reserve University (CWRU) and the type of the bearing used in these experiments was 6205-2RS. The sampling frequency was 12 kHz and the rotate speed is 1772 rpm. Moreover, there are five kinds of diameters of implanted bearing damage, the five kinds of diameters are 0 inch, 0.007 inch, 0.014 inch, 0.021 inch, 0.028 inch. As discussed in Section 2, this paper selects two time-domain parameters, the peak-to-peak value and the kurtosis factor, as the features of vibration signal to assess the health state of the bearing.
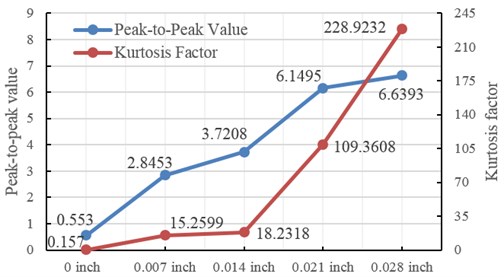
Take the peak-to-peak value and kurtosis factor of the vibration signal of the bearing under normal state as training samples of SOM network. As for the five kinds of damaged bearings, calculate the peak-to-peak value and kurtosis factor of the sampling data of each kind of damaged bearing to be the test samples of SOM network, as shown in Fig. 3. The peak-to-peak value and kurtosis factor are both increasing, i.e. the feature space corresponding to current state gradually deviates from the feature space corresponding to normal state.
Fig. 3The time-domain feature of the vibration data under different damaged states
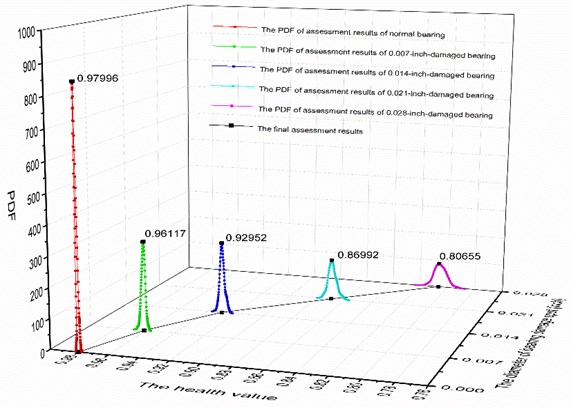
Then take the test sample as the import of the 500 trained SOM networks to obtain 500 assessment results of the bearing under different state. Next calculate the PDF of the 500 assessment results to get the final assessment result which is the health assessment value corresponding to the maximum value of PDF, as shown in Fig. 4. And list the final assessment result in Table 1.
Table 1The final assessment results of the bearings under different damaged states
The damaged states | 0 inch | 0.007 inch | 0.014 inch | 0.021 inch | 0.028 inch |
The final assessment results | 0.97996 | 0.96117 | 0.92952 | 0.86992 | 0.80655 |
Data in Fig. 4 and Table 1 show that the results of five times health assessments for each kind of damaged bearing are very close with stipulating the health value of the bearing under the normal state as 0.98. When taking the time-domain feature of the vibration signal of normal bearing as the test sample, the mean value of health assessment by the SOM network is 0.97996 which is close to 0.98. This fact suggests that the health assessment model is effective. Furthermore, the health states are 0.96117, 0.92952, 0.86992, 0.80655 for bearings with different damage levels of 0.007, 0.014, 0.021, 0.028 inch respectively. Therefore, the results of health assessment for the bearings under different damaged state is coincident with the degradation law of bearings.
Fig. 4The PDF of assessment results and the final assessment results of the bearings under different damaged state
5. Conclusions
This paper proposed a health assessment method of rolling bearing based solely on normal samples, and uses the real vibration data of bearings under different damaged states to conduct case analysis and obtains the current health value of the bearings quantificationally and reasonably. There are mainly three differences between the new method used in this paper and the traditional method. First, the new method extracts the time-domain feature reflecting the entire state of the bearing. Second, the new method is based solely on normal samples of the bearing. Third, the new method expresses the uncertainty of the assessment results by PDF after obtaining the health assessment results by the health assessment model. In the future, it is necessary to further research the way to assess the health state of bearings under different working conditions.
References
-
Hong S., Zhou Z. Remaining useful life prognosis of bearing based on Gauss process regression. 5th International Conference on Biomedical Engineering and Informatics (BMEI), 2012, p. 1575-1579.
-
Lee J. Application of cerebellar model articulation controller (CMAC) with a modified algorithm in monitoring machine performance degradation. International Journal of Plant Engineering and Management, Vol. 1, 2005, p. 8-12.
-
Casoetto N., Djurdjanovic D., Mayor R., et al. Multisensor process performance assessment through use of autoregressive modeling and feature maps. Journal of Manufacturing Systems, Vol. 22, 2003, p. 1-64.
-
Zhang L., Cao Q. X., Lee J., et al. PCA-CMAC based machine performance degradation assessment. Journal of Southeast University (English Edition), Vol. 21, Issue 3, 2005, p. 299-303.
-
Liu D. W., Liu H. M., Tao X. C., Lu C. Research on performance degradation assessment for hydraulic servo system based on fault observer and SOM network. Lecture Notes in Information Technology, Proceedings of International Conference on Future Information Technology and Management Science and Engineering, USA, Vol. 6, 2012.
-
Pham H. T., Yang B. S., Nguyen T. T. Machine performance degradation assessment and remaining useful life prediction using proportional hazard model and support vector machine. Mechanical Systems and Signal Processing, Vol. 32, 2012, p. 320-330.
-
Zeng Q., Qiu J., Liu G., et al. The study of equipment degradation state recognition method based on KPCA-HSMM. Acta Armamentarii, Vol. 6, 2009.
-
Yu J. A hybrid feature selection scheme and self-organizing map model for machine health assessment. Applied Soft Computing, Vol. 11, Issue 5, 2011, p. 4041-4054.
-
Huang R., Xi L., Li X., et al. Residual life predictions for ball bearings based on self-organizing map and back propagation neural network methods. Mechanical Systems and Signal Processing, Vol. 21, Issue 1, 2007, p. 193-207.
-
Yu J. Bearing performance degradation assessment using locality preserving projections and Gaussian mixture models. Mechanical Systems and Signal Processing, Vol. 25, Issue 7, 2011, p. 2573-2588.
-
Chen H. X., Chua P. S. K., Lim G. H. Fault degradation assessment of water hydraulic motor by impulse vibration signal with wavelet packet analysis and Kolmogorov-Smirnov test. Mechanical Systems and Signal Processing, Vol. 22, Issue 7, 2008, p. 1670-1684.
-
Lu C., Sun Q., Tao L., et al. Bearing health assessment based on chaotic characteristics. Shock and Vibration, Vol. 20, Issue 3, 2013, p. 519-530.
-
Ming Y., Chen J., Dong G. Weak fault feature extraction of rolling bearing based on cyclic Wiener filter and envelope spectrum. Mechanical Systems and Signal Processing, Vol. 25, Issue 5, 2011, p. 1773-1785.
-
Jiang Y., Wu J., Zong C. An effective diagnosis method for single and multiple defects detection in gearbox based on nonlinear feature selection and kernel-based extreme learning machine. Journal of Vibroengineering, Vol. 16, Issue 1, 2014, p. 499-512.
-
Wang H., Chen J., Dong G. Feature extraction of rolling bearing’s early weak fault based on EEMD and tunable Q-factor wavelet transform. Mechanical Systems and Signal Processing, Vol. 48, Issue 1, 2014, p. 103-119.
-
Zhao H., Wang J., Xing J., et al. A feature extraction method based on LMD and MSE and its application for fault diagnosis of reciprocating compressor. Journal of Vibroengineering, Vol. 17, Issue 7, 2015, p. 3515-3526.
-
Wang H., Gao J., Jiang Z., et al. Rotating machinery fault diagnosis based on EEMD time-frequency energy and SOM neural network. Arabian Journal for Science and Engineering, Vol. 39, Issue 6, 2014, p. 5207-5217.
About this article

The authors declare that there is no any potential conflict of interests in the research. This study was supported by the Fundamental Research Funds for the Central Universities (Grant No. YWF-16-BJ-J-18) and the National Natural Science Foundation of China (Grant Nos. 51575021 and 51605014), as well as the Technology Foundation Program of National Defense (Grant No. Z132013B002).
