Abstract
The active car suspension system is presented here to suppress the vibration of the car by applying proportional derivative (PD) and positive position feedback (PPF) controllers with time delay. The control signal output of the controller is applied electrically to the magneto-rheological (MR) damper or Electrical-rheological (ER) damper which is attached parallel to the passive components to improve the suppression of the vibration. The electrical control signal is produced by electronic circuits or programmable logic controller and the two-position sensor feedback signal which are connected to the controller. The approximate solutions of PD and PPF suspension systems are obtained by applying multiple time scales perturbation method. The effects of parameters variation of both the system and the controllers are investigated to achieve the best performance. Simulation results show good performance of the designed controllers.
1. Introduction
In the last decade, active and semi-active suspension systems for automobiles have taken significant interest. The ideal suspension vehicle system must be able to separate physically the car body from the wheels of the car to avoid the road irregularities. The purpose of car suspension system is to improve ride comfort, road holding, long life and stability of vehicles. The types of suspension systems are passive, semi-active and active. Passive suspension systems are those used in a current automobile using passive components as damping elements and fixed rates springs. The passive suspension is able to store energy via a spring and dissipate it via a damper. It is an open loop control system, and its design achieves specific conditions only. The problem of passive suspension is using heavily damped or too hard suspension at irregularities road. If it is lightly damped or soft suspension the stability of the vehicle is reduced in turns, change lane or the car swing. So, the performance of the passive suspension depends on the road profile [1, 2].
The active suspension system can be used for providing a comfortable ride and good handling within a reasonable range of deflection. In the past few decades, a large number of researchers have been attracted to active vehicle suspensions, and comprehensive surveys on related research are found in publications [3, 4].
Practically, the actuators in active suspension systems supply additional forces. The feedback signals which are measured by position sensors attached to the vehicle. The controller output signal controls the actuator to get the additional force for suppressing the vibration of the passive elements. Several control schemes are used for controllers such as fuzzy control [5], optimal control [6, 7], adaptive control [8], linear quadratic regulator controller (LQR) [9], mixed H2/H∞ control [10], neural network [11], fuzzy PID controller [12], and robust control [13]. In refs. [14, 15] the magneto-rheological (MR) or Electrical-rheological (ER) damper are used for adding additional force to the system for suppressing the vibration of passive elements according to the electrical control signal.
In this paper, proportional derivative (PD) controller and positive position feedback (PPF) controller with time delay are investigated. The innovation is showing the effect of both controllers for quarter car model. The positive position feedback (PPF) controller is used effectively for vibration suppression for many dynamical systems either linear or nonlinear, which show their efficiency and feasibility in practice. Many researchers used PPF controller for vibration reduction in other systems such as, where the authors in ref. [16] presented slewing and vibration control of a single link flexible manipulator. Adaptive positive position feedback controller for actively absorbing energy in acoustic cavities [17]. A study for adaptive control of flexible structures using modal positive position feedback controller is presented in ref. [18]. Optimal vibration control with modal positive position feedback controller is discussed in ref. [19]. Dynamic compensation for control of a rotary wing unmanned aerial vehicle (UAV) is introduced in ref. [20]. A time-delayed PD controller is applied to this system to suppress the undesirable vibration of the car subject to excitation due to road profile irregularities.
The aim of this study is to develop a controlled suspension system of the vehicle to achieve stability and comfort for passengers. To achieve that goal, the design of a quarter-vehicle model is suggested by applying two modes of controller’s PD and PPF with time delay for suppressing the vibration from the passive nonlinear elements in the suspension system. Perturbation analysis was performed to obtain the analytical solutions of PD and PPF controllers systems. The stability analysis is tested by using the eigenvalues of the Jacobin matrix. The frequency response curves and amplitude curves of the systems are obtained and compared with the numerical solution.
2. Quarter car suspension system model
Fig. 1(a) shows the model of quarter car with passive suspension components and the hysteretic nonlinear force due to the passive damper and spring. The model consists of a car passive components and the MR damper actuator. As a PLC or embedded system, the actuator works by the electrical signal which produced by the electronic controller to improve the suspension of the vibration. The feedback signals are measured by attaching two displacement sensors in the car. The equation of model is:
where and:
Putting as the relative vertical displacement, Eq. (1) can be written as:
where:
Fig. 1The quarter-car model
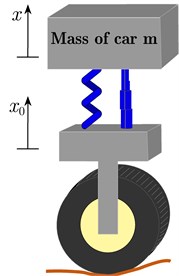
a) Passive suspension
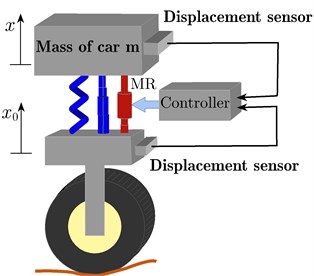
b) Active suspension
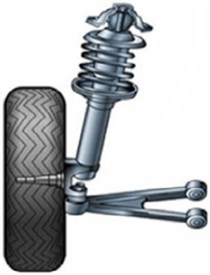
c) Practical suspension
The dimensionless equation of motion at a scaled time variable can be expressed as:
where:
Fig. 1(b) shows the active suspension system with adding the controlled damper MR or ER damper and the control unit with measuring the feedback signal vertical displacement. The PPF and PD are added to suppress the vibration of the system.
The PD controller system is represented by y variable and the PPF controller by , variables. The nonlinear differential equation with PD controller is expressed by:
where , are times delay of the control signals.
Fig. 2(a) shows a block diagram describing Eq. (5).
The nonlinear differential equation with PPF controller as a second order controller is expressed by:
where , are times delay of the feedback and the control signal, resectively.
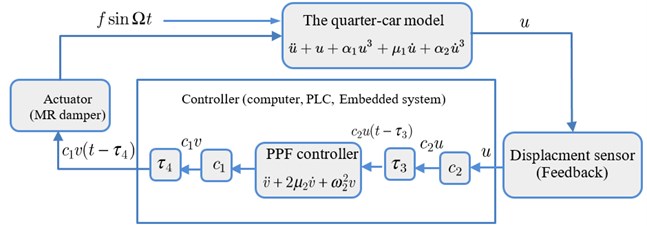
Fig. 2(b) shows a block diagram describing Eqs. (6-7).
Fig. 2The block diagram of: a) PD system, b) PPF system
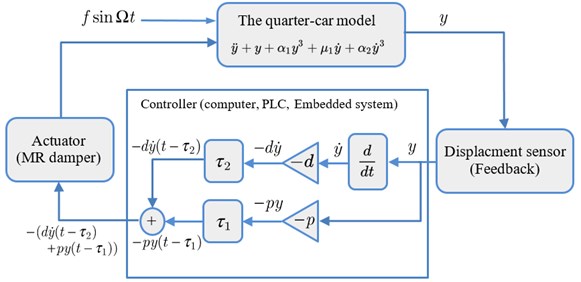
a)
b)
3. Perturbation analysis
The approximate solutions of the PD and PPF controllers with time delays are obtained by applying the multiple timescales perturbation method [21] by scaling the parameters of the both systems as follows:
The solution forms of PD controller from Eq. (5) are:
The solution forms of PPF controller from Eqs. (6-7) are:
3.1. PD controller
The amplitude-phase modulating equations of the PD controller at primary resonance 1 are:
Since and then, the autonomous system of differential equations takes the form:
At the steady stare response, we have:
Substituting Eq. (18) in Eqs. (16) and (17), and after some mathematical simplifications we obtain the frequency-response equation of the system PD controller at steady state in a closed form as follows:
3.2. PPF controller
The amplitude-phase modulating equations of PPF controller at simultaneous resonance 1 and 1 are:
where , are the phases of the system and controller, respectively. Let:
Differentiate Eq. (24) w.r.t.t yields:
So, the autonomous system of differential equations takes the form:
At the steady state response, we have:
Substituting Eq. (30) into (26) to (29), we get:
By eliminating Eqs. (31-34) we obtain the frequency-response equations of the system at steady state in the closed form as follows:
4. Stability analysis
The stability of the equilibrium solution can be investigated by checking the sign of eigenvalues of the Jacobian matrix.
4.1. PD controller
Let we assume:
where , are the solutions of Eqs. (16-17) at steady state and , are the perturbed solutions whose are small compared to , . Substituting Eq. (37) into (16), (17) and keeping only the linear terms in , to obtain:
where:
Hence, the stability of the steady-state solution can be deduced depending on the sign of eigenvalues of the Jacobian matrix obtained from Eq. (38).
4.2. PPF controller
Let:
where , are the solutions of Eqs. (26-29) and , are the perturbation solutions whose are small compared to , . Substituting Eq. (37) into (26) to (29) and keeping only the linear terms, one obtains:
where for are showed in the appendix. The stability of the steady stat solution depends on the sign of eigenvalues of the Jacobian matrix .
5. Results and discussions
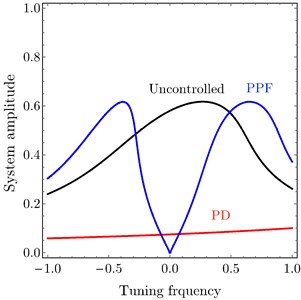
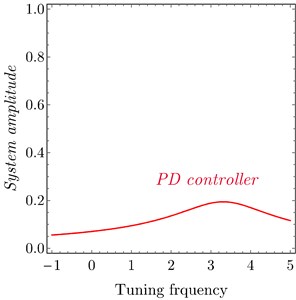
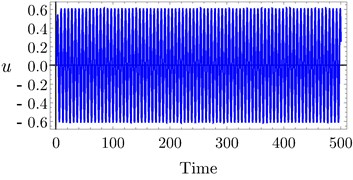
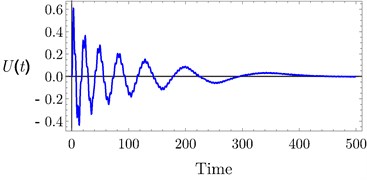
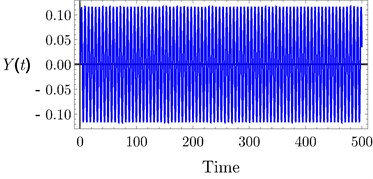
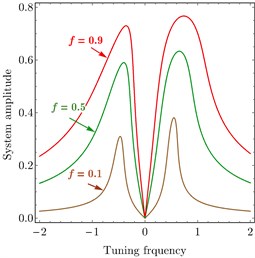
The analytical and numerical curves with time history are investigated to discuss the output forms of the system with the PD and PPF controllers. The selected values for the system parameters are given by 240, 1.6×10⁵ N/m, 3×10⁵ N/m3, 250 Ns/m, 25 Ns/m3, 1, 0.001, 1, 0.1, 0.025 , 3 and 0.5, unless specifying otherwise. The dashed lines represent the unstable solutions while the solid lines represent the stable solutions. Frequency response curves (FRC) of PD and PPF controllers and uncontrolled system are shown in Fig. 3(a). The uncontrolled curve slightly tilted to the right side under the influence of nonlinear terms. This result has confirmed by time history response in Fig. 4(a), such that the vibration at high amplitude doesn’t give the passenger comfort. Our task is to avoid this case. In Fig. 3(a) the PPF controller output is divided into two peaks. The minimum amplitude appears at steady state when tuning frequency 0.0, i.e., when 1. Hence, the controller is able to suppress the vibration of the car at or near the simultaneous resonance. The time history in Fig. 4(b) confirms that the steady state amplitude tends to zero and hence improvement of ride comfort and good leveling are provided. PD controller output amplitude is shown also in Fig. 3(a) and time history at Fig. 4(c) efficiently reduced the amplitude and the curve become near to be linear, and suppress the vibration of the car body efficiently. For large scale of the PD controller output Fig. 3(b) observed that at small tuning frequency we have a small magnitude of the amplitude. Fig. 4(c) illustrates the time history of the PD controller which observed that the amplitude decreased from 0.6 to 0.1.
Fig. 3FRC a) system amplitude versus tuning frequency of the uncontrolled system, PD controller and PPF controller, b) PD controller at τ1=τ2=τ3=τ4= 0
a)
b)
Fig. 4Time history: a) uncontrolled system, b) PPF controller, c) PD controller at τ1=τ2=τ3=τ4= 0
a)
b)
c)
Fig. 5FRC numerical simulation of system amplitude versus tuning frequency of the uncontrolled system, PD controller and PPF controller
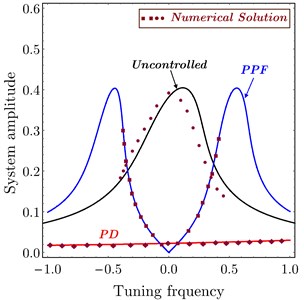
Fig. 5 illustrates a comparison between the approximate analytic solution and the numerical solution. It is shown that all numerical curves are in a good agreement with the analytical solution which confirms the validation of the obtained FRC frequency response curve. The region in a dashed box under the curve shows the possible region of frequency tuning.
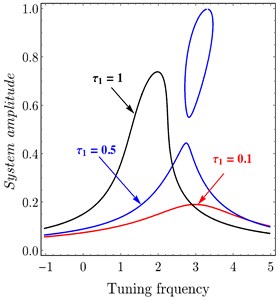
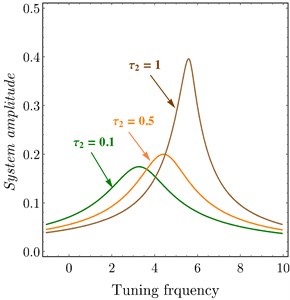
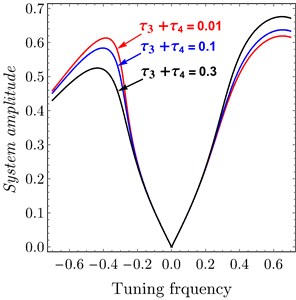
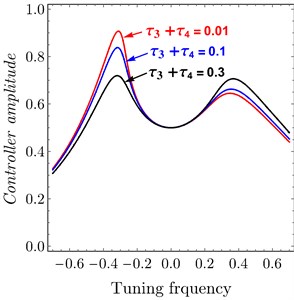
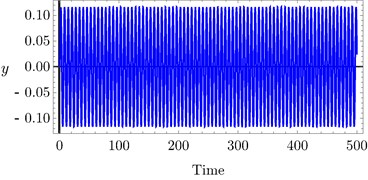
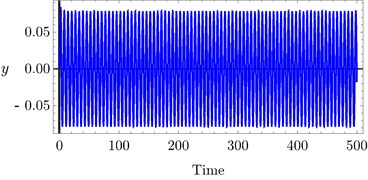
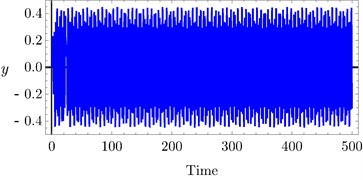
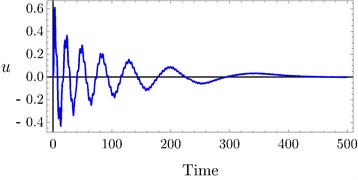
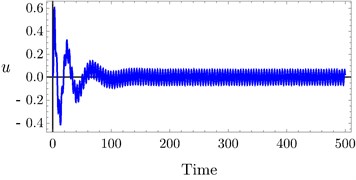
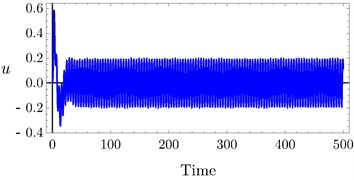
The effects of variation of time delays and on the PD controller are shown in Fig. 6 and Fig. 7 shows the effects of variation of time delays and on the PPF controller. It is clear that as time delays increase the amplitude of the system increases and the system go to be unstable, time history response curves of PD and PPF in Figs. 8 and 9 confirm this result.
Fig. 6System amplitude versus tuning frequency of PD controller at a) τ1= 0.0, b) τ2= 0.0
a)
b)
Fig. 7FRC system amplitude versus tuning frequency of variation of time delay to PPF controller: a) system, b) controller
a)
b)
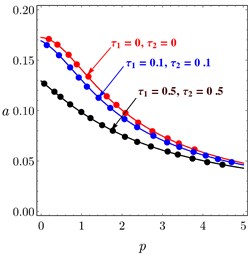
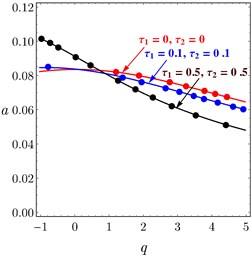
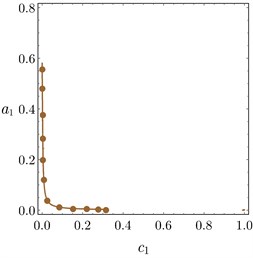
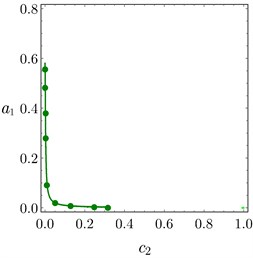
The relations between PD controller , parameters and PPF controller , parameters and the amplitude of the system are introduced in Fig. 10. It is noted that when the controller parameter increased the amplitude of the system decreased, it is the aim of the controller to suppress the vibration of passive damper. In addition, it is observed that the numerical simulation is in a good agreement with the analytical solutions.
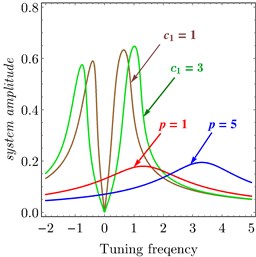
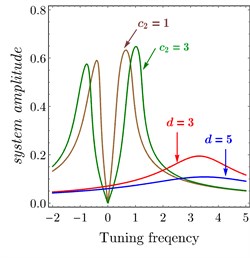
Fig. 11 confirms the result from Fig. 10, Figs. 11(a)-11(b) show FRC of the variation of and related to PPF controller at 0.04, 0.04. It observed that the bandwidth became wider by increasing and , the amplitude of right peak increased and left peak decreased and the amplitude is zero at 0.0 or . Also, Figs. 11(a)-11(b) show FRC of the variation of and related to PD controller at 0.1, 0.1. It is observed that as or increased the amplitude of the system decreased.
Fig. 8Time history of PD controller at a) τ1= 0.1, τ2= 0.1, b) τ1= 0.4, τ2= 0.4, c) τ1= 0.7, τ 2 = 0.7
a)
b)
c)
Fig. 9Time history of PPF controller at a) τ3= 0.0, τ4= 0.0, b) τ3= 0.03, τ4= 0.03, c) τ3= 0.1, τ4= 0.1
a)
b)
c)
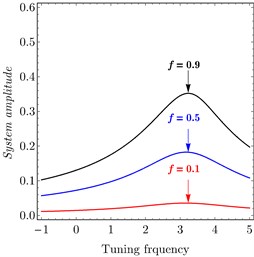
Fig. 12 declares the variation of the excitation force . Fig. 12(a) shows variation of PD controller. It is clear that when decreased the relation tends to be linear and system amplitude decreased to be zero. Fig. 12(b) shows the variation of PPF controller. It is noted that as increased the amplitude of the system increased. It is important to show that the minimum amplitude appears at 0.0 which proves the effectiveness of the controlled.
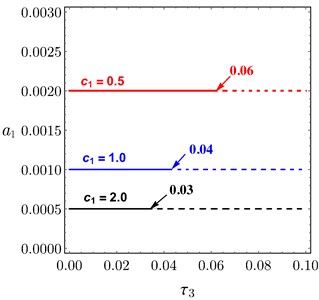
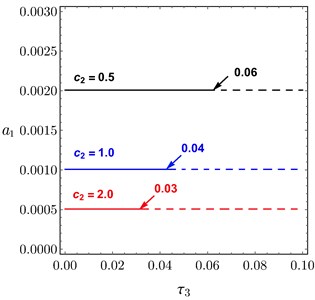
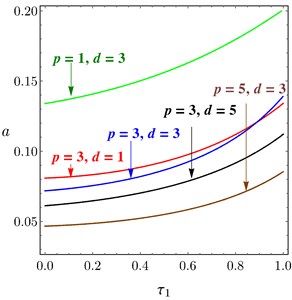
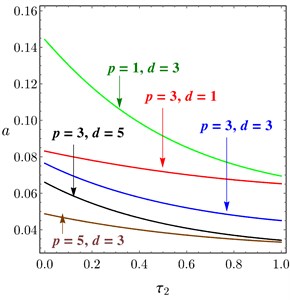
Fig. 13 illustrates the relation between the amplitude of the system and the time delay at 0.0 according to the different values of and of PPF controller. Figs. 13(a)-13(b) obtained the same result, if or increased the amplitude decreased and the unstable region is small, the relation of is the same of . For some different values of and , the system amplitude of PD controller drawn versus and in Fig. 14(a) and Fig. 14(b), respectively. It is shown that, as and increased the amplitude of the system decreased.
Fig. 10Amplitude system curves versus: a) proportional gain of PD controller, b) derivative gain of PD controller, c) parameter of PPF controller, d) feedback signal gain of PPF controller
a)
b)
c)
d)
Fig. 11FRC of variation to controller parameters: a) c1 and p, b) c2 and d
a)
b)
Fig. 12FRC of variation parameter: a) PD controller, b) PPF controller
a)
b)
Fig. 13Amplitude curves of PPF controller versus τ3 at different values of: a) c1, b) c2
a)
b)
Fig. 14Amplitude curves of PD controller, at different values of p and d, versus: a) τ1, b) τ2
a)
b)
6. Conclusions
Suspension systems serve a dual purpose, contributing to the vehicle’s road holding or handling and braking for good active safety, driving pleasure, keeping vehicle occupants comfortable and reasonably well isolated from road noise, bumps, and vibrations, etc.
The design of a quarter-vehicle model is investigated by applying the two models of controllers, PD and PPF, with time delays to suppress the vibration from the passive nonlinear element in the car suspension system. Passive elements which can suppress the vibration by giving an electrical control signal to the MR damper or ER damper is attached parallel to the passive damper and spring. The control signal can be investigated by an electronic circuit or programmable logic controller.
The main conclusion of this work is that we can use the advantages of two controllers and implement these equations in a program in digital controller and put this device in the car. Suppressing the vibration is done by the actuator which is operated by the electrical signal from the controller. The output voltage or current from the controller is adjusted by either the PD controller or PPF controller. The designed program for digital controller is dependent on the calculations of PD and PPF systems equations. At small tuning parameter or equal zero, the output of the controller is taken from PPF calculations. While at higher values of tuning parameter the output is taken from PD controller, hence we used the advantages of both controllers and the vibration reduction is done at all tuning frequency values.
References
-
Siewe Siewe M. Resonance, stability and period-doubling bifurcation of a quarter-car model excited by the road surface profile. Physics Letters A, Vol. 374, 2010, p. 1469-1476.
-
Claudiu Valentin Suciu, Tsubasa Tobiishi, Ryouta Mouri Modeling and simulation of a vehicle suspension with variable damping versus the excitation frequency. Journal of Telecommunications and Information Technology, Vol. 1, 2012, p. 83-89.
-
Paschedag T., Giua A., Seatzu C. Constrained optimal control: an application to semiactive suspension systems. International Journal of Systems Science, Vol. 41, Issue 7, 2015, p. 797-811.
-
Göhrle C., Schindler A., Wagner A., Sawodny O. Design and vehicle implementation of preview active suspension controllers. IEEE Transactions on Control Systems Technology, Vol. 22, Issue 3, 2014, p. 1135-1142.
-
Ranjbar-Sahraie B., Soltani M., Roopaie M. Control of active suspension system: an interval Type-2 fuzzy approach. World Applied Sciences Journal, Vol. 12, Issue 12, 2011, p. 2218-2228.
-
Paschedag T., Giua A., Seatzu C. Constrained optimal control: an application to semi active suspension systems. International Journal of Systems Science, Vol. 41, Issue 7, 2010, p. 797-811.
-
Han S. Y., Tang G. Y., Chen Y. H., Yang X. X., Yang X. Optimal vibration control for vehicle active suspension discrete-time systems with actuator time delay. Asian Journal of Control, Vol. 15, Issue 6, 2013, p. 1579-1588.
-
Zhang Jing, Wang Jue Adaptive tracking control of vehicle suspensions with actuator saturations. 34th Chinese Control Conference, 2015, p. 8051-8056.
-
Wu J. L. A simulations mixed LQR/H∞ control approach to the design of reliable active suspension controllers. Asian Journal of Control, Vol. 19, Issue 2, 2017, p. 415-427.
-
Orukpe P. E., Zheng X., Jaimoukha I. M., Zolotas A. C., Goodall R. M. Model predictive control based on mixed H2/H∞ control approach for active vibration control of railway vehicles. Vehicle System Dynamics, Vol. 46, 2008, p. 151-160.
-
Al-Holou N., Lahdhiri T., Joo D. S., Weaver J., Al-Abbas F. Sliding mode neural network inference fuzzy logic control for active suspension systems. IEEE Transactions on Fuzzy Systems, Vol. 10, Issue 2, 2002, p. 234-246.
-
Ahmed Abd El-Nasser S., Ali Ahmed S., Ghazaly Nouby M., El-Jaber Abd G. T. PID controller of active suspension system for a quarter car model. International Journal of Advances in Engineering and Technology, Vol. 8, Issue 6, 2015, p. 899-909.
-
Ervin Alvarez-Sánchez A quarter-car suspension system: car body mass estimator and sliding mode control. Iberoamerican Conference on Electronics Engineering and Computer Science, Procedia Technology, Vol. 7, 2013, p. 208-214.
-
Sariman M. Z., Hafiz Harun M., Mat Yamin A. K., Ahmad F., Yunos M. R. Magneto rheological fluid engine mounts: a review on structure design of semi active engine mounting. International Journal of Materials, Vol. 2, 2015, p. 6-16.
-
Palanisamy Senthilkumar, Karuppan Sivakumar Fuzzy control of active suspension system. Journal of Vibroengineering, Vol. 18, Issue 5, 2016, p. 3197-3204.
-
Shan J., Liu H., Sun D. Slewing and vibration control of a single-link flexible manipulator by positive position feedback (PPF). Mechatronics, Vol. 15, 2005, p. 487-503.
-
Creasy M. A., Leo D. J., Farinholt K. M. Adaptive positive position feedback for actively absorbing energy in acoustic cavities. Journal of Sound and Vibration, Vol. 311, 2008, p. 461-472.
-
Baz A., Hong J. Adaptive control of flexible structures using modal positive position feedback. International Journal of Adaptive Control and Signal Processing, Vol. 11, 1997, p. 231-253.
-
Baz A., Poh S. Short communications optimal vibration control with modal positive position feedback. Optimal Control Applications and Methods, Vol. 17, 1996, p. 141-149.
-
Ahamed B., Pota H. R. Dynamic compensation for control of a rotary wing UAV using positive position feedback. Journal of Intelligent and Robotic Systems, Vol. 61, 2011, p. 43-56.
-
Nayfeh A., Mook D. Nonlinear Oscillations. Wiley, New York, 1995.
