Abstract
Gear break and pitting are two common faults in transmission system, when these two faults coexist and form a compound fault, the damage speed and frequency of gear transmission system will be greatly increased. Taking the gear fault-pitting compound fault as the object, the dynamic model of gear single fault and compound fault is established, and the vibration characteristics of gear single fault, pitting single fault and broken tooth-pitting compound fault signal are analyzed. The characteristic manifolds of the intrinsic dimension space in the case of gear single failure and compound fault are extracted by using the Laplacian Eigenmaps algorithm, the evolution trend of single fault and compound fault in the overlapping region of the feature space, the degree of correlation and the curvature of the fault circle core are analyzed and obtained. The study found that with the deepening of the fault severity, the overlapping area of fault circle between compound fault and single fault become smaller gradually, that is, the degree of correlation become weakened, tooth broken single fault and compound fault can be identified in mid-late stage of fault, while the pitting single fault and compound fault are in the late stage. The experimental results of gearbox compound fault correlation show that the conclusion of the simulation analysis is correct and effective, which provides a new idea for the diagnosis of mechanical complex faults.
1. Introduction
Gearbox, as one of the core parts of mechanical transmission system, is extremely prone to various faults due to the long run under harsh working environment. As a matter of fact, the fault does not often appear alone; the gear failures of broken teeth and pitting usually easily lead to broken teeth-pitting composite failures [1-4].
In recent years, many scholars are dedicated to extraction and recognition research of gear fault feature, and it has made a great achievement. For example, an integer wavelet transform is proposed by Lizhi Xiong, it shows that this scheme outperforms all of other existing RDH schemes in encrypted domain in terms of higher PSNR at the same amount of payload [5]. It is effective in diagnosing and classifying different states of gearbox in short time. A multichannel vibration data processing method that combination of time-frequency representation and Principal Component Analysis is to achieve more reliable information about local damage [6]. Structural minimax probability machine and incremental support vector learning is used by Bin Gu for fault recognition and ordinal regression [7, 8]. To solve complex optimization problems, a novel collaborative optimization algorithm is proposed by Wu Deng [9, 10]. Qing Tian also achieved good efficiency, cross-heterogeneous-database age estimation through correlation representation learning for early fault diagnosis in rotating machinery [11]. Fast overlapping communities detection algorithm based on structural clustering is provided by Tinghuai Ma and Yao Wang show that the method is superior to other methods in accuracy, efficiency, comparing with FastModurity and GN algorithm [12]. Beijing Chen and Jianhao Yang use Kernel quaternion principal component analysis to improve the QPCA as kernel QPCA (KQPCA) for processing nonlinear quaternion signals [13]. Self-adaptive artificial bee colony algorithm is proposed by Xue Y., and then achieve good results [14]. Robust dense reconstruction by range merging based on confidence estimation is proposed by Yadang Chen also can obtain good visual effects [15].
Gear teeth broken-pitting compound fault dynamics model and single failure dynamic model was established by ADAMS in the paper, and then simulation data was obtained, combination of manifold learning method (LE) and correlation analysis for fault diagnosis. The correlation characteristics of tooth broken-pitting compound fault and its two single faults are analyzed. Fault characteristics under different types and degree of faults are obtained, and the purpose of mutual recognition is achieved between compound faults and single faults, a new method is provided for fault diagnosis and prediction.
2. Extracting features manifolds of faults based on Laplacian eigenmaps algorithm
2.1. Principle of Laplacian eigenmaps algorithm
Laplacian eigenmaps algorithm can be relatively intuitive to achieve dimensionality reduction. The principle is that the high-dimensional data in the space after the very close to the point of mapping to low-dimensional space can also maintain a close distance from each other, and the Laplacian-Belatrami is used to construct the objective function corresponding to low-dimensional embedding, so as to achieve the goal of optimal low-dimensional embedding of high-dimensional data.
2.2. Laplacian eigenmaps algorithm
The LE, as a manifold learning algorithm that maintains local features, is mainly used to deal with data classification problems. It can be used to redraw high-dimensional images in low dimensional space and keep the essential features as much as possible. The Laplacian Eigenmaps core: if the very close distance between the two sample points and is less than the threshold of a certain set, you can conclude that the two points have edges in the neighborhood graph, and the simplified method is that gives it the value of weight is one, that is, 1, or 0. There are some basic steps of LE algorithm:
1) Selecting the number of neighbourhood points to construct the neighbourhood image . It is necessary to obtain the Euclidean distance between any sample point and the other point, assuming that the Euclidean distance between the sample point and the sample point is less than the threshold of a certain set, which can define the sample point is the nearest neighbor of the sample point , or in turn, the sample point is the nearest neighbor of the sample point , next, both and have edges in Fig. 1.
2) Given weight . If the and is neighbor, so we can define , or 0.
3) Calculate low-dimensional embedding . For , there is:
where is Laplacian matrix, , is the sum of the rows or columns of the value of weight in diagonal matrix, so . Add the constraint 1 to eliminate the effect of the scale factor. The problem of LE algorithm is transformed into optimization problem:
AS result, the low-dimensional embedding is the matrix made of eigenvector corresponding to the smallest eigenvalues:
3. Establishing and analysing ADAMS dynamic model of gear tooth broken-pitting
3.1. Based on ADAMS dynamic model of gear tooth broken-pitting
It is a key point to calculate the meshing stiffness of gears when it builds dynamic model of gear transmission system in ADAMS [16]. Many scholars have a deep research [17] and they all considered that it can effectively simulate the gear bending and torsional deformation through adding auxiliary gear and torsional spring [18-21].
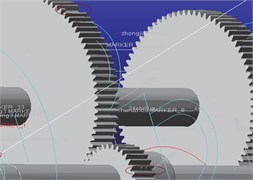
As shown in Fig. 1, the dynamic model of gear transmission system was built with normal state in ADAMS [22].
Fig. 1Dynamic model of gear transmission system
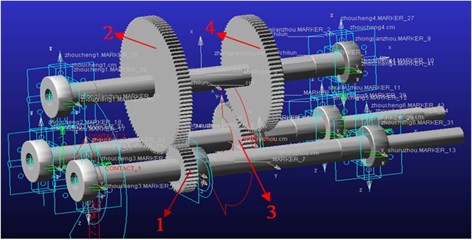
The gear transmission system was designed for double-stage driving. It concludes three shafts which contain input shaft, intermediate shaft, output shaft, and two pairs of gears where gear 1 meshed with 2 and gear 3 meshed with 4.
It will generate gear bending, torsional, and contact deformation in the mesh movement, and the contact deformation of the tooth surface can cause the change of meshing stiffness and damping. Then, based on the dynamic model of the gear transmission system in Fig. 1, the fault geometry is implanted in the solid model of the gear transmission system, which can effectively simulate the dynamic effects of gear tooth breakage and pitting failure through the contact algorithm in ADAMS software. It established dynamics model of single fault to broken teeth, pitting, and broken teeth pitting composite fault through changing the geometry in the three-dimensional entity model. Specifically, as shown in Fig. 2, four different degrees of broken gear failure include 1/5 broken teeth, 2/5 broken teeth, 3/5 broken teeth, and 4/5 broken teeth; four different kinds of gear pitting failure include pitting 1 which is to form a circle with a diameter of 4 mm, pitting 2 which is based on pitting 1 to form a diameter of 5 mm circle, pitting 3 which is based on pitting 2 more than a diameter of 6 mm circle, and pitting 4 which is in pitting 3 on the basis of more than a diameter of 7 mm circle. The composite fault is obtained by combining the broken tooth with the pitting failure, composite failure 1 is the combination of the broken tooth 1 and the pitting corrosion 1, and then the compound fault of different degrees can be obtained by analogy.
3.2. Time domain and frequency domain analysis
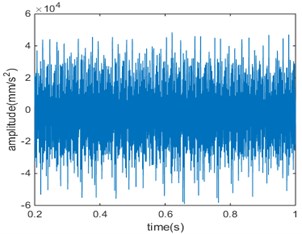
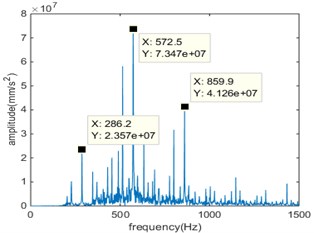
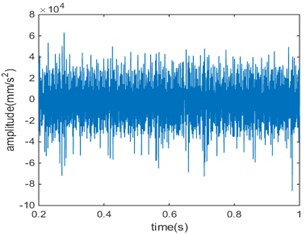
The simulation conditions are set up on the basis of establishing the compound fault dynamic model, both the driver and load are set to the step function, step (time, 0, 0, 0.2, driver and load), That is, 0 to 0.2 s is the speed and load loading process, after 0.2 s to achieve stability, the simulation time is 1 s. The step number is set to 16384, which means the sampling frequency is 16384 Hz. In the case of the same load and speed that the motor speed is 30 Hz and load is 1790 N·m, the time-frequency maps of the different-degree tooth-pitting compound faults are shown in Fig. 3-6.
Fig. 2Dynamics model of the gear broken teeth-pitting compound fault
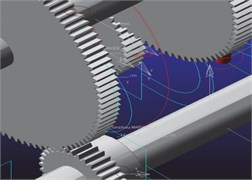
a) Composite fault 1 kinetic model
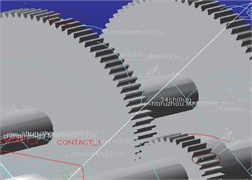
b) Composite fault 2 kinetic model
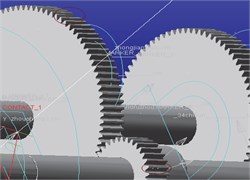
c) Composite fault 3 kinetic model
d) Composite fault 4 kinetic model
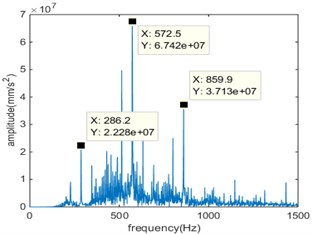
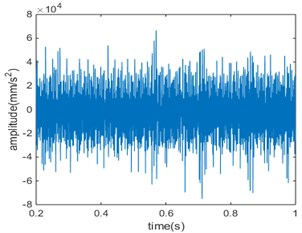
Fig. 3Compound fault 1 in time domain and frequency domain
a)
b)
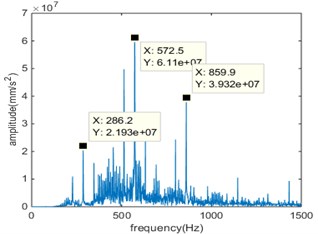
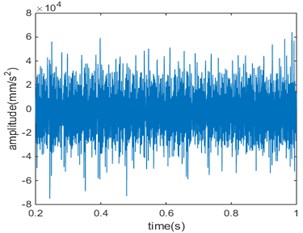
Fig. 4Compound fault 2 in time domain and frequency domain
a)
b)
As can be seen from the time domain diagram, the vibration signal of the gear has obvious periodicity. In the gear meshing process, there will be relatively large peak value, which shows that there is a shock component in the meshing process. With the deepening of the broken tooth-pitting compound, the amplitude of the signal is also significantly increased, indicating that the impact of the simulation signal has become more serious.
Fig. 5Compound fault 3 in time domain and frequency domain
a)
b)
Fig. 6Compound fault 4 in time domain and frequency domain
a)
b)
4. The correlation analysis of gear tooth broken-pitting compound fault and single fault
4.1. Fault data processing
On the basis of the above-mentioned data of broken tooth-pitting compound fault and single fault simulation data, the manifold learning method (LE) is used to reduce the dimension of the data, obtain the low-dimensional eigenvalue, and then fault cluster to get the fault circle. The low-dimensional distribution between the compound fault and the single fault is obtained, and the change of the overlapping area between the fault circle of the compound fault and the single fault and the change of the center of the fault clustering are observed. Repeat the above steps, you can get varying degrees of fault circle overlapping area and the center of the change, and then analyze the situation at different speeds, the final comparative analysis, get the corresponding results.
4.2. The correlation analysis of gear tooth broken-pitting compound fault and tooth broken single fault
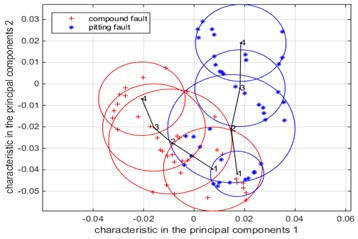
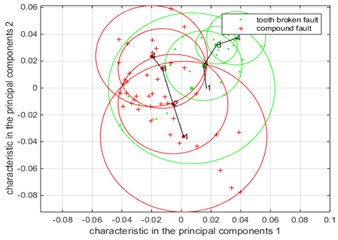
At the simulation speed of 10 Hz, 20 Hz, 30 Hz, according to the above steps to deal with broken teeth-pitting compound fault and broken single fault simulation data, the results shown below, in which the center of each figure 1, 2, 3, 4 correspond to the four severities of the fault.
The low-dimensional distribution of the vibration data analysis results of the broken tooth-pitting compound fault and the single-fault simulation of the broken tooth is shown in Fig. 7(a)when the simulation input speed is 10 Hz. It is obvious from Fig. 7(a) that the compound fault has a significant change with the fault level, and the fault circle is relatively concentrated for the tooth broken fault, and the fault feature is obvious, which is consistent with the fact that this is due to the single fault of the broken tooth only tooth area changes, the extraction of the fault feature value of the degree of little impact.
In the simulation speed of 20 Hz, the broken tooth-pitting compound fault and broken single fault simulation vibration data analysis results of the low-dimensional distribution summary map, as shown in Fig. 7(b). It can be seen from Fig. 7(b) that the overlapping area of the fault circle has obvious change, and a tendency to become smaller until there is no overlapping area with the increase of the fault degree. It is shown that the degree of correlation between the single fault and the compound fault is weakened, that is, the degree of influence of the single fault on the compound fault becomes smaller, which is similar to the previous conclusion.
Fig. 7The Summary of low-dimensional distribution of compound faults and single faults under different fault levels when the simulation input speed is 10 Hz, 20 Hz, 30 Hz
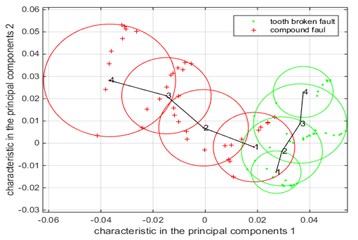
a) Rotate speed is 10 Hz
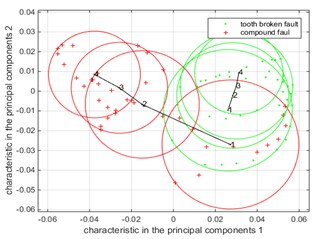
b) Rotate speed is 20 Hz
c) Rotate speed is 30 Hz
It is obvious that the curve curvature at 20 Hz is greater than the curvature of the curve when the speed is 10 Hz, and the center of the fault circle changes more in comparison with the change of the center line of the compound fault and single fault between Fig. 7(a) and Fig. 7(b), that is, changes in fault characteristics are more obvious. When the speed increases, the impact of the gear fault on the gear is significantly increased, the energy generated also increased, the extracted fault feature value changes more obvious.
When the simulation input speed is 30 Hz, the low-dimensional distribution of the vibration analysis data of the broken tooth-pitting compound fault and the single fault of the broken tooth is shown in Fig. 7(c). From the figure we can see that in the fault of a single fault, the fault circle is relatively concentrated, the fault feature is more obvious, which is the previous two kinds of speed to get the conclusion is consistent.
It is obvious that the curve curvature at 20 Hz is greater than the curvature of the curve at 10 Hz, but less than when the rotate speed is 30 Hz, and the change of the single fault is more obvious, because as the speed increases, the impact of the gear fault on the gear increases, resulting in increased energy, extracted the fault feature value is more obvious, so the center of fault circle changes more obvious, that curve curvature changes are more obvious.
In general: with the deepening of the fault, the overlapping area between the fault circle of the broken tooth-pitting compound fault and the single fault is gradually becoming smaller, and the degree of association between the faults is gradually weakened, compound faults and broken tooth faults can achieve good recognition results in the middle and late stages. With the increase of the rotate speed, the change of the center line of the fault circle with different degree of broken tooth-pitting compound fault and that of single fault is more obvious, that is, the curvature of the curve increases gradually, and the change of fault characteristic becomes more obvious. The change of the whole fault characteristic is more obvious for the single fault of the broken teeth, especially in the early stage of the fault and the later, the fault feature is more obvious. Finally, combined with eigenvalue of fault, as long as you know eigenvalue of fault and where the fault circle in the area and the distances of center of fault circle, we can estimate the compound fault or a single fault and fault degree, so as to provide a new method for the diagnosis and prediction of compound fault and single fault.
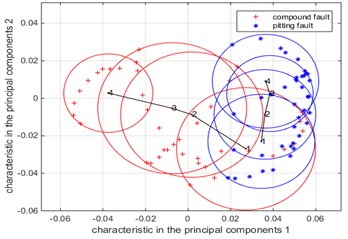
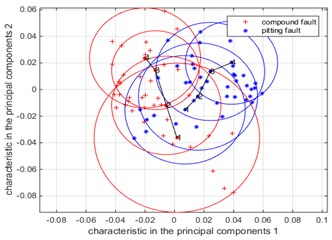
4.3. The correlation analysis of gear tooth broken-pitting compound fault and pitting single fault
In the simulation speed of 10 Hz, 20 Hz, 30 Hz, according to the above steps to deal with tooth-pitting compound fault and pitting single fault simulation data, the results shown below, in which the center of each figure 1, 2, 3, 4 correspond to the four severities of the fault.
Fig. 8The Summary of low-dimensional distribution of compound faults and pitting single faults under different fault levels when the simulation input speed is 10 Hz, 20 Hz, 30 Hz
a) Rotate speed is 10 Hz
b) Rotate speed is 20 Hz
c) Rotate speed is 30 Hz
Fig. 8. The Summary of low-dimensional distribution of compound faults and pitting single faults under different fault levels when the simulation input speed is 10 Hz, 20 Hz, 30 Hz.
In the simulation of 10 Hz, the low-dimensional distribution of the analysis results of the vibration data of the broken tooth-pitting compound fault and pitting single fault simulation is shown in Fig. 8(a). It can be seen from Fig. 8(a) that the broken teeth-pitting compound faults and pitting faults all deepen with the degree of fault, the overlapping area of the fault circle has obvious change, from the presence of overlap to the last overlapping area is zero. The fault circle area is similar to the overall variation of the faulty circle area of the compound fault for the pitting failure, the fault circle of single fault is more concentrated than the compound fault. It shows that the pitting failure and the compound fault are related greatly, that is to say, pitting has a great influence on the compound faults. Due to the change of pitting failure degree is the depth and quantity of pitting holes. The fault characteristic value of pitting is larger than that of tooth broken single fault.
In the simulation speed of 20 Hz, the low dimensional distribution of the compound vibration and pitting failure simulation vibration data analysis results are shown in Fig. 8(b). It can be seen from Fig. 8(b) that with the increase of the fault degree, the overlapping area of the fault circle has obvious change, and the overlapping area tends to become smaller gradually until there is no overlapping area, it shows that the degree of association between pitting single fault and compound fault is weakened, that is, the effect of pitting single fault on compound fault becomes smaller. Compared with the fault circle of tooth broken single fault, the overall variation of the faulty circular area of the pitting single fault is obvious, which is similar to the change of the compound fault and it consistent with the conclusion when the speed is 10 Hz.
Compared with the fault center curve of the compound fault and pitting single fault in Fig. 8(a) and Fig. 8(b), it can be seen that the curvature change of the compound fault curve is increased, which is consistent with the previous analysis. The curve curvature at 20 Hz and the curve curvature change at 10 Hz are not obvious for pitting a single fault, indicating that the effect of speed on the pitting is not obvious.
When the simulation input speed is 30 Hz, the low-dimensional distribution of the analysis results of the vibration data of the broken tooth-pitting compound fault and pitting single fault simulation is shown in Fig. 8(c). It can be seen from Fig. 8(c) that the variation of the fault circle area of the pitting single fault is similar to that of the compound fault. In addition to pitting single fault 1, the curvature change of the compound fault curve is consistent with the previous analysis in comparison with the change of the center of the fault in the compound fault and pitting single fault in Fig. 8(a), Fig. 8(b) and Fig. 8(c). The curvature changes of the curves among the three different speeds are basically the same for pitting single fault, and there is no obvious change.
In general, with the deepening of the degree of fault, the overlapping area of the fault circle of tooth broken-pitting compound fault and pitting single fault decrease gradually to zero, the correlation degree between them gradually become weak, and can well identify fault in late fault. With the increase of the speed, the curvature of the center line of the fault circle increases gradually, and the change of the fault characteristics is more obvious. The curvature of the center line of fault circle is not obvious for pitting failure, but in the early stage of the fault, the single fault feature of pitting is more obvious than the compound fault. Finally, the combination of eigenvalue of fault, as long as you know eigenvalue of fault and where the fault circle in the area and the distances of center of fault circle, you can determine whether the compound fault or a single fault and the degree of failure.
5. Experiment
It takes fault simulation test bench of the American Quest Spectra company as object, and the vibration signal was collected by PULSE acquisition system. The end of the gearbox output axle connected to the brake, which changes the braking torque by adjusting the current with the electromagnetic brake and the sensor layout as shown in Fig. 9. The gear has fault of tooth broken and pitting are used to do experiment are shown in Fig. 10-12.
Setting experimental conditions, the speed of the motor respectively is 10 Hz, 20 Hz, and 30 Hz, the current electromagnetic brake is set to 55 mA, where the brake torque is 1790 N·m, and sampling frequency of acquisition system is 16384 Hz, the acquisition time is 10 s, and pulley transmission ratio is 1:3.56.
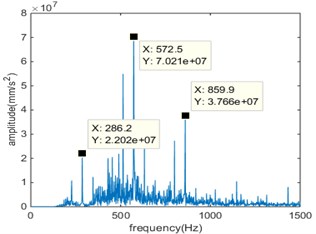
Four different degrees of broken teeth, pitting single fault, and broken teeth-pitting composite failure are obtained by PULSE acquisition system. The vibration signals of different degrees of fault are obtained by experiment, the frequency amplitude in meshing frequency, and multiple frequency place to be obtained after engaging Fourier transform.
Fig. 9Sensor arrangement
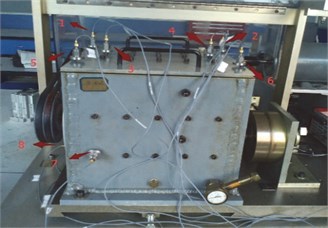
Fig. 10Inner structures of gearbox
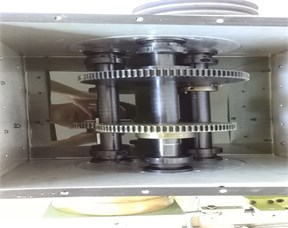
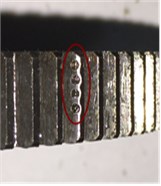
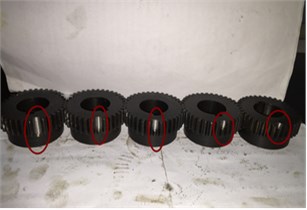
Fig. 11Pitting fault of four different degree
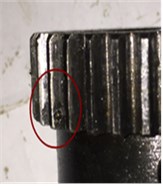
a)
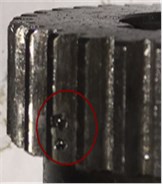
b)
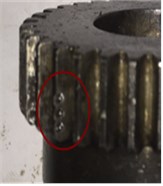
c)
d)
Fig. 12Tooth broken fault of four different degree
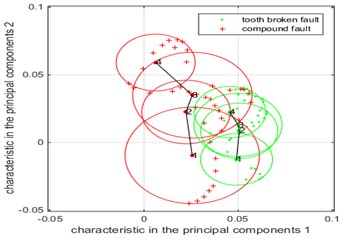
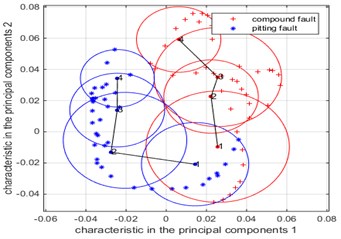
The data at motor speed of 30 Hz are obtained by experiment, and the data processing and analysis are carried out according to the previous steps. The low dimensional distribution of the broken teeth-pitting compound fault and the single fault of broken teeth are obtained, as shown in Fig. 13(a).
Fig. 13The Summary of low-dimensional distribution of compound faults and single faults under different fault levels when the speed of motor is 30 Hz
a) Compound fault and tooth broken single fault
b) Compound fault and pitting single fault
In Fig. 13(a), the center of the center is 1, 2, 3, 4, which correspond to the four severities of the fault. It is obvious from Fig. 13(a) that with the increase of the fault degree, the fault circle of the compound fault has obviously changed, and the fault circle area of the single fault is relatively concentrated, and the fault characteristic is more obvious. In the case of failure level 1, the area of the fault circle is large regardless of the single fault or the compound fault, because in this case the degree of failure is not very serious, and the noise has a serious effect on the fault. Through the analysis of the experimental data, the conclusions obtained are consistent with the conclusions obtained by simulation. Therefore, this conclusion is verified by experiments.
Through the experiment, the data at the motor speed of 30 Hz are obtained, and the previous step is repeated to obtain a summary of the low-dimensional distribution of the broken tooth-pitting compound fault and the pitting single fault, as shown in Fig. 13(b).
The low-dimensional distribution between the compound fault and the tooth broken single fault in four degrees are corresponding to 1, 2, 3, and 4 in Fig. 13(b), it can be see obviously from Fig. 13(b), with the deepening of degree of fault, the overlapping area of fault circle become smaller gradually, the change that area of fault circle for the pitting fault is similar to compound fault, while fault circle of tooth broken single fault is relatively concentrated compared with compound fault, it illustrates that the degree of correlation pitting single fault is big for compound fault, that is, it has a big influence on compound fault. Since the change that degree of pitting single fault is increasing the depth and the number, the extracted eigenvalue of pitting fault whose change is bigger than tooth broken single fault. The conclusion is obtained by analyzing experimental data is consistent with simulation, so this conclusion is verified by experiments.
In order to further prove the validity of the Laplacian Eigenmaps algorithm for the correlated analysis of gear tooth broken-pitting compound fault, the method is compared with the improved EMD method based on the optimized rational Hermite interpolation approach. The correlated characteristics between different degrees of broken teeth-pitting compound faults and single faults are correct if they are consistent with the previous ones, otherwise they are wrong. We test the sample based on the 20 groups of data that was collected by experiment, the recognition rates of two methods are shown in Table 1.
Aiming at the 20 sets of test samples, the recognition rate between the tooth broken-pitting compound fault and the single fault was obtained by using each method, and the criterion was adopted as the criterion. Then, the recognition rate of the overall fault of each algorithm is integrated, whether the compound fault and single fault recognition rate or the overall recognition rate, the Laplacian Eigenmaps algorithm is better than EMD. The validity of this method is proved to be valid for the analysis of the correlation between tooth broken-pitting compound fault and single fault of pitting or tooth broken.
Table 1The recognition rates of two method
Types of fault | Method | Test sample(groups) | Correct | Error | Recognition rates |
Tooth broken-pitting compound fault and tooth broken single fault | EMD | 20 | 15 | 5 | 75 % |
Laplacian Eigenmaps | 19 | 1 | 95 % | ||
Tooth broken-pitting compound fault and pitting single fault | EMD | 20 | 16 | 4 | 80 % |
Laplacian Eigenmaps | 19 | 1 | 95 % | ||
Sum total | EMD | 40 | 31 | 9 | 77.5 % |
Laplacian Eigenmaps | 38 | 2 | 95 % |
6. Conclusions
The new method that the correlation analysis of gear tooth broken-pitting compound fault based on Laplacian Eigenmaps is provided, according to the simulation, experimental results and analyze them, finally making these conclusion:
1) The overlapping area between the single fault and the compound fault gradually becomes smaller, the degree of association becomes weaker with the deepening of the fault, and the single fault and the compound fault can be well recognized in the early stage of the fault. Single failure and compound fault can achieve good recognition in the late stage of fault.
2) In general, the single fault of the broken tooth is relatively concentrated, the change of fault characteristic becomes more obvious. The change of the whole fault characteristic is more obvious for the single fault of the broken teeth, especially in the early and late stages of the fault. There are obvious changes in the area of fault circle of the pitting single fault and the compound fault. The single fault of the pitting is only obvious in the early stage of fault.
3) With an increase in the speed, broken single fault and compound fault circle center of the curvature of the connection are gradually becoming larger, and pitting a single fault is basically no change. Compare with low-dimensional distribution of different speed, compound faults and tooth broken single faults can more be recognized when the speed is low, compound faults and pitting single faults can more be recognized when the speed is high.
Combined with eigenvalue of fault, as long as you know eigenvalue of fault and where the fault circle in the area and the distances of center of fault circle, we can estimate the compound fault or a single fault and fault degree. But in fact, there will be some error, so we need combine with the curved information under different type and degree of fault to identify the fault finally.
References
-
Staszewski W. J., Worden K., Tomlinson G. R. Time-frequency analysis in gearbox fault detection using the Wigner-Ville distribution and pattern recognition. Mechanical Systems and Signal Processing, Vol. 11, Issue 5, 1997, p. 673-692.
-
Li H., Zhang Y., Zheng H. Application of Hermitian wavelet to crack fault detection in gearbox. Mechanical Systems and Signal Processing, Vol. 25, Issue 4, 2011, p. 1353-1363.
-
Bin G., Li X., Wu J., Gao J. Virtual dynamic balancing method without trial weights for multi-rotor series shafting based on finite element model analysis. Journal of Renewable and Sustainable Energy, Vol. 6, Issue 4, 2014, p. 042014.
-
Saavedra P. N., Rodriguez C. G. Accurate assessment of computed order tracking. Shock and Vibration, Vol. 13, Issue 1, 2006, p. 13-32.
-
Lizhi Xiong, Zhengquan Xu, Yun Qing Shi An integer wavelet transform based scheme for reversible data hiding in encrypted images. Multidimensional Systems and Signal Processing, 2017, https://doi.org/10.1007/s11045-017-0497-5.
-
Jacek Wodecki, Pawel Stefaniak, et al. Combination of principal component analysis and time-frequency representations of multichannel vibration data for gearbox fault detection. Journal of Vibroengineering, Vol. 18, Issue 4, 2016, p. 2167-2176.
-
Bin Gu, Xingming Sun, Victor Sheng S. Structural minimax probability machine. IEEE Transactions on Neural Networks and Learning Systems, Vol. 28, Issue 7, 2017, p. 1646-1656.
-
Bin Gu, Victor Sheng S., Keng Yeow Tay, Walter Romano, Shuo Li Incremental support vector learning for ordinal regression. IEEE Transactions on Neural Networks and Learning Systems, vVol. 26, Issue 7, 2015, p. 1403-1416.
-
Wu Deng, Huimin Zhao, Li Zou, Guangyu Li, Xinhua Yang, Daqing Wu A novel collaborative optimization algorithm in solving complex optimization problems. Soft Computing, Vol. 21, Issue 15, 2017, p. 4387-4398.
-
Wu Deng, Huimin Zhao, Xinhua Yang, Juxia Xiong, Meng Sun, Bo Li Study on an improved adaptive PSO algorithm for solving multi-objective gate assignment. Applied Soft Computing, Vol. 59, 2017, p. 288-302.
-
Qing Tian, Songcan Chen Cross-heterogeneous-database age estimation through correlation representation learning. Neurocomputing, Vol. 238, 2017, p. 286-295.
-
Ma Tinghuai, Wang Yao, Tang Meili, Cao Jie, Tian Yuan, Abdullah Al Dhelaan, Mznah Al Rodhaan LED: a fast overlapping communities detection algorithm based on structural clustering. Neurocomputing, Vol. 207, 2016, p. 488-500.
-
Chen Beijing, Yang Jianhao, Jeon Byeungwoo, Zhang Xinpeng Kernel quaternion principal component analysis and its application in RGB-D object recognition. Neurocomputing, Vol. 266, Issue 29, 2017, p. 293-303.
-
Xue Y., Jiang J. M., Zhao B. P., Ma T. H. A self-adaptive artificial bee colony algorithm based on global best for global optimization. Soft Computing, 2017, https://doi.org/10.1007/s00500-017-2547-1.
-
Chen Yadang, Hao Chuanyan, Wu Wen, Wu Enhua Robust dense reconstruction by range merging based on confidence estimation. Science China Information Sciences, Vol. 59, Issue 9, 2016, p. 1-11.
-
Velex P., Sainsot P. An analytical study of tooth friction excitations in errorless spur and helical gears. Mechanism and Machine Theory, Vol. 37, Issue 7, 2002, p. 641-658.
-
Chaari F., Fakhfakh T., Haddar M. Analytical modelling of spur gear tooth crack and influence on gearmesh stiffness. European Journal of Mechanics – A/Solids, Vol. 28, Issue 3, 2009, p. 461-468.
-
Saxena A., Wu B., Vachtsevanos G. A methodology for analyzing vibration data from planetary gear systems using complex Morlet wavelets. Proceedings of the American Control Conference, Portland, Ore, USA, 2005, p. 4730-4735.
-
Wang S., Huo M., Zhang C., et al. Effect of mesh phase on wave vibration of spur planetary ring gear. European Journal of Mechanics – A/Solids, Vol. 30, Issue 6, 2011, p. 820-827.
-
Kim W., Lee J. Y., Chung J. Dynamic analysis for a planetary gear with time-varying pressure angles and contact ratios. Journal of Sound and Vibration, Vol. 331, Issue 4, 2012, p. 883-901.
-
Bin G., Jiang Z., Li X., Dhillon B. S. Weighted multi-sensor data level fusion method of vibration signal based on correlation function. Chinese Journal of Mechanical Engineering, Vol. 24, Issue 5, 2011, p. 899-904.
-
Fang Z., Shu G., He et al. K. Mutil-body contact dynamic modeling of gear transmission. Journal of Mechanical Transmission, Vol. 33, Issue 1, 2009, p. 15-19.
Cited by
About this article

Financial support from National Natural Science Foundation of China (51575178, 51175170) and financial support from China Scholarship Fund (201408430118) are appreciated.
