Abstract
De-noising of signal processing is crucial for fault diagnosis in order to successfully conduct feature extraction and is an efficient method for accurate determination of cause. In this paper, the empirical mode decomposition (EMD) thresholding-based de-noising method and probabilistic neural network (PNN) are respectively used in the de-noising of the vibration signal and rotor fault diagnosis and compared with wavelet thresholding-based de-noising technology and back propagation neural network (BPNN). The results show that the clear iterative EMD interval thresholding performs better than wavelet thresholding in the de-noising of the vibration signal, and avoids the determination of wavelet basis and decomposition level. In addition, the PNN created by feature samples does not require training and has a higher accuracy than BPNN.
1. Introduction
Vibration is the main form of fault in the performance of mechanical equipment. The cause of fault can be effectively identified by processing and analyzing the vibration signals. Shaft orbit and spectrum analysis are commonly used for detecting the fault of rotor. The shaft orbit of different rotor fault differs sharply from each other. However, the relevant researches are limited because the shape of shaft orbit is two-dimensional image, making it hard for the feature to be extracted. Peng et al. [1] extracted maxima lines and corresponding Lipschitz exponents based on wavelet modulus maxima and processed them into feature vectors to detect fault. Wang et al. [2] proposed a kind of shaft orbit representation by using the chain code and shape numbers and obtained a desirable effect. Different from shaft orbit, spectrum analysis focuses on the inherent properties, such as the frequency, amplitude and phase of fault signals, which are easier to be diagnosed accurately. At present, there are many methods that can be used for spectrum analysis, such as Fast Fourier transform (FFT), wavelet analysis, and Empirical Mode Decomposition (EMD) [3]. Mogal et.al [4] studied the amplitude and phase of the vibration signal from three directions by using FFT and order analysis, making a number of conclusions applicable to fault recognition. Singh et al. [5] analyzed the characteristics of combined rotor fault in time-frequency Hilbert spectrum, overcoming the limitation of FFT.
Signals sampled from an object under investigation inevitably contain some noise that is uncorrelated with the signal to be analyzed due to the environment of data acquisition and the instruments used. Sometimes the noise contains a large amount of energy that forms a great part of the original signal. If this signal is directly analyzed without processing, the results differ from the real situation and corrupt the fault diagnosis. Therefore, it is important to eliminate the unwanted noise within the measured signal before the research objective is pursued. EMD has been developed and widely used for signal processing in recent years. The main principle of EMD is to adaptively decompose the multicomponent signal into several branches called intrinsic mode functions (IMFs), the frequencies of which are sorted in descending order according to the local characteristic and time scale. Based on multi-resolution, this method absorbs the advantage of wavelet transform and overcomes the difficulty of choosing the correct basis for the use of wavelet [6]. Flandrin et al. [7] proposed the idea of a filter bank, which adaptively designs high-pass, low-pass, band-pass or band-rejection filters by altering the IMF order. Inspired by wavelet thresholding de-noising, Kopsinis et al. [8] filtered and de-noised the signals by adopting different thresholds for every IMF and partial reconstruction of the signal [9, 10].
In the fault diagnosis of machinery [11], EMD is a common application often used together with other methods such as wavelet, independent component analysis (ICA), support vector machine (SVM) and neural networks [12-15]. In these methods, probabilistic neural network (PNN) is widely used for pattern recognition. Rai et al. [16] used EMD to acquire the IMF of vibration signals of a bearing, and extracted IMF’s frequency spectrum from FFT. Pines et al. [17] used EMD and Hilbert phase technology to monitor the structural health status. Barszcz et al. [18] adopted PNN to effectively classify the feature set that contains harmonics from vibration spectrum and proved the better performance of PNN. Wu et al. [19] integrated wavelet decomposition with PNN to diagnose the fault of machinery vibration in Aero-Engine. To solve the mode mixing problem in traditional EMD, Yu et al. [20] proposed a novel fault diagnosis method based on Modified Ensemble Empirical Mode Decomposition (MEEMD) and PNN. However, most papers focus on the technologies of feature extraction or pattern recognition, ignoring the significance of de-noising in fault diagnosis and using general de-noising methods without consideration of those signal characteristics.
This paper presents a method for rotor fault diagnosis, combining the advantages of the EMD-CIIT, the PNN and the modified feature extraction. The EMD is used as the adaptive filter to de-noise the noisy vibration signal into a useful signal, and the fault features are determined using FFT and modified feature extraction. By passing the modified features into a PNN, accurate and reasonable results can be obtained. The rest of this paper is organized as follows. In Section 2, the EMD thresholding-based de-noising is briefly introduced. The structure and principle of PNN and the procedure of fault diagnosis are presented in Section 3. In Section 4, some key parameters for fault diagnosis are determined. In Section 5, a contrast experiment on the performance of wavelet and EMD severally combined with PNN and BPNN is designed and the result is analyzed. Concluding remarks are the final section.
2. EMD-CIIT method
Inspired by wavelet thresholding-based de-noising, some novel methods based on EMD thresholding-based de-noising for signal processing are proposed by Kopsinis et al. [21] such as the direct application of wavelet thresholding in the EMD (EMD-DT), thresholding adapted to EMD characteristics (EMD-IT), iterative EMD interval-thresholding (EMD-IIT) and clear iterative EMD interval-thresholding (EMD-CIIT). Results from many comparison experiments on the de-noising of diverse well-known and normal signals prove that the EMD-CIIT provides better signal noise reduction and reconstruction. The fundamental principle of this approach is described in the following steps:
(1) Perform an EMD expansion of the original noisy signal and obtain a series of IMFs, , , …, .
(2) Because useful signal may exist in the first IMF, separate the noisy signal and useful signal from the IMF by way of a thresholding operation to obtain a de-noised version, .
(3) Compute the actual noise signal that existed in :
(4) Conduct a partial reconstruction using the last IMFs ( is the total number of obtainable IMFs) plus the useful signal contained in the first IMF, that is:
(5) Alter the sample positions of noise-only component of the first IMF to get a new version of the original noisy signal as:
where is not the same as the original signal in that the pure noise signal in the first IMF is changed artificially; provides the processed noise-only component and it can be computed as follows:
The altering function can take several forms; random circulation and random permutation are the most common strategies of alteration to produce modified noised signals. The distinction between them is that the sample positions are changed circularly or randomly.
(6) Perform an EMD expansion of the new altered signal and adopt EMD-IT de-noising defined as Eq. (5) or (6) on the IMFs:
And:
For 1, 2, …, ( is the number of zero in the th IMF), where indicates the samples between zero-crossing instants and of the th IMF. The single extrema that corresponds to this interval is . It should be noted that here is an adaptive threshold, which means that it can be changed with the variation of IMF.
(7) Get the first de-noised version , of the original signal from the previous steps. Then iterate times from step (5) to (6), where is the number of averaging iterations to obtain various de-noised versions, i.e., , , …, .
(8) Average the resulting de-noised signals by Eq. (7) and then form the eventual ideal de-noised signal:
To add flexibility and rationality for the number of optional low-order IMFs during the EMD-IT process in step (6), a generalized reconstruction of the de-noised signal is given by:
The introduction of parameters M1 and M2 is to realize the above objective.
3. Diagnosis technology and procedure
3.1. Framework and fundamental principle of PNN
The main idea of PNN [22] is to separate the decision-making space from a multi-dimensional space by applying Bayes decision rule, which leads to the least expected risk of misclassification. PNN is a feed forward artificial neural network based on mathematical statistics principles and the activation function is a radial basis function. In pattern classification, the advantages of PNN are obvious compared with some other traditional feed-forward neural networks due to its incorporation of radial basis function network and classical probability density estimation theory. The framework of PNN is shown in Fig. 1.
Fig. 1Architecture of PNN
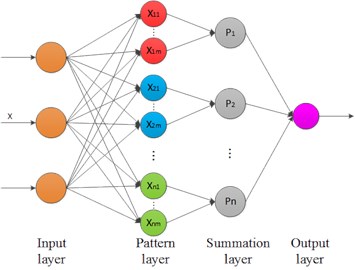
The network is made up of four layers. The first layer is the input layer which represents the input vector expressed as (, , …, ). The number of neurons of the current layer equals that of the variables in vector . The pattern layer is connected to the input layer and each neuron in it corresponds to one pattern in the training set [23]. The weight values of the neurons in this layer are set equal to the different training patterns. By Computing the Euclidean distance between the input sample and training sample and passing it to the activation function, the level of similarity is obtained as a form of decimals in the range of [0,1]. The function of summation layer lies in calculating the synthetic probability for every pattern using the output of each neuron in the pattern layer. The pattern associated with the biggest probability will be exported by the output layer as the final result.
3.2. Fault diagnostic procedure
The diagnostic procedure for rotor fault in this paper is shown as follows:
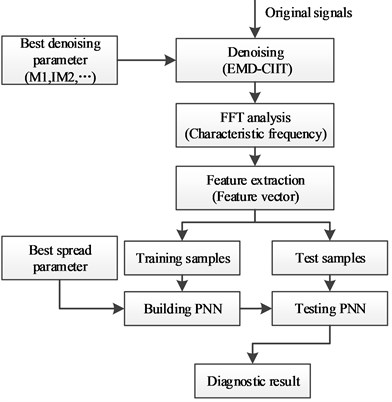
1) Signal de-noising. As the main method, EMD-CIIT is used for the noise reduction of original signals, minimizing the impact to feature extraction.
2) Feature extraction. By using FFT and frequency analysis, the amplitude at every characteristic frequency will be effectively processed and the obtained feature vector utilized as the basis for classification. According to the law of conservation of energy, the total stays the same in any domain for an identical signal. Ignoring some high frequencies that are not relevant to fault information, the fault feature is obtained by selecting amplitudes at one to four multiples of rotational frequency and processed with fellow function:
where represents the multiple of shaft rotation speed and represents the corresponding amplitude. The vector is the vector of feature as well as the input vector of PPN.
3) Fault diagnosis. Build the PNN by using part of feature samples and the best spread of radial functions to perform an effective classification for input vectors. The diagnosis is evaluated by a comparison with the actual situation.
The whole block diagram of fault diagnosis is shown as Fig. 2.
Fig. 2Procedure of fault diagnosis for rotor
4. The selection of best parameters
To confirm the reliability and advantage of this rotor diagnosis method, the wavelet de-noising and BPNN are respectively used with EMD and PNN to conduct comparison experiments. For the realization of best performance to all used methods, the optimal parameter should be determined before the test.
4.1. The selection of wavelet basis and decomposition level
It is necessary to select proper wavelet type and decomposition level before wavelet thresholding-based de-noising for noisy signals. In order to find the best wavelet basis, db, coif, sym, demy and bior wavelets are used to decompose the rotor fault signals. Computed signal-to-noise ratio(SNR) is presented in Fig. 3. It is obvious that the db wavelet has a better performance and the highest SNR is reached under a decomposition level of 3.
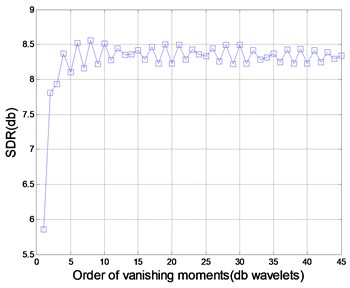
Apart from the above parameters, the best wavelet basis is also needed. There are many wavelet bases in the db wavelet family. By utilizing them to decompose rotor fault signals under a decomposition level of 3, the relationship between db wavelet basis and SNR is obtained after de-noising and is presented in Fig. 4. The result indicates that db8 has the best performance among all used db wavelet basis and is therefore selected for later experiments.
Fig. 3Comparison of different wavelet types in de-noising
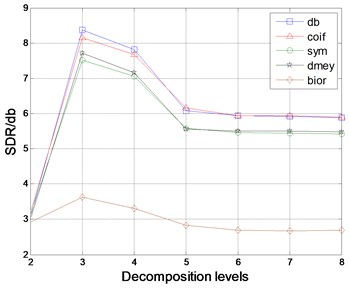
Fig. 4Comparison of different db wavelet basis in de-noising
4.2. The determination to key parameters of EMD-CIIT
It is crucial for de-noising result and accuracy of feature extraction to correctly select the order of IMF to be processed. To determine the best parameters M1 and IM2, an EMD expansion of the rotor fault signal is performed and a test of the resulting 10 IMFs is conducted with different M1 and IM2 selected by their relationship. The simulation result is shown in Table 1. It can be seen from the table that the SNR first increases and then decreases with the increase of M1 when IM2 is not changed, and gradually decreases with the increase of IM2 when M1 is not changed; this is because much noise can be restrained by a smaller M1 and useful information will be lost with a greater M1.
Table 1Comparison of differentM1 and IM2 to EMD-CIIT in de-noising
M1\IM2 | 1 | 2 | 3 | 4 | 5 | 6 | 7 | 8 |
1 | 6.5269 | 6.5254 | 6.5098 | 6.4616 | 6.4716 | 6.4267 | 5.7039 | 4.5051 |
2 | 7.1087 | 7.1082 | 7.0923 | 7.0382 | 7.0480 | 6.9942 | 6.1914 | |
3 | 8.8040 | 8.8015 | 8.7751 | 8.6939 | 8.7049 | 8.6358 | ||
4 | 8.7506 | 8.7479 | 8.7192 | 8.6439 | 8.6574 | |||
5 | 1.2731 | 1.2732 | 1.2697 | 1.2496 | ||||
6 | 0.0358 | 0.0358 | 0.0326 | |||||
7 | –0.0077 | –0.0075 | ||||||
8 | –0.0142 |
Research shows that a value in [0.3, 0.4] for the multiplication factor (MF) of the universal threshold produces better results when using the EMD-CIIT method. The impact of different multiplication factors to the de-noising performance of the rotor fault signal is shown in Table 2. It can be seen that the SNR is highest when the multiplication factor equals 0.38.
Table 2Comparison of different multiplication factors to EMD-CIIT in de-noising
MF | 0.30 | 0.31 | 0.32 | 0.33 | 0.34 | 0.35 | 0.36 | 0.37 | 0.38 | 0.39 | 0.40 |
SNR | 8.220 | 8.344 | 8.401 | 8.395 | 8.634 | 8.599 | 8.585 | 8.634 | 8.795 | 8.695 | 8.791 |
4.3. The selection of thresholding function
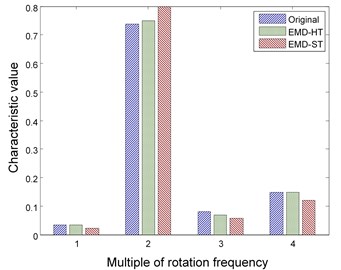
There are two kinds of thresholding functions used in de-noising: hard thresholding function and soft thresholding function. Reconstructed signal approaches the real value but has discontinuities in respect of the hard thresholding operation. Though the discontinuity can be avoided by the soft thresholding operation, there are deviations between the original and reconstructed signals. To estimate the effect of the above two functions on the keep to signal feature, they are respectively combined with wavelet and EMD technologies for signal de-noising where the parameters are determined by the conclusions in Section 4.1 and 4.2 and the Eq. 9 is used to decrease the influence of error. The results are shown in Fig. 5 and 6 respectively.
The figures illustrate that hard thresholding function has a better performance on the keep of signal feature regardless of wavelet or EMD method and is therefore selected for later experiments.
Fig. 5Features of rotor fault using wavelet method with different thresholding functions
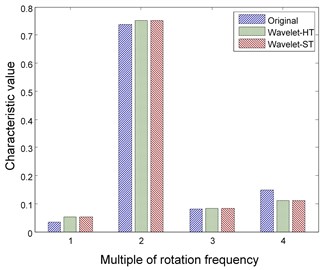
Fig. 6Features of rotor fault using EMD method with different thresholding functions
4.4. Structure and parameter of neural network
The structure of PNN is determined by samples and the spread of radial functions is the key parameter. The best spread can be easily found by the cut-and-try method because it usually belongs to a numerical interval. So far there is no standard to select the number of layers and neurons for BPNN and the optimum number is mainly dependent on experience and experimentation.
5. Experiments and result
5.1. Data acquisition and processing
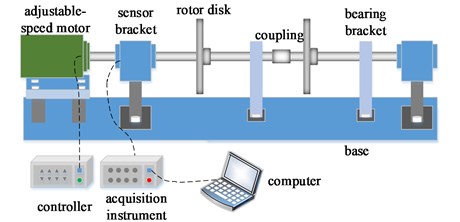
The original data samples are obtained by a rotor test bed described in Fig. 7 under the condition of setting the value 2048 for sampling frequency and 1200 r/min for rotation speed of the rotor. The rotor test bed includes adjustable-speed motor, rotor disk, coupling, sensor and bearing. The motor is controlled by a controller and the sensor signal is captured and passed to a computer by the acquisition instrument.
Fig. 7Rotor test bed
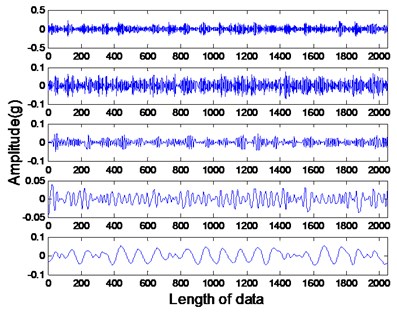
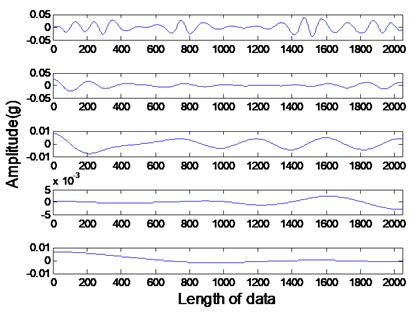
The studied states of rotor include four common types: healthy rotor, unbalanced rotor, misaligned rotor and rotor contact-rubbing. We carried out the experiment on each rotor states and obtained 150 groups of experimental data. Among them, the number of healthy, contact-rubbing and unbalanced rotors is 40 and the number of misaligned rotors is 30. The original data samples are divided into two aspects: one for the building of PNN and the other for confirmatory experiment. The original signal and de-noised signal of vertical vibration in four states are shown in Figs. 8 to 11. The IMFs of healthy rotor signal are presented in Fig. 12. The amplitude-frequency diagrams of original signals and de-noised signals processed by the EMD-CIIT method, at four states, are shown in Fig. 13 and 14 respectively.
Fig. 8Vertical vibration of healthy rotor
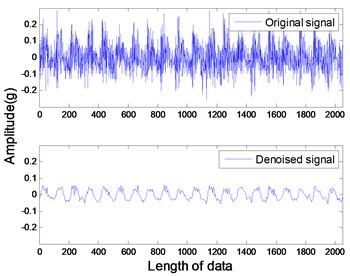
Fig. 9Vertical vibration of rotor contact-rubbing
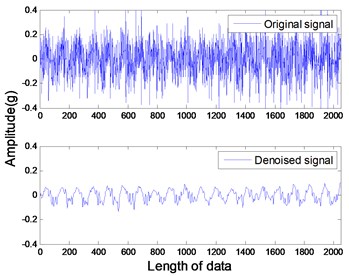
Fig. 10Vertical vibration of unbalanced rotor
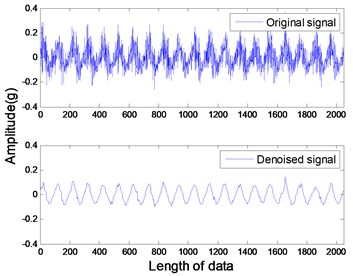
Fig. 11Vertical vibration of misaligned rotor
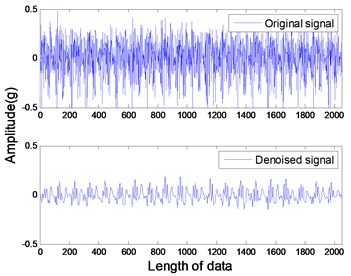
Fig. 12IMFs of healthy rotor
a)
b)
The amplitude-frequency diagrams, before and after signal processing, indicate that the noise contained in the original signals are effectively filtered by using the EMD-CIIT method. The high frequencies that are not associated with fault information are restrained and the one to four multiples of rotational frequency are reserved. The waveform of each fault in the time domain is obviously different, reflecting the different amplitudes of characteristic frequency in the frequency domain. It can be concluded from Fig. 12 that the frequency detected by IMF is decreased with the increase of the IMF order, that the noise focus on the first three IMFs proves the conclusion of the parameter selection of EMD-CIIT in Section 4.
Performing feature extraction for all samples, the mean value and standard deviation of characteristic values at differing frequency of each fault are shown in Table 3. It can be seen that all standard deviations are less than 0.1 which indicates the fault features of the same type is close to each other without great fluctuation, thus contributing to the reduction of incorrect diagnosis. From the view of the fault feature, the biggest characteristic value is at one multiple of rotational frequency for the first three faults and at two multiples of rotational frequency for the fourth fault, which can be one of the bases for distinguishing fault types. Although feature information focuses at rotational frequency for first three faults, the proportion is not the same, which provides further evidence.
Fig. 13The magnitude-frequency characteristic of original signals
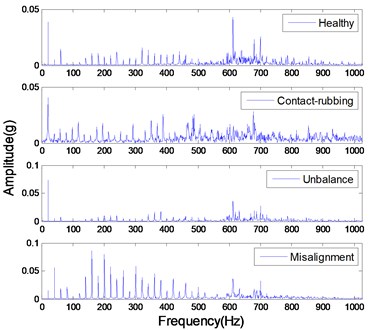
Fig. 14The magnitude-frequency characteristic of de-noised signals
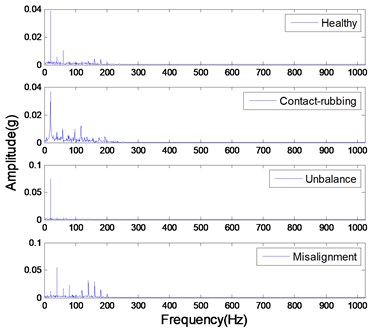
Table 3Mean value (MV) and standard deviation (SD) of the energy proportion of characteristic frequencies(CF) corresponding to rotor fault types (FT)
FT/CF | 1×rpm | 2×rpm | 3×rpm | 4×rpm | |
1 | MV | 0.9265 | 0.0148 | 0.0571 | 0.0015 |
SD | 0.0160 | 0.0068 | 0.0112 | 0.0011 | |
2 | MV | 0.8902 | 0.0150 | 0.0649 | 0.0299 |
SD | 0.0614 | 0.0091 | 0.0390 | 0.0240 | |
3 | MV | 0.9880 | 0.0061 | 0.0057 | 0.0002 |
SD | 0.0039 | 0.0027 | 0.0018 | 0.0002 | |
4 | MV | 0.0908 | 0.6853 | 0.1705 | 0.0535 |
SD | 0.0665 | 0.0682 | 0.0850 | 0.0576 | |
Note: 1 represents the normal rotor, 2 rotor contact-rubbing, 3 imbalance, 4 misaligned fault | |||||
5.2. Comparison experiments
In order to verify the EMD-CIIT advantage over the common thresholding-based de-noising method in feature extraction and to illustrate the performance of PNN in pattern recognition, a comparison experiment is conducted by adding wavelet thresholding method and BPNN. There are four combined diagnostic approaches to utilize for comparison: (1) wavelet thresholding combined with BPNN; (2) wavelet thresholding combined with PNN; (3) EMD-CIIT combined with BPNN; (4) EMD-CIIT combined with PNN.
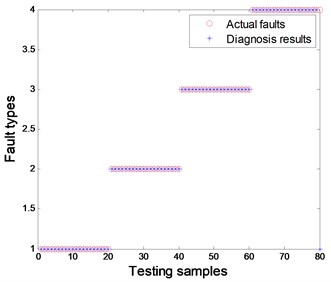
The comparison results of the above combined methods are shown in Figs. 15 to 18 under the condition of 70 samples used for training, 80 samples used for testing, a 4-5-1 structure designed for BPNN and a spread of radial functions set to 0.01 for PNN. It is evident from the figures that the proposed method of combined EMD-CIIT with PNN has the best performance in rotor fault pattern recognition, with a diagnostic success rate of 100 %. Some conclusions are also drawn concurrently: (1) The result from EMD-CIIT method is better than that of wavelet de-noising no matter whether BPNN or PNN is used for classification; (2) The result from PNN is greater than that of BPNN when the EMD-CIIT is used for de-noising; (3) The result from PNN is the same as that of BPNN when wavelet de-noising is used.
Fig. 15Wavelet-HT combined with BP network
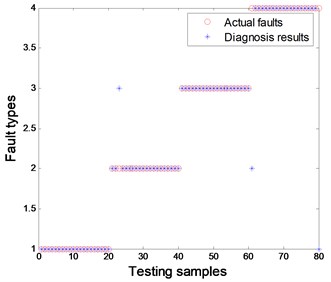
Fig. 16EMD-CIIT-HT combined with BP network
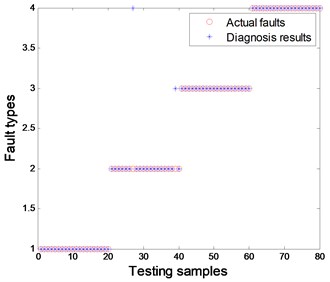
Fig. 17Wavelet-HT combined with PNN

Fig. 18EMD-CIIT-HT combined with PNN
Finally, this paper explores the diagnostic accuracy range using EMD-CIIT and wavelet threshold de-noising under the condition that training samples are randomly selected but the number is not changed. The result from 30 simulations is presented in Table 4.
It can be seen that the average diagnostic success rate(DSR)of EMD-CIIT in 30 simulations is higher than that of wavelet de-noising when they are combined with PNN. Meanwhile, the accuracy range, 96.25 %-100 %, is better than that of wavelet de-noising, 92.5 %-96.25 %, which indicates that the EMD-CIIT is always stable and more effective with changed training samples.
Table 4Statistical result of DSR when using different method for 30 simulations
Wavelet-HT | EMD-CIIT-HT | |
Max DSR | 96.25 % | 100 % |
Min DSR | 92.50 % | 96.25 % |
Ave DSR | 95.10 % | 97.75 % |
6. Conclusions
This paper describes rotor fault diagnosis using EMD-CIIT combined with PNN and the result indicates that it has a higher accuracy than current methods. The parameters of the proposed method are simply obtained, avoiding the trouble of selecting wavelet basis and decomposition level. Also, combined with PNN, the EMD-CIIT has a better accuracy range. In conclusion, the combined method has superior potential and easier application in rotor fault diagnosis.
References
-
Peng Z., He Y., Chen Z., Chu F. Identification of the shaft orbit for rotating machines using wavelet modulus maxima. Mechanical Systems and Signal Processing, Vol. 16, Issue 4, 2002, p. 623-635.
-
Wang C., Zhou J., Kou P., et al. Identification of shaft orbit for hydraulic generator unit using chain code and probability neural network. Applied Soft Computing, Vol. 12, Issue 1, 2012, p. 423-429.
-
Huang N. E., Shen Z., Long S. R., et al. The empirical mode decomposition and the Hilbert spectrum for non-linear and non-stationary time series analysis. Proceedings of the Royal Society, Vol. 454, Issue 1971, 1998, p. 903-995.
-
Mogal S. P., Lalwani D. I. Experimental investigation of unbalance and misalignment in rotor bearing system using order analysis. Journal of Measurements in Engineering, Vol. 3, Issue 4, 2015, p. 114-122.
-
Singh S., Kumar N. Combined rotor fault diagnosis in rotating machinery using empirical mode decomposition. Journal of Mechanical Science and Technology, Vol. 28, Issue 12, 2014, p. 4869-4876.
-
Xuan B., Xie Q. W., Peng S. L. EMD sifting based on bandwidth. IEEE Signal Processing Letters, Vol. 14, Issue 8, 2007, p. 537-541.
-
Flandrin P., Rilling G., Goncalves P. Empirical mode decomposition as a filter bank. IEEE Signal Processing Letters, Vol. 11, Issue 2, 2004, p. 112-114.
-
Kopsinis Y., Mclanglin S. Empirical mode decomposition based soft thresholding. Proceedings of the 16th European Signal Processing Conference, EUSIPCO, Lausanne, Switzerland, 2008.
-
Boudraa A. O., Cexus J. C. EMD-based signal filtering. IEEE Transactions on Instrumentation and Measurement, Vol. 56, Issue 6, 2007, p. 2196-2202.
-
Boudraa A. O., Cexus J. C., Saidi Z. EMD-based signal noise reduction. International Journal of Signal Processing, Vol. 19, Issue 1, 2004, p. 33-36.
-
Nguyen V. H., Rutten C., Golinval J. C. Fault diagnosis in industrial systems based on blind source separation techniques using one single vibration sensor. Shock and Vibration, Vol. 19, Issue 5, 2012, p. 795-801.
-
Guo K. J., Zhang X. G., Li H. G., et al. Application of EMD method to friction signal processing. Mechanical Systems and Signal Processing, Vol. 22, Issue 1, 2008, p. 248-259.
-
Cheng J. S., Yu D. J., Yang Y. Fault diagnosis of roller bearings based on EMD and SVM. Journal of Aerospace Power, Vol. 21, Issue 3, 2006, p. 575-580.
-
Ben Ali J., Fnaiech N., Saidi L., et al. Application of empirical mode decomposition and artificial neural network for automatic bearing fault diagnosis based on vibration signals. Applied Acoustics, Vol. 89, 2015, p. 16-27.
-
Tabrizi A., Garibaldi L., Fasana Marchesiello A. S. Early damage detection of roller bearings using wavelet packet decomposition, ensemble empirical mode decomposition and support vector machine. Meccanica, Vol. 50, 2015, p. 865-874.
-
Rai V. K., Mohanty A. R. Bearing fault diagnosis using FFT of intrinsic mode function in Hilbert-Huang transform. Mechanical Systems and Signal Processing, Vol. 21, Issue 6, 2007, p. 2607-2615.
-
Pines D., Salvino L. Structural health monitoring using empirical mode decomposition and the Hilbert phase. Journal of Sound and Vibration, Vol. 294, Issues 1-2, 2006, p. 97-124.
-
Barszcz T., Bielecki A., Romaniuk T. Application of probabilistic neural networks for detection of mechanical faults in electric motors. Przeglad Elektrotechniczny, Vol. 85, Issue 8, 2009, p. 37-41.
-
Wu W. J., Huang D. G. Research on fault diagnosis for rotating machinery vibration of aero-engine based on wavelet transformation and probabilistic neural network. Advanced Materials Research, Vols. 295-297, 2011, p. 2272-2278.
-
Yu Y. L., Li W., Sheng D., Chen J. H. A novel sensor fault diagnosis method based on modified ensemble empirical mode decomposition and probabilistic neural network. Measurement, Vol. 68, 2015, p. 328-336.
-
Kopsinis Y., Mclanglin S. Development of EMD-based denoising methods inspired by wavelet thresholding. IEEE Transactions on Signal Process, Vol. 57, Issue 4, 2009, p. 1351-1362.
-
Specht D. F. Probabilistic neural networks. Neural Networks, Vol. 3, 1990, p. 109-118.
-
Berthold M. R., Diamond J. Constructive training of probabilistic neural networks. Neurocomputing, Vol. 19, Issues 1-3, 1998, p. 167-183.
Cited by
About this article

The author(s) disclose receipt of the following financial support for the research, authorship, and/or publication of this article: The authors acknowledge financial support from the National Natural Science Foundation of China (Grant No. 51379160) and the 948 Program of the Ministry of Water Resources of China (Grant No. 201321).
Liu Dong, Zeng Hongtao, Xiao Zhihuai carried out the concepts, design, definition of intellectual content, literature search, data acquisition, data analysis and manuscript preparation. Peng Lihong provided assistance for data acquisition, data analysis, statistical analysis and manuscript editing. Malik O. P. performed manuscript review. All authors have read and approved the content of the manuscript.
