Abstract
When high-speed trains were passing through a tunnel, pressure wave will change seriously and cause large aerodynamic loads, which may bring problems to the comfort of passengers and the aerodynamic fatigue failure of train bodies, components and fixed equipment in the tunnel. Therefore, this paper systematically studied aerodynamic characteristics of a high-speed train under three kinds of situation including open air, entering a tunnel and completely in a tunnel, experimentally verified the correctness of numerically computational model. In the open air, vortexes of the high-speed train were mainly distributed in the bogie and compartment connections. Sound pressure level curves had many peak and valley points and the maximum sound pressure level was 72 dB. Sound pressure levels gradually decreased with the increase of analyzed frequency. In addition, sound energy was mainly distributed below 2000 Hz. Aerodynamic noises presented an obvious directivity and attenuation distribution. In the entering the tunnel, peak and valley values of pressures at train head and tail appeared at different time. The maximum pressures at the observation points of train head and tail were 345 Pa and –450 Pa respectively, while the minimum negative pressures at the observation points of train head and tail were –2900 Pa and –3260 Pa respectively. Computational pressures of observation points were basically consistent with the experimental test, and the relative error was only within 2 %, which indicated that the adopted numerical simulation can better simulate aerodynamic characteristics of the high-speed train. The change of the length of the tunnel had no an obvious effect on the aerodynamic lift of the high-speed train. When the length of the tunnel was less than 800 m, the negative peak of the aerodynamic lift increased continuously with the extension of the tunnel, but the increased rate was gradually reduced. When the length of the tunnel was more than 800 m, the negative peak of the aerodynamic lift was gradually reduced. According to the acoustic panel contribution, these panels which had an obvious effect on the interior noise of the high-speed train were recognized. Composite sound absorption material was then applied to these panels and the interior noise at the observation points was improved obviously.
1. Introduction
Due to the complexity of terrain along high-speed railway routes, a lot of tunnels have been built where there are many hills and mountains. When a train enters in and out of a tunnel at a high speed, the boundary of flow field will change suddenly. When train head and train tail enter in and out of a tunnel, compression and expansion waves will be produced and reflect in reverse at the tunnel entrance and exit, which causes very complex waves in the tunnel [1-6], forms drastic pressure fluctuations and has a serious influence on the fatigue failure of fixed equipment in the tunnel, train body and components and the comfort of passengers. For instance, it will lead to the excessive deformation of compartments, produce explosive noise or break window glass. For a train with poor air tightness, pressure wave outside the train will be transmitted to the interior of the train, which results in the tinnitus, emesis and other comfort problems of passengers [7-10].
For a long time, researchers have done a lot of researches in the aspect of aerodynamic characteristics of high-speed trains in the process of entering a tunnel. Based on CFD software, Xu [11] adopted the model of three-dimensional compressible unsteady turbulent flow and arbitrary sliding interface grid technique to conduct numerical simulation for pressure waves when two high-speed trains passed by each other at a constant speed and different speeds and analyze the change of pressure field outside train in the process of two trains passing by each other. Based on the CRH3 high-speed train, Wang [12] adopted the model of three-dimensional unsteady compressible turbulent flow to study the phenomenon of air flow caused by the entrance of CRH3 train into a tunnel. Researches showed: The propagation of tunnel pressure wave had directivity and attenuated with the increased distance; the amplitude of entrance wave was approximately inversely proportional to observation distance and approximately proportional to the third power of train speed. Li [13] adopted the numerical computational method of unsteady N-S equation to simulate the transient pressure of a high-speed train in the process of passing through a tunnel with a shaft and obtain the change amplitude of transient pressure of observation points of train body when the train passed through the tunnel. Luo [14] studied the aerodynamic effect of a high-speed train when it entered a low-pressure tunnel. Researched results showed: Changes in the altitude of the tunnel had a great impact on compression wave in the tunnel and micro-pressure wave at the tunnel exit; with the increased altitude, the decreased barometric pressure would cause the maximum and minimum values of compression wave in the tunnel and pressure wave at the tunnel exit to decrease linearly. Zang [15] adopted the numerical method to simulate the process of a train’s passing through a tunnel, used previous experimental data to verify the computational model, and studied the impact of the buffer structure of baffle in the tunnel on the intensity of micro-pressure wave. To address the aerodynamic effect problem caused by a high-speed train passing through a tunnel group, Wang [16] used computational fluid dynamics software Fluent to conduct simulation analysis and study the stress condition of train surface and section in the tunnel when the train passed through a short tunnel group with different spacing at different speeds. Luo [17] studied the influence rule of area and position changes and oblique crossing way of cross passage of two parallel tunnels on pressure change in parallel tunnels and cross passage. Chen [18] established a model for the tunnel pressure wave of high-speed train considering pantograph, air deflector and train connections. To obtain computational grids with high quality and strong applicability, he generated unstructured tetrahedral grids around the train and applied grids and other parts of computational domain to divide block-structured hexahedral grids.
However, published aerodynamic problems of high-speed trains passing through a tunnel mainly pay attention to exterior far field and interior aerodynamic noise problem has seldom been reported. In addition, the aerodynamic noise problems of a high-speed train are also seldom studied when the train is in the open air, entering a tunnel and completely in a tunnel. Therefore, this paper systematically studied the interior aerodynamic noises of a high-speed train under the above three working conditions, experimentally verified the correctness of numerically computational model and provided reference for reducing interior aerodynamic noises in the tunnel.
2. Interior noises in the open air
2.1. Numerical computation of aerodynamic characteristics
Air flow caused by a high-speed train in a tunnel belongs to complex three-dimensional flow. Traditional one-dimensional flow cannot reflect the speed and change of different positions on the same cross-section. This paper took CRH3 high-speed train as the studied object, as shown in Fig. 1. CRH3 train neglected components like bogies and pantographs. Above the rail surface, the train was 3.2 m high and 53 m long, whose nose tip was 6.8 m long. With a diameter of 13.3 m and cross-section of 100 m2, its length was 1000 m long. The blockage ratio of the train and tunnel model was 0.11. Firstly, this paper studied the aerodynamic noise problem of the high-speed train in the open air. To control the total number of grids, this paper adopted the scale model of 1:10. The speed of the high-speed train was consistent with the actual situation. This paper combined with smooth technique in the process of numerical simulation, which avoided unrealistic pressure fluctuations caused by the sudden start-up of the train. This paper adopted Fluent software to generate the grids of CRH3 train model, took into account the requirement of STAR-CD software for ASI technical solution in the process of generating grids, combined with block theory and conducted block processing for the whole technical area according to two parts including static and dynamic grids. In addition, this paper divided the flow field in the tunnel into motion train area and motionless fluid area which were connected by using sliding grid interface. The train area belonged to rigid motion, whose type of motion was defined by UDF; the air of fluid area moved due to the motion of the train and belonged to amoeboid motion. In the computation of dynamic grids of Fluent software, the dynamic change process of grids could be computed by three kinds of models, namely smoothing model, dynamic layering model and local model. This model combined smoothing model with dynamic layering model. Fluent software could automatically update grids according to the change situation of boundary in every iteration step. The first layer of grids in the normal direction of CRH3 surface were y+= 50 thick; grid sizes in the flow and span-wise directions of CRH3 surface were 9 –152y+ and 5 –52y+. The total number of generated grids was 5.860.000. Finally, the computational domain for the flow field of the high-speed train was shown in Fig. 2.
Fig. 1Geometric model of the high-speed train

Fig. 2Computational model for the aerodynamic characteristics of the high-speed train

The dynamic grid technique of Fluent was used to simulate the flow field of a train passing through a tunnel. Air density was 1.225 kg/m3; viscosity was 1.789 e-5 kg/(m.s); the initial velocity and pressure of flow field were 0; initial temperature was 20°C. In the beginning, the train was at the place which was 100 m away from the tunnel entrance. Therefore, the computational model focused on studying the aerodynamic noise problem of the high-speed train in the processing of running for 100 m. Namely, train head just reached the tunnel entrance. The tunnel entrance adopted pressure boundary. Pressure was standard atmospheric pressure. Based on the above computational model and boundary conditions, the aerodynamic characteristics of the high-speed train in the open air could be obtained, as shown in Fig. 3. As shown in Fig. 3(a), nose tip had a large pressure when the train head ran to the tunnel entrance. It was because the high-speed train caused some pressure wave at the tunnel entrance at this time. The pressure wave firstly acted on the nose tip of train head, causing large pressure. Fig. 3(b) showed that the vortexes of the high-speed train in the open air were mainly distributed in the bogie and compartment connections. These positions had seriously structural change, which would lead to the vortex shedding and separation of train body and cause an obvious disturbance effect.
Fig. 3Distribution of aerodynamic characteristics of train in the open air

a) Pressure distribution

b) Vorticity distribution
2.2. Numerical computation of aerodynamic noises
Aerodynamic characteristics are the foundation of computing aerodynamic noises. However, the contour for the noise distribution of train body cannot be extracted if FWH equation is directly used in Fluent software to compute aerodynamic noises. Therefore, this paper considered using the acoustic boundary element method to numerically compute the aerodynamic noise of the high-speed train. In boundary element model, there were 6 elements in the minimum wavelength. Namely, the side length of the maximum element should be less than 1/6 of the minimum wavelength of computed frequency [19-22]. Acoustic boundary element grids were also established on the train body so that there was an unstructured division method for grid generation. The maximum size of surface grids was controlled within 22 mm, which satisfied the requirement of acoustic grids when the computed frequency was 2500 Hz. In the case of dividing grids, element sizes should be basically the same. Too large or too small sizes were not good. It was because the computational accuracy of model was controlled by most elements in boundary element computation and the refinement of local elements could not improve the computational accuracy. The acoustic boundary element model contained 45034 quadrilateral elements and 52519 nodes, as shown in Fig. 4. Acoustic medium in the tunnel was air; air density was 1.225 kg/m3 at 20°C; sound velocity was 340 m/s. Sound was completely reflected by default when propagated to the wall surface of acoustic grids of model. As a result, it was necessary to define the sound absorption properties of wall surface if the sound absorption characteristics of wall surface needed to be considered in computation. Sound absorption materials in the high-speed train could be defined by acoustic impedance [23-26].
Fig. 4Boundary element grid of high-speed train

The computational result and acoustic boundary element of aerodynamic characteristics of the high-speed train were imported into Virtual.lab software. The mapping function of the software was applied to map the result of aerodynamic characteristics to acoustic boundary element. In this way, acoustic boundary element model could obtain all results of aerodynamic characteristics and realize acoustic-vibration coupling. The upper frequency limit of acoustic computation was 2500 Hz; computed step size was 20 Hz. To observe the interior aerodynamic noise problem of the high-speed train in the open air, two observation points were arranged at the places which were 1.2 m and 1.6 m away from interior floor. Sound pressure levels of two observation points were extracted, as shown in Fig. 5. Fig. 5(a) stood for the sound pressure level of the position which was 1.2 m away from interior floor. It could be seen that sound pressure level curve had many peak and valley points and the maximum sound pressure level was 72 dB. On the whole, sound pressure levels gradually decreased with the increase of analyzed frequency. In addition, sound energy was mainly distributed within the frequency of below 2000 Hz. Fig. 5(b) represented the sound pressure level of the position which was 1.6m away from interior floor. It could be seen that the change of sound pressure level curve of this position was similar to that of the position which was 1.2 m away from interior floor, but sound pressure level curve did not show so highlighted peak and valley values and change trend and sound energy distribution were similar.
Fig. 5Sound pressure levels of 2 interior observation points
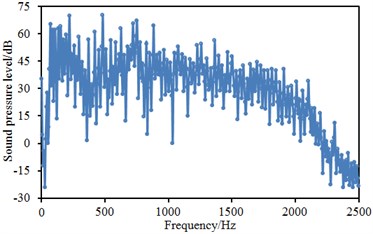
a) 1.2 m away from interior floor
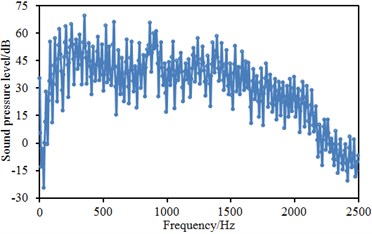
b) 1.6 m away from interior floor
Contours for the sound pressure distribution of longitudinal symmetry plane of the high-speed train at the frequency of 100 Hz, 500 Hz, 1000 Hz and 2000 Hz were extracted, as shown in Fig. 6. At 100 Hz, aerodynamic noises at nose tips of high-speed train head and tail and compartment connections were obviously greater than those at other places. In addition, aerodynamic noises presented obvious directivity and attenuation distribution. As the curvature of structure surface at the nose tip of train head and train tail witnessed serious changes, the flow direction of air changed. Air would produce square cavity eddying effect at compartment connections, which led to serious disturbance and the phenomenon of Karman Vortex Street and caused larger aerodynamic noise. At 500 Hz, aerodynamic noises at the nose tips of train head and train tail and compartment connections showed more obvious directivity and attenuating property. However, the distribution of aerodynamic noises on surface of train body was similar to waterfall when the analyzed frequency was more than 1000 Hz. It was because aerodynamic noise was mainly distributed in the middle and high frequency band and aerodynamic noises caused by pressure fluctuations in all positions of train surface would be more obvious.
Fig. 6Contours for the sound pressure distribution of the high-speed train

a) 100 Hz

b) 500 Hz

c) 1000 Hz

d) 2000 Hz
3. Interior noises of train in the process of entering the tunnel
3.1. Numerical computation of aerodynamic characteristics
In Section 2, this paper studied the running of the high-speed train in the open air till the tunnel entrance. The high-speed train continued to run at the original speed. Then, this paper studied the aerodynamic noise problem of the high-speed train in the processing entering the tunnel. The high-speed train was 53 m long and ran at the speed of 300 km/h. Therefore, the running time of the high-speed train was 0.64 s in this process. Fig. 7 displayed the computational model for the aerodynamic characteristics of the high-speed train in the process of entering the tunnel.
Fig. 7Computational model for the aerodynamic characteristics of the high-speed train

Fig. 8 displayed the contours for the distribution of aerodynamic characteristics of the high-speed train passing through a tunnel at the speed of 300 km/h. As displayed from Fig. 8(a), the pressure of the high-speed train whose head was in the flow direction in the whole flow field was the largest when high-speed train entered the tunnel. Upward from this position, positive pressure gradually decreased and changed into negative pressure with the increased air velocity. Negative pressure reached the maximum value at the maximum cross-section from train head to train body. Backwards from the position with large change of curvature, negative pressure gradually decreased. When reaching the tail of head train connected with mid train, negative pressure again turned into positive pressure with small numerical value. For tail train, pressure gradually decreased in the position of cross-section from train body to head of tail train. In addition, the maximum negative pressure was caused at the maximum cross-section from head of tail train to train body. There was small positive pressure at the nose tip of head of tail train. As displayed from Fig. 8(b), vortexes were intensively distributed at the bottom bogies and compartment connections of the high-speed train. These positions would have seriously structural change, which would lead to the vortex shedding and separation of train body and cause an obvious disturbance effect. Air in the tunnel was squeezed by the high-speed train. As a result, large pressure was distributed on the tunnel surface.
Fig. 8Distribution of aerodynamic characteristics of train entering the tunnel

a) Pressure distribution

b) Vorticity pressure
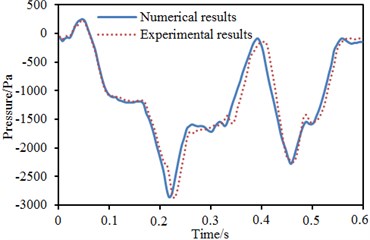
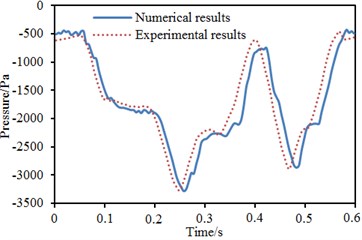
Time-history curves of pressure at the observation points of the high-speed train head and tail were extracted, as shown in Fig. 9. It could be seen that time-history curves of pressure at the observation points of train head and tail were similar and showed one peak value and two valley values. However, peak and valley values of train head and tail appeared at different time. The maximum positive pressures at the observation points of train head and tail were 345 Pa and –450 Pa respectively; the minimum negative pressures at the observation points of train head and tail were –2900 Pa and –3260 Pa respectively.
Fig. 9Time-history curves of pressure at the train head and tail
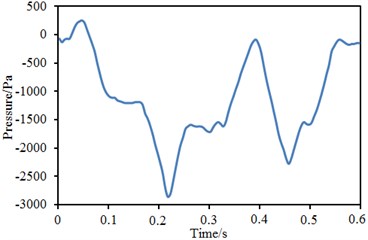
a) Observation point of train head
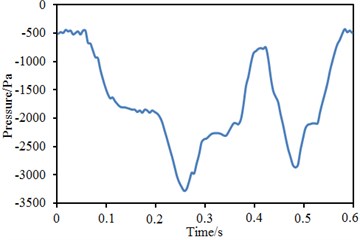
b) Observation point of train tail
3.2. Experimental verification of computational model
To perfect numerical computational model and parameters, the test platform of aerodynamic performance of train was used to conduct a moving model test with the scaling of 1:10 according to flow similarity principle [27, 28]. In the test, the tunnel model with an overall length of 100 m was installed to simulate the tunnel structure with an actual length of 1000 m. Ejection device was adopted to increase the speed of train body model to 300 km/h instantaneously. Multiple observation points of transient pressure were arranged on the surface of train body to monitor the change of pressure on the surface of test train body in the whole process of train passing through the tunnel. The test used DASP V10 version of engineering analysis software; INV 3060 A network-distributed acquisition instrument was used as data acquisition; whose highest frequency was 52000 Hz per route and A/D resolution ratio contained 24 digits. With 16 parallel channels, INV 3060 A network-distributed acquisition instrument supported multiple input modes including voltage DC, AC and ICP and had the internal storage of 16 G. Sound pressure sensor was INV 9206 and belonged to ICP power supply, whose frequency response range was from 20 Hz to 20000 Hz and response range of sound pressure level was from 20 dB to 146 dB. Sound pressure sensor was calibrated by HS6020 sound calibration instrument. Numerical computational results in Fig. 9 were compared with experimental results, as shown in Fig. 10.
Fig. 10Comparison of time-history curves of pressure between experiment and simulation
a) Observation point of train head
b) Observation point of train tail
Table 1 displayed a comparison of the maximum pressures of two corresponding observation points. It could be seen from Fig. 10 and Table 1: Time-history curves of pressure of observation points obtained by numerical computation and moving model test showed good agreement. The change rules of curves were basically the same. The relative errors of the maximum pressures of two observation points were within 2 %. Therefore, the computational model and parameters selected in this paper had satisfied the requirements of engineering research.
Table 1Comparison of the pressures between simulation and experiment
Observation points | Numerical simulation / Pa | Experimental test / Pa | Relative errors % |
Train head | –2881 | –2925 | 1.5 |
Train tail | –3356 | –3301 | –1.7 |
3.3. Numerical computation of aerodynamic noise
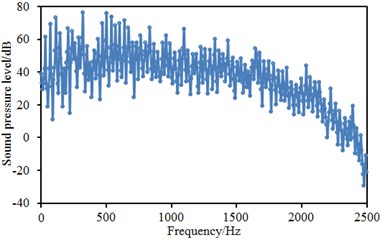
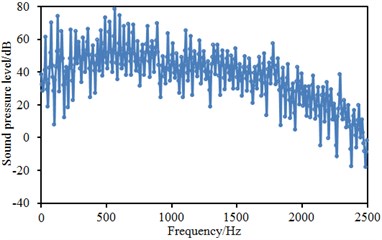
Similarly, two observation points were arranged at the places which were 1.2 m and 1.6 m away from interior floor. Sound pressure levels of two observation points were extracted, as shown in Fig. 11. Fig. 11(a) stood for the sound pressure level of the position which was 1.2 m away from interior floor. It could be seen that sound pressure level curves had many peak and valley points and the maximum sound pressure level was 78 dB. On the whole, sound pressure levels gradually decreased with the increase of analyzed frequency. In addition, sound energy was mainly distributed within the frequency of below 2000 Hz. Fig. 11(b) represented the sound pressure level of the position which was 1.6m away from interior floor. It could be seen that the change of sound pressure level curve of this position was similar to that of the position which was 1.2 m away from interior floor, but sound pressure level curve did not show so highlighted peak and valley values and change trend and sound energy distribution were similar.
Fig. 11Sound pressure levels of 2 interior observation points
a) 1.2 m away from interior floor
b) 1.6 m away from interior floor
Contours for the sound pressure distribution of longitudinal symmetry plane of high-speed train at the frequency of 100 Hz, 500 Hz, 1000 Hz and 2000 Hz were extracted, as shown in Fig. 12. At the frequency of 100 Hz, aerodynamic noises at nose tips of high-speed train head and tail and compartment connections were significantly greater than those at other places. In addition, aerodynamic noises presented obvious directivity and attenuation distribution. As the curvature of structure surface at the nose tip of train head and train tail had serious changes, the flow direction of air changed. Air would cause square cavity eddying effect at the connections, which led to serious disturbance and the phenomenon of Karman Vortex Street and caused larger aerodynamic noises. At 500 Hz, aerodynamic noises at the nose tips of train head and train tail and compartment connections showed more obvious directivity and attenuating property. However, the distribution of aerodynamic noises on surface of train body was similar to waterfall when the analyzed frequency was more than 1000 Hz. It was because aerodynamic noises were mainly distributed in the mid-high frequency band and aerodynamic noises caused by pressure fluctuations in all positions of train surface would be more obvious. In addition, the sound pressure distribution of the high-speed train in the process of entering the tunnel was similar to that in the open air.
Fig. 12Contours for the sound pressure distribution of the high-speed train

a) 100 Hz

b) 500 Hz

c) 1000 Hz

d) 2000 Hz
4. Interior noises of train in the tunnel
4.1. Numerical computation of aerodynamic characteristics
The high-speed train continued to run at the original speed. This paper studied the aerodynamic noise problem of the high-speed train in the tunnel. The tunnel was 1000 m long in total and ran at the speed of 300 km/h. Therefore, the running time of the high-speed train was 12 s in this process. Fig. 13 displayed a computational model for the aerodynamic characteristics of the high-speed train in the tunnel.
Fig. 13Computational model for aerodynamic characteristics of the high-speed train
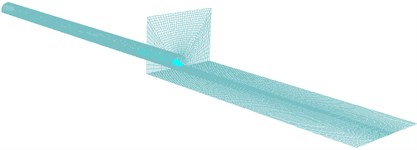
Fig. 14 displayed the contours for the distribution of aerodynamic characteristics of the high-speed train passing through a tunnel at the speed of 300 km/h. As displayed from Fig. 14(a), the pressure of the high-speed train whose head was in the flow direction in the whole flow field was the largest when the high-speed train ran in the tunnel. Similarly, pressure at the tail of the high-speed train was relatively large. It was because pressure wave in the tunnel was released, transformed into expansion wave and acted on the train tail when the tail of high-speed train entered the tunnel. As displayed from Fig. 14(b), vortexes were intensively distributed at the bottom bogies and connections of the high-speed train. These positions had seriously structural changes, which would lead to the vortex shedding and separation of train body and cause an obvious disturbance effect. In addition, there were not upward shedding vortexes due to the function of expansion wave, compared with the vorticity distribution of high-speed train in the process of entering the tunnel.
Fig. 14Distribution of aerodynamic performance of train in the tunnel

a) Pressure distribution

b) vorticity distribution
4.2. Impact of tunnel length on aerodynamic characteristics
To study the impact of tunnel length on the aerodynamic load of the high-speed train in the tunnel, tunnel models with the length of 150 m, 300 m, 400 m, 800 m and 1000 m were used for computation respectively. Fig. 15 displayed the time-histories of pressure change of observation points on the surface of train body when the high-speed train was in the tunnels with different lengths. As shown in Fig. 15: For a short tunnel with a length of 150 m, the fluctuation level of pressure of observation points in the whole process obviously relived to some extent and the change amplitude of the maximum pressure was only 86.3 % of that when the train entered in and out of a tunnel with a length of 400 m. When the tunnel length was more than 300 m, the absolute value of pressure fluctuation of observation points did not obviously increase with the increased tunnel length.
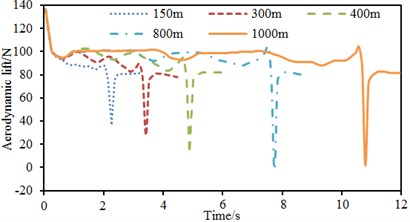
Fig. 16 displayed the time-histories of changes in the aerodynamic lift of observation points on the surface of train body when the high-speed train was in the tunnels with different lengths. As displayed from Fig. 16: The change of tunnel length had a little impact on the change characteristics of aerodynamic lift of train; time-history curves of aerodynamic lift obtained by computation under the working conditions of different tunnel lengths approximately coincided during the time period; forward peak value basically kept a fixed constant. The change of tunnel length had significant impact on the change characteristics of aerodynamic lift. When tunnel length was less than 800 m, the inverse peak and change amplitude of aerodynamic lift increased significantly with the increase of tunnel, but their increasing rates were smaller and smaller. When the train entered in and out of a tunnel with a length of 800 m, the change amplitude of aerodynamic lift of pantograph head was about 131.3 N, which increased by 27.5 % compared with that when the train entered in and out of a tunnel with a length of 300 m and only rose by 4.4 % compared with that when the train entered in and out of a tunnel with a length of 400 m. When tunnel length was more than 800 m, the inverse peak and change amplitude of aerodynamic lift in the whole process were decreased to some extent.
Fig. 15Time-history curves of pressure of observation points at different speeds
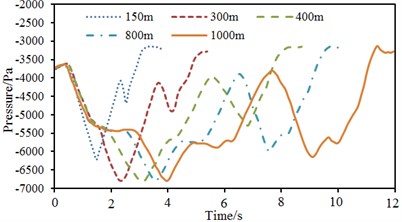
Fig. 16Time-history curves of aerodynamic lift of observation points at different speeds
4.3. Numerical computation of aerodynamic noises
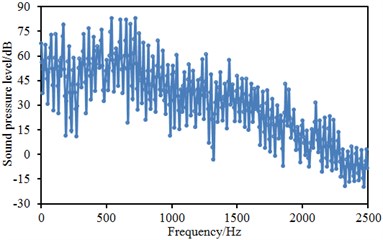
Similarly, two observation points were arranged at the places which were 1.2 m and 1.6 m away from interior floor. Sound pressure levels of two observation points were extracted, as shown in Fig. 17. Fig. 17(a) stood for the sound pressure level of the position which was 1.2 m away from interior floor. It could be seen that sound pressure level curve had many peak and valley points and the maximum sound pressure level was 84 dB. On the whole, sound pressure level gradually decreased with the increase of analyzed frequency. In addition, sound energy was mainly distributed within the frequency of below 1500 Hz. Fig. 17(b) represented the sound pressure level of the position which was 1.6 m away from interior floor. It could be seen that the change of sound pressure level curve of this position was similar to that of the position which was 1.2 m away from interior floor.
Fig. 17Sound pressure level curves of 2 interior observation points
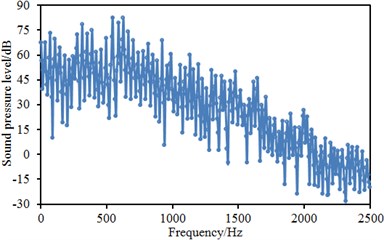
a) 1.2 m away from interior floor
b) 1.6 m away from interior floor
Contours for the sound pressure distribution of longitudinal symmetry plane of the high-speed train at the frequency of 100 Hz, 500 Hz, 1000 Hz and 2000 Hz were extracted, as shown in Fig. 18.
Fig. 18Contours for the sound pressure distribution of high-speed train

a) 100 Hz

b) 500 Hz

c) 1000 Hz

d) 2000 Hz
Different from the previous two situations, large aerodynamic noises were distributed on the surface of the high-speed train because the high-speed train was always under the complex influence of compression and expansion waves in the tunnel at the low frequency band and produced large fluctuation pressure on the surface of train body. At 500 Hz, air would cause square cavity eddying effect at compartment connections, which led to serious disturbance and phenomenon of Karman Vortex Street and caused very serious aerodynamic noises. However, the distribution of aerodynamic noises on the surface of train body was more similar to waterfall when the analyzed frequency was more than 1000 Hz. It was because aerodynamic noises were mainly distributed in the mid-high frequency band and aerodynamic noises caused by pressure fluctuations in all positions on the surface of train body would be more obvious.
5. Acoustic panel contribution of interior noises
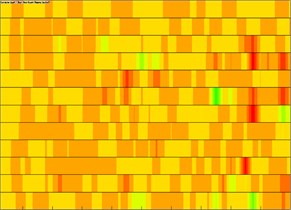
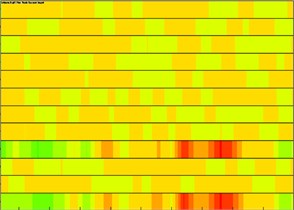
From the above numerical analysis, it could be seen that the interior noise of the high-speed train in the tunnel was the largest. Therefore, this situation was taken as the researched object to control interior noises. Interior noises were mainly from the vibration of train panels. A measure was taken to identify the panel greatly affecting interior noises and further treat the panel and reduce interior radiation noises. Published researches showed that the analysis of acoustic panel distribution was a common method of solving this kind of problems. The acoustic boundary element of the high-speed train was divided into 12 different panels to analyze the panel contribution of interior noises, as shown in Fig. 19. It could be seen from the figure that panels in the left and right corners of train roof, train roof, train bottom and side wall made most contributions to interior sound pressure.
Fig. 19Acoustic panel contribution of interior observation points before improvement
a) 1.2 m away from interior floor
b) 1.6 m away from interior floor
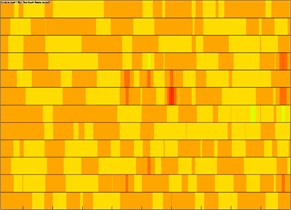
Sound absorption materials have a strong absorption performance. Materials with reducing noise performance are mainly used to control and adjust interior reverberation time and eliminate echoes in order to improve interior noise environment. Therefore, more sound absorption materials can be applied to high-speed trains to effectively reduce interior noise and improve riding comfort. According to sound absorption mechanism, sound absorption materials can be divided into: 1) Many micro-porous materials are dug from the surface to the interior and mainly absorb mid-high frequency noises; 2) Flexible and perforated materials with absorbing resonance noises. The above sound absorption materials are used together, which can expand the scope of sound absorption and improve sound absorption coefficient. The information of sound absorption materials of high-speed trains has seldom been reported. Therefore, this paper conducted simulation analysis on the sound absorption coefficient defined in reference [29]. According to the above panel analysis, it could be seen that panels in the left and right corners of train roof, train roof, train bottom and side wall made most contributions to interior sound pressure. As a result, these panels defined the material attribute of different sound absorption coefficients and computed the acoustic panel contribution of interior observation points at the frequency of 0 Hz to 2500 Hz, as shown in Fig. 20. Through comparing it with Fig. 19, panels making great contributions to interior noises were improved after sound absorption attributes were added to computational model. The sound pressures of interior observation points were extracted to compare with original results, as shown in Fig. 21. As shown in Fig. 21, the interior noise of the high-speed train in the tunnel was obviously improved after composite sound absorption materials were added.
Fig. 20Acoustic panel contribution of interior observation points after improvement
a) 1.2 m away from interior floor
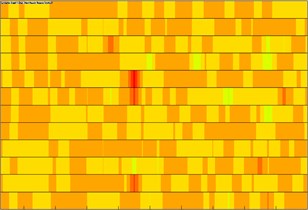
b) 1.6 m away from interior floor
Fig. 21Sound pressure level curves of 2 interior observation points
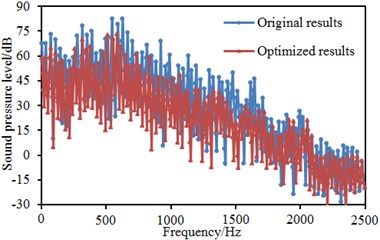
a) 1.2 m away from interior floor
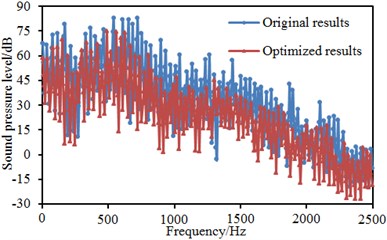
b) 1.6 m away from interior floor
6. Conclusions
This paper systematically studied aerodynamic characteristics of a high-speed train under three kinds of situation including open air, entering a tunnel and completely in a tunnel, experimentally verified the correctness of numerically computational model and finally achieved the following conclusions.
1) In the open air, vortexes of the high-speed train were mainly distributed in the bogie and compartment connections. These positions had seriously structural change, which would lead to the vortex shedding and separation of train body and cause an obvious disturbance effect. Sound pressure level curves had many peak and valley points and the maximum sound pressure level was 72 dB. Sound pressure levels gradually decreased with the increase of analyzed frequency. In addition, sound energy was mainly distributed below 2000 Hz.
2) In the open air, aerodynamic noises presented an obvious directivity and attenuation distribution. As the curvature of structures at the nose tip presented serious changes, the flow direction of air would be changed. Air would cause a square cavity eddying effect at compartment connections, which thus led to serious disturbance and the phenomenon of Karman Vortex Street and caused larger aerodynamic noises.
3) In the entering the tunnel, peak and valley values of pressures at train head and tail appeared at different time. The maximum pressures at the observation points of train head and tail were 345 Pa and –450 Pa respectively, while the minimum negative pressures at the observation points of train head and tail were –2900 Pa and –3260 Pa respectively. Computational pressures of observation points were basically consistent with the experimental test, and the relative error was only within 2 %, which indicated that the adopted numerical simulation can better simulate aerodynamic characteristics of the high speed train.
4) The change of the length of the tunnel had no an obvious effect on the aerodynamic lift of the high speed train. When the length of the tunnel was less than 800 m, the negative peak of the aerodynamic lift increased continuously with the extension of the tunnel, but the increased rate was gradually reduced. When the length of the tunnel was more than 800 m, the negative peak of the aerodynamic lift was gradually reduced.
5) According to the acoustic panel contribution, these panels which had an obvious effect on the interior noise of the high speed train were recognized. Composite sound absorption material was then applied to these panels and the interior noise at the observation points was improved obviously.
References
-
Muñoz-Paniagua J., García J., Crespo A. Genetically aerodynamic optimization of the nose shape of a high-speed train entering a tunnel. Journal of Wind Engineering and Industrial Aerodynamics, Vol. 130, 2014, p. 48-61.
-
Liu F., Yao S., Zhang J., et al. Effect of increased linings on micro-pressure waves in a high-speed railway tunnel. Tunnelling and Underground Space Technology, Vol. 52, 2016, p. 62-70.
-
Kim H. G., Choi P. G., Hong Y. J., et al. A comparative study of field measurements of the pressure wave with analytical aerodynamic model for the high speed train in tunnels. Journal of Korean Tunnelling and Underground Space Association, Vol. 17, Issue 3, 2015, p. 319-332.
-
Schwanitz S., Wittkowski M., Rolny V., et al. Pressure variations on a train – where is the threshold to railway passenger discomfort? Applied Ergonomics, Vol. 44, Issue 2, 2013, p. 200-209.
-
Miyachi T. Acoustic model of micro-pressure wave emission from a high-speed train tunnel. Journal of Sound and Vibration, Vol. 391, 2017, p. 127-152.
-
Choi J. K., Kim K. H. Effects of nose shape and tunnel cross-sectional area on aerodynamic drag of train traveling in tunnels. Tunnelling and Underground Space Technology, Vol. 41, 2014, p. 62-73.
-
Pindado S., Cubas J., Sorribes-Palmer F. On the analytical approach to present engineering problems: photovoltaic systems behavior, wind speed sensors performance, and high-speed train pressure wave effects in tunnels. Mathematical Problems in Engineering, Vol. 2015, 2015.
-
Li R. X., Guan Y. J. Investigation of air pressure pulse when two high-speed trains passing by each other in tunnel. Journal of Mechanical Engineering, Vol. 48, Issue 20, 2012, p. 127-134, (in Chinese).
-
Yang M., Tian H., Yuan X., et al. A new calculation method for micro-pressure waves induced by high-speed train passing through long tunnels and bend tunnels. Progress in Computational Fluid Dynamics, an International Journal, Vol. 15, Issue 5, 2015, p. 269-278.
-
Miyachi T., Iida M., Fukuda T., et al. Nondimensional maximum pressure gradient of tunnel compression waves generated by offset running axisymmetric trains. Journal of Wind Engineering and Industrial Aerodynamics, Vol. 157, 2016, p. 23-35.
-
Xu J. L., Sun J. C., Mei Y. G., Wang R. L. Numerical simulation on crossing pressure wave characteristics of two high-speed trains in tunnel. Journal of Vibration and Shock, Vol. 35, Issue 3, 2016, p. 184-191, (in Chinese).
-
Wang R. L., Mei Y. G., Xu J. L., Zhou C. H., Jia Y. X. Numerical study on the basic characteristics of pressure waves at the entrances of high speed railway tunnels. Modern Tunnelling Technology, Vol. 53, Issue 2, 2016, p. 95-100, (in Chinese).
-
Li Z. W., Liang X. F., Zhang J. Influence of shaft on alleviating transient pressure in tunnel. Journal of Central South University (Science and Technology), Vol. 42, Issue 8, 2011, p. 2514-2519, (in Chinese).
-
Luo J. J. Aerodynamic effect induced by high-speed train entering into tunnel in high altitude area. Journal of Southwest Jiaotong University, Vol. 51, Issue 4, 2016, p. 607-614, (in Chinese).
-
Zang J., Xue L. P. The influence of baffle structure on micro-pressure wave generated by high-speed train entering a tunnel. Journal of Shanghai Jiaotong University, Vol. 47, Issue 2, 2013, p. 248-252, (in Chinese).
-
Wang C., Xue Q. W. Analysis on aerodynamics effect of high-speed trains passing short tunnel. Railway Engineering, Vol. 9, 2014, p. 71-74, (in Chinese).
-
Luo J. J., Wu J., Chen P. F. Pressure change from the cross aisle when the train passing through parallel tunnel of high-speed railway. Journal of Beijing Jiaotong University, Vol. 39, Issue 1, 2015, p. 8-13, (in Chinese).
-
Chen X. L., Zhang C. Y., Xu J. L., Jin Y. R., Mei Y. G. Application of the mesh fusion method in numerical simulation of a high-speed train passing through a tunnel. Computer Engineering and Science, Vol. 38, Issue 3, 2016, p. 431-436.
-
Marburg S., Nolte B. Computational acoustics of noise propagation in fluids: finite and boundary element methods. Springer, Berlin, 2008.
-
Kim B. K., Ih J. G. On the reconstruction of the vibro-acoustic field over the surface enclosing an interior space using the boundary element method. The Journal of the Acoustical Society of America, Vol. 100, Issue 5, 1996, p. 3003-3016.
-
Gumerov N. A., O’Donovan A. E., Duraiswami R., et al. Computation of the head-related transfer function via the fast multipole accelerated boundary element method and its spherical harmonic representation. The Journal of the Acoustical Society of America, Vol. 127, Issue 1, 2010, p. 370-386.
-
Betcke T., Chandler-Wilde S. N., Graham I. G., et al. Condition number estimates for combined potential integral operators in acoustics and their boundary element discretisation. Numerical Methods for Partial Differential Equations, Vol. 27, Issue 1, 2011, p. 31-69.
-
Connolly D., Giannopoulos A., Fan W., et al. Optimising low acoustic impedance back-fill material wave barrier dimensions to shield structures from ground borne high speed rail vibrations. Construction and Building Materials, Vol. 44, 2013, p. 557-564.
-
Sun Y., Li Z., Huang A., et al. Semi-active control of piezoelectric coating׳ s underwater sound absorption by combining design of the shunt impedances. Journal of Sound and Vibration, Vol. 355, 2015, p. 19-38.
-
Li Y., Liang B., Gu Z., et al. Unidirectional acoustic transmission through a prism with near-zero refractive index. Applied Physics Letters, Vol. 103, Issue 5, 2013, p. 053505.
-
Ru J., Kong B., Liu Y., et al. Microstructure and sound absorption of porous copper prepared by resin curing and foaming method. Materials Letters, Vol. 139, 2015, p. 318-321.
-
Monkewitz P. A., Chauhan K. A., Nagib H. M. Comparison of mean flow similarity laws in zero pressure gradient turbulent boundary layers. Physics of Fluids, Vol. 20, Issue 10, 2008, p. 105102.
-
Chung K. M., Chang P. H., Chang K. C. Flow similarity in compressible convex-corner flows. AIAA Journal, Vol. 50, Issue 4, 2012, p. 985-988.
-
Fan R., Meng G., Yang J., et al. Experimental study of the effect of viscoelastic damping materials on noise and vibration reduction within railway vehicles. Journal of Sound and Vibration, Vol. 319, Issue 1, 2009, p. 58-76.
Cited by
About this article
This work is supported by the Fundamental Research Funds for the Central Universities (No. 2015QNB10) and the National Natural Science Foundation of China (No. 51674245).
Xin Li as the first author has provided the idea of this paper and written it, Tao Shang completed the numerical computation, Liu Han translated this paper from Chinese into English, and the other authors have checked this paper and submitted it to this journal.
