Abstract
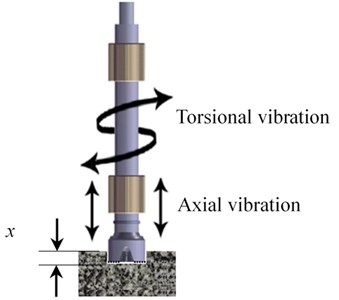
Bit bounce and stick-slip vibration are detrimental to the service life of drillstring and down-hole equipment. A two degrees-of-freedom lumped parameters model is employed to account for bit-rock interaction and coupled vibration. Qualitative analysis to system parameters is performed through analyzing the influence of the angular speed of the rotary table and the length of drillstring on stick-slip vibration and bit bounce. After that, the suppression methods of stick-slip vibration and bit bounce are also given. The nonlinear motions predicted by the model are in agreement with the experimental observations. The study shows that increasing the weight-on-bit(WOB) and the angular speed of the rotary table effectively suppresses bit bounce and stick-slip vibration. What’s more, the posterior models can suppress stick-slip vibration. At the same time, bit bounce can be reduced through applying the models in the middle. When the drillstring is in a higher-length, the stick-slip frequency is at a lower level. However, the intensity of bit bounce is extremely high.
1. Introduction
Drilling is an essential component of exploration and exploitation of oil and gas reservoirs in petroleum engineering. Drillstring is the umbrella term of a series of drilling tools. It mayinclude drill pipe, drill collar, downhole motor, stabilizer and the assistant tool. Axial pressure, torque, bit-rock interaction, mud-borehole interaction and the mud damping can have negative effects on the drillstring. Because of the complex surroundings, a lot of uncertainties and tremendous variations generate a large amount of unwanted vibrations, among which bit bounce and stick-slip are the most serious [1-3]. Stick-slip vibration is a kind of irregular torsional vibration. It gives rise to lateral vibration, axial vibration and bit bounce. Finally, the premature failure on drillstring and bit can be induced by stick-slip [4]. Bit bounce, a kind of severe axial vibration mode, can lead to bearing wear, seal failure and bit damage [5].
Resisting torque is an intrinsic property taking place at the bit-rock interface. It must be taken into consideration in stick-slip vibration [6]. Challamel et al. proposed a model, in which the torque on bit is considered as a constant (confirmed by measurements). The model is used to analyze bit stick-slip motion by coupling rock mechanics with field bottomhole data [7]. A common friction model including a local velocity-weakening effect and Coulomb friction is proposed. It is based on experimental results and shows a decrease in bit torque with rotational speed increasing [8-10]. Paslay et al. analyzed the longitudinal forces, which is caused by the longitudinal motions of drillstring and the intermittent contact between bit teeth and bottomhole [11]. Nishimatsu et al. presented two possibilities: 1) the excitation on the bit may develop oscillating forces with amplitudes of the same order of magnitude as those of the bit load; 2) the bit load can be detected by instruments placed near the top of the drillstring [12, 13]. Akbari et al. developed a model with a single PDC cutter-rock interaction in a 2-dimensional plane. The model has the ability of inputting different forces on cutter and outputting cutter penetration. In this model, the depth of the cut and the velocity of the cutter’s movement are considered as constants to represent the bit rotation [14, 15]. In order to simplify the mathematical model, the bit is considered with a single cutter. Thomas et al. studied the self-excited stick-slip vibration of a rotary drilling system with a drag bit. they took account of torsional and axial vibrations. A bit-rock interaction law, including cut and frictional contact, is a part of this model. The torsional and axial vibrations are coupled through the interaction law. A time delay equation is also introduced due to the delay caused by different teeth on the bit [16, 17].
Mud damping behavior can be considered as Rayleigh damping in the finite element when creating the two degrees-of-freedom lumped parameters model. This allows the damping to be a function of working frequency and mud density [18, 19]. R. Sampaio et al. divided the damping matrix into two parts including dissipative and non-dissipative matrices. Another researcher divided the damping matrix into the structural damping of drillstring and structural damping caused by mud damping [20]. Guzeka et al. investigated the influence of the non-Newtonian mud rheology on the vertical drilling vibrations. Their study showed that the severity of vibrations can be predicted more accurately through taking the non-Newtonian behavior of mud into account [21].
As mentioned above, the frictional contact and cutting action is taken into account in some investigations. However, the profile of the rock is considered to be idealized-the contact surface is absolutely flat. Moreover, the parameters, including WOB and drillstring model, aren’t be put together to measure the influence on drilling performance. To the authors' knowledge, even if the rock has been cut by bit, the rock profile is not an absolute flat. An undulating surface is closer to the fact. In this paper, the length of the drillstring and the rotational speed of the rotary table were analyzed qualitatively through applying the two degrees-of-freedom lumped parameters model. Bit-rock interaction, the rock profile, mud and mud damping are taken into account. Finally, the methods of suppressing unwanted vibrations are presented. Section 2 proposes the mathematical model used in this paper. Section 3 proposes the experimental apparatus. Section 4 conducts the simulation based on the mathematical model proposed in Section 2. Section 5 presents the changing law of stick-slip and bit-bounce along with the changing of drillstring length and the angular speed of the rotary table. Section 6 shows the suppression methods of stick-slip and bit bounce. Finally, conclusions are drawn in Section 7.
2. Mathematical model
The axial positive pressure is produced between the bit and the rock. The pressure is caused by the weight of the drillstring, drilling mud, and the initial weight on the top of drillstring. The rock is assumed to be linear elasticity in this paper. Because of the bit-rock interaction and the rock stiffness, the bit will be pushed into the rock in a small increment which is proportional to the axial pressure [22, 23]. The bit-rock interaction is shown in Fig. 1.
Fig. 1Bit-rock interaction
The bit-rock interaction is static when the drillstring is irrotional. The active pressure on the surface of bit-rock interaction and the tiny deformation of the rock are referred to as the initial WOB and static displacement, respectively. Their relationship is given as:
where denotes rock stiffness; is static displacement; is the initial WOB; and is equivalent drillstring mass.
The effective drillstring mass is given as:
where is effective mass of collars, is added fluid mass; is drillstring length.
The static displacement is the displacement of the bit pushing into the rock. The initial WOB changes along with the drillstring and bits rotation. The relationship between the dynamic WOB and displacement is given as:
where denotes the dynamic WOB; is the axial displacement of the bit, and is the rock stiffness.
Taking account of the bit rotation, the dynamic WOB is given as:
where is the amplitude of formation surface profile; is the coefficient of bit; is the angular displacement of bit.
The equation of motion is given as:
where and are the first and second derivative of axial displacement versus time, respectively; is the equivalent stiffness of drillstring; is the effective damping of axial motion.
The equation of axial motion is obtained through substituting Eq. (1)-Eq. (4) into Eq. (5):
The angular displacement of the rotary table is the same as that of the drillstring when the rotary table is static. Set the difference between the angular displacement of the bit and rotary table as a standard to measure the torsion of drillstring. The governing equation of torsional motion is given as:
where and are the first and second derivative of the angular displacement of bit versus time, respectively; and are the equivalent torsional inertia and torsional damping of drillstring, respectively; is the torsional stiffness of the drillstring; is the angular displacement of the rotary table; is the resisting torque on the bit.
A drag bit is applied in the model. And its external radius is , number of the cutting edge is . The depth of every cutting process is given as [16]:
where is the depth of every cutting process; is the interval of neighbouring edges’ arriving at the same position.
The interval is given as:
Through taking account of the characteristics of drag bit and bit-rock interaction, the resisting torque on the bit is given as:
where is the radius of the bit; is the intrinsic specific energy of rock; is the normal-contact force; is a bit parameter; is a bit-rock interaction parameter, and denotes the Heaviside function.
Finally, the governing equation of torsional motion is obtained by substituting Eq. (10) into Eq. (7):
3. Experimental apparatus
In order to facilitate the analyses of the drill-string dynamics, an existing laboratory scale drill-string arrangement along with sensors is retrofitted to meet the needs of this research. The experimental apparatus is designed based on the similarity theory.
Fig. 2Schematic of experimental setup in side view
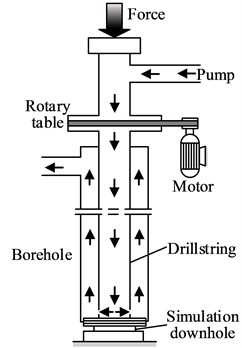
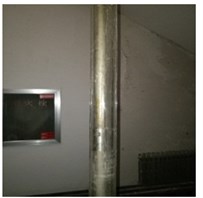
The schematic diagram is shown in Fig. 2. The experiment apparatus is composed of suspension system, rotary drive system, borehole wall, drillstring and simulation downhole. The borehole wall and drillstring are made of polymethyl methacrylate and seamless steel pipes, respectively. Suspension system, which is shown in Fig. 3(a), is composed of suspension body, bearing and water inlet connector. This system can not only lift, but press the drillstring to adjust the initial WOB. It can also circulate the drilling fluid through the drillstring. The rotary drive system is consisted of motor, frequency converter, belt pulley and slips, et al. This system is shown in Fig. 3(b). In the working state, the slips and drillstring are driven by the motor through belt pulley. And the stepless speed can be realized by the frequency converter to make drillstring rotate with different rotational speed. Because the drive unit of the drillstring is a square cube, the torque can be transferred to the drillstring, and the axial movement can also be realized. Simulation downhole, which is shown in Fig. 3(c), is composed of vibration exciter, rotary encoder, force sensor and eddy current displacement sensor. The vibration exciter can simulate the bit-rock interaction. The sensors in this equipment can measure the WOB, angular displacement and the displacement of the bit in real time.
Fig. 3Experimental arrangement
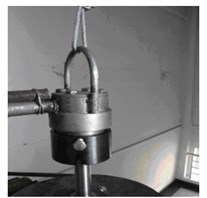
a) Suspension system
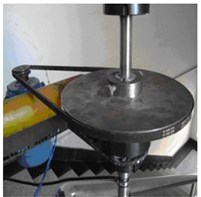
b) Rotary drive system
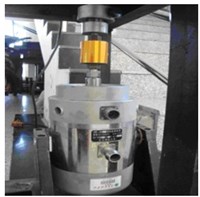
d) Drillstring bottom hole
c) Simulation
4. Numerical simulation
4.1. Stick-slip
The numerical simulation is conducted through Rung-Kutta. The system parameters used in the simulation are shown in Table 1.
The variable parameters are revealed in Table 2.
Table 1System parameters
Parameter | Value |
2.5×10⁷ N/m | |
7850 kg/m3 | |
0.2 Pas | |
1498 kg/m3 | |
3 in. | |
9 in. | |
4 in. | |
5 in. | |
210 GPa | |
0.001 m | |
0.108 m | |
60 MPa | |
76.9 GPa | |
4000 Nms | |
1 | |
1/3 | |
1.7 | |
4 | |
0.6 |
Table 2Simulation parameters of stick-slip vibration
(N) | (rad/s) | |
40000 | 4000 |
The curve of time-angular displacement is shown in Fig. 4. The curve is divided into two parts (straight section A and fluctuation section B). In section A, the rotary speed of the bit is zero. There is an initial torque on the bit due to bit-rock interaction, the bit doesn’t rotate immediately. In consequence, the drillstring is twisted and potential energy of torsion is stored. When the available torque overcomes the static friction, the stored energy is released as kinetic energy of rotation and the drillstring rotation frequency increases a lot, sometimes three times an order of magnitude above the normal. In section B, the angular displacement of the bit will increase as time goes on. However, the rising slop is not a constant, but a trend of “creep up”.
Fig. 4The angular displacement of bit
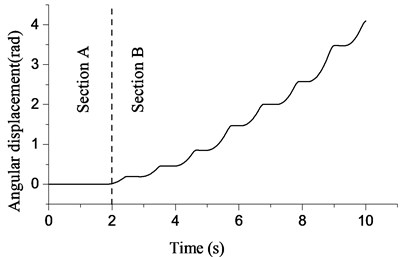
Fig. 5Relation between angular speed of bit and time
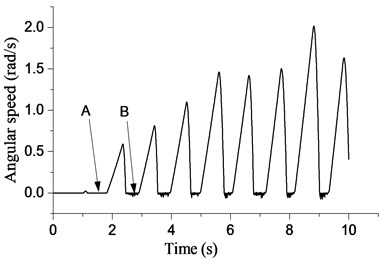
Fig. 6Relation between angular displacement of bit and time
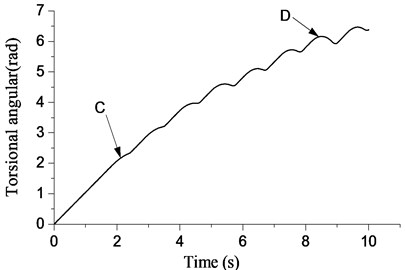
Fig. 7Torsional phase space
The angular speed of the bit is revealed in Fig. 5 to illustrate the reason for the “creep up” in Fig. 4. In Fig. 5, the angular speed of the bit is about zero when 2 s corresponding to Section A in Fig. 4. The angular speed of the bit presents a rising trend when 2 s. However, Fig. 6 shows reduction in the intensity of torsion, especially at point D. The angular speed of the bit will fluctuate in a narrow band near zero. When the driven torque of the bit reduces under the resisting torque of the bit, stick will occur. Fig. 5 shows that stick occurs seven times in Section B. Stick will disappear when the difference between the angular displacement of bit and rotary table continues to increase. This disappearance is called slip. The whole process including slip and stick is also known as stick-slip vibration.
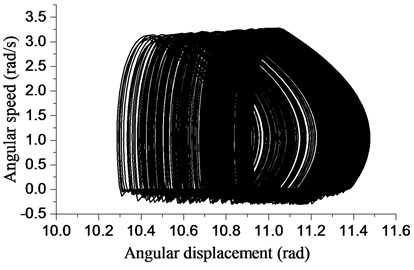
In order to identify the stick-slip vibration more clearly, simulation time is extended to 600 s in the phase diagram. The stick-slip vibration appears near the line 0, and there is a periodic trend in the difference which is between the angular displacement of bit and rotary table. In other words, the torsional strength of the drillstring doesn’t increase or reduce blindly, but fluctuates in a definitive range.
4.2. Bit bounce
The system parameters are same as those used in stick-slip vibration. And the other parameters are given in Table 3.
Table 3Simulation parameters of bit bounce
(N) | (rad/s) | |
10000 | 4000 | 1.5 |
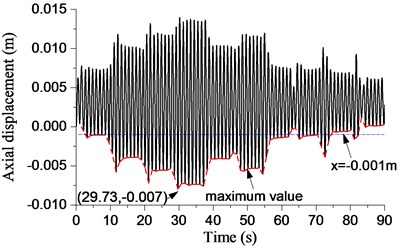
Rock on the bottom hole is not a plane, but at a certain amplitude (0.001 m) of surface’s profile. −0.001 m is assumed as the threshold of bit bounce. Thus, we think that bit bounce occurs when −0.001 m. Axial displacement of the bit is showed in Fig. 8. The blue and red dashed lines represent the threshold and the extreme displacement of the bit, respectively. In the initial section from Fig. 8, the extreme displacement of the bit is smaller than the threshold, so the displacement is at a reasonable zone. As the procedure going on, the displacement of the bit will gradually exceed the threshold. The displacement reaches the maximum (−0.007 m) when 29.73 s. When the displacement is at the maximum point (shown in Fig. 8 the red dashed line), the bit is in the condition of bit bounce. Hence, the bit bounce is clearly identified through the axial displacement of bit in time under current condition.
Fig. 8Axial displacement of bit
5. Contributing factors of stick-slip and bit bounce
Ignoring the influence of geological conditions, there are many contributing factors to stick-slip and bit bounce. The factors include the angular speed of the rotary table and the length of the drillstring. The independent variable method is employed in this simulation. The analysis is based on the mathematical model established in Section 2, and conducted through changing the length of drillstring and the angular speed of the rotary table.
5.1. Length of drillstring and rotary table angular speed effects on stick-slip vibration
5.1.1. The influence of drillstring length on stick-slip vibration
The influence of drillstring length on stick-slip is measured by the frequency of stick-slip vibration. Simulation parameters are listed in Table 4.
Table 4System parameters on stick-slip vibration
(N) | (rad/s) |
40000 |
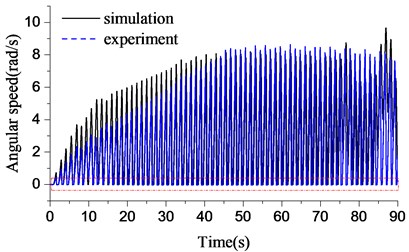
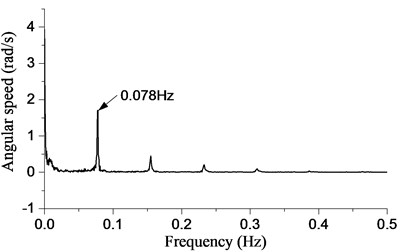
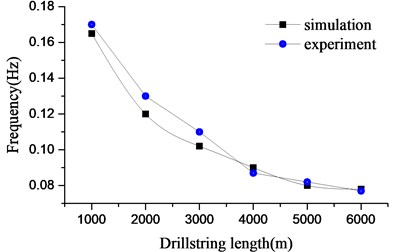
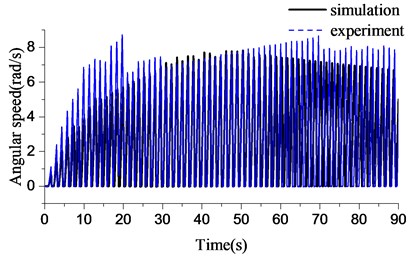
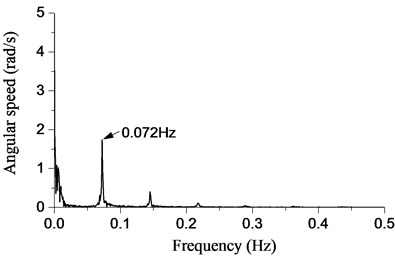
Initially, a force of 40000 N is applied on the top of the drillstring. The drillstring are 1000 m, 2000 m, 3000 m, 4000 m, 5000 m, 6000 m in length. The angular speed of bit in both experiment and simulation are shown in Fig. 9(a). It is observed that the bit is in stable stick-slip vibration in experiment and simulation. However, the numerical simulation is more responsive than the experiment, and approaches steady state much sooner. In the process of stick-slip vibration, the fluctuation of the bit angular speed is comparatively large. The maximum speed touches twice more than the angular speed of the rotary table, and rapidly reduces to zero in a short time. The drillstring will store a quantity of energy when the angular speed of the bit is zero. The rapid increase of angular speed will appear when the energy is released. The rapid change of the bit speed may lead to the damage of the drill bit. It can be observed that the frequency of stick-slip vibration reaches 0.078 Hz when the drillstring is 6000 m in length. The contrast between numerical and experimental investigations with frequency is shown in Fig. 10. The numerical result is in line with the experiment. The frequency reduces with the development of drillstring length. And the falling speed around the shorter drillstring is higher than that around the longer in both simulation and experiment. Thus, faster drilling in the shallow stratum should be accepted in the well field in order to reduce the frequency of stick-slip vibration and prolong the service life of bit.
Fig. 9Torsional response during stick-slip vibration while ld= 6000 m
a)
b)
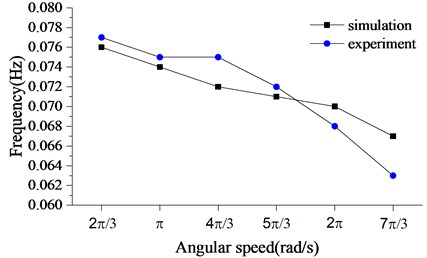
Fig. 10Frequency of stick-slip vibration
5.1.2. Rotary table’s angular speed effect on stick-slip vibration
The effect of the rotary table angular speed on stick-slip vibration is measured via the method used in previous Section. Angular speed curves of the bit in both experiment and simulation are shown in Fig. 11(a). The invariable parameters are shown in Table 5.
Table 5System parameters on stick-slip vibration
(N) | (m) |
40000 | 7000 |
The angular speed of rotary table is 3 rad/s, rad/s, 43 rad/s, 53 rad/s, 2 rad/s and 73 rad/s, respectively. The bit is in stable stick-slip vibration, and the numerical and experimental results are in good agreement. The maximum angular speed in Fig. 11(a) is close to that in Fig. 10(a). The stick-slip frequency with the different angular speed of rotary table is shown in Fig. 12. The stick-slip frequency shows a downward trend with the development of the angular speed of the rotary table. And the experiment shows a same trend. In a word, a higher angular speed can be selected to reduce the stick-slip frequency in the actual drilling, and then the impact on bit can also be suppressed. Finally, the service life of drill bit will be elongated.
Fig. 11Torsional response during stick-slip vibration
a)
b)
Fig. 12Stick-slip frequency with the different angular speed of the rotary table
5.2. Drillstring length and rotary table angular speed effects on bit bounce
5.2.1. The drillstring length effect on bit bounce
The effect of the drillstring length on bit bounce is analyzed. The invariable parameters are shown in Table 6.
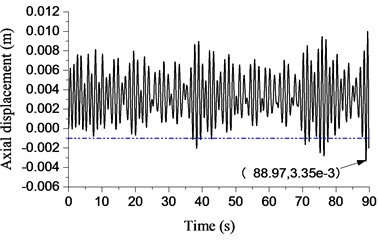
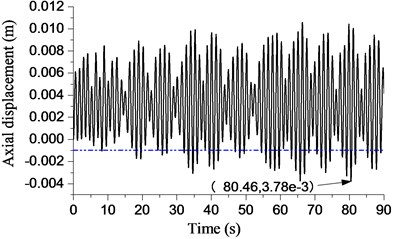
The blue dotted line shown in Fig. 13 denotes the threshold of bit bounce. The drillstring is 1000 m in length in Fig. 13(a). The largest negative displacement of bit appears at 3.02 s where the displacement is −0.655 mm. The curve of displacement did not exceed the threshold of bit bounce during the procedure. Thus, the bit bounce doesn’t exist in Fig. 13(a). The length of the drillstring is 2000 m in Fig. 13(b). No obvious bit bounce occurs through increasing the length to 2000 m. However, the largest negative displacement of the bit is larger than that in Fig. 13(a). The largest negative displacement of the bit is −2.5 mm (< −1 mm) in Fig. 13(c), so the bit bounce is considered to appear.
Table 6System parameters on bit bounce
(N) | (rad/s) |
10000 | 3 |
Fig. 13Displacement response with different lengths of drillstring
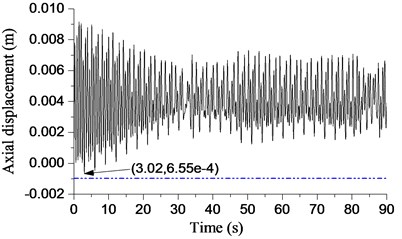
a) 1000 m
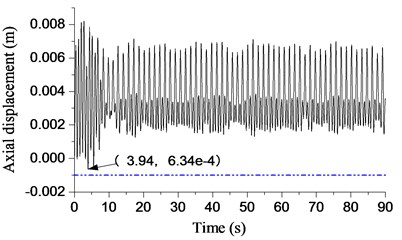
b) 2000 m
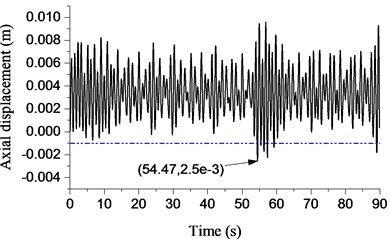
c) 3000 m
d) 4000 m
e) 5000 m
f) 6000 m
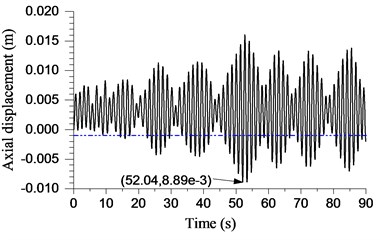
However, the amplitude and frequency of bit bounce are not too high. In Fig. 13(d) and Fig. 13(e), the length of the drillstring is 4000 m and 5000 m, respectively. It is obvious that the displacement has exceeded the threshold of the bit bounce at different levels. In Fig. 13(f), the displacement exceeds the threshold of bit bounce during most of the procedure, whose amplitude of bit bounce is the highest in Fig. 13. It can be concluded that the largest negative displacement of the bit increases with the increasing of drillstring length. Bit bounce will appear when the largest negative displacement exceeds the threshold of bit bounce. Furthermore, the frequency and intensity of bit bounce will also increase.
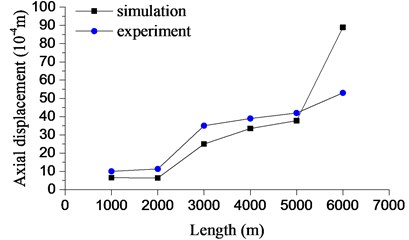
The axial maximum displacement of the experiment and the numerical simulation with the different drillstring length are shown in Fig. 14. The overall trend of the displacement is upward in both experiment and numerical simulation. However, the displacement range in the experiment is less than that in the numerical simulation. In general, the numerical simulation and the experimental results are in close agreement.
The bit bounce is a very severe vibration in the drilling process. The repeated impact on bit will cause larger dynamic load, shorten the service life of the bit and increase the drilling cost. The bit bounce is more and more severe with the development of the drillstring length based on the simulation, especially when drillstring length is more than 4000 m. Thus, the special attention must be paid when the well exceeds a certain depth in the actual drilling process.
Fig. 14Axial displacement of bit bounce
5.2.2. Rotary table angular speed effect on bit bounce
The effect of the rotary table angular speed on bit bounce is investigated in this section. The invariable parameters used in this simulation are listed in Table 7.
Fig. 15Displacement response with different rotary table angular speeds
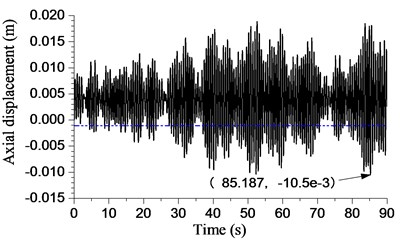
a) 23 rad/s
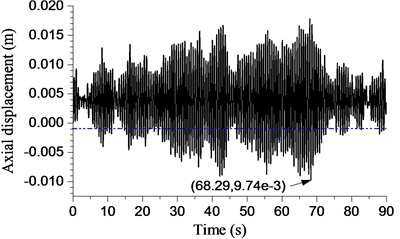
b) rad/s
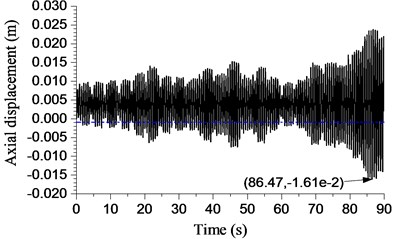
c) 43 rad/s
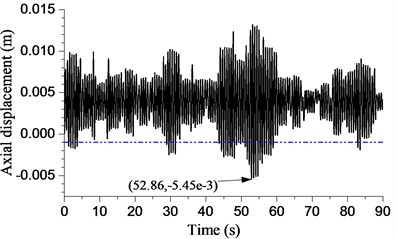
d) 53 rad/s
e) 2 rad/s
f) 73 rad/s
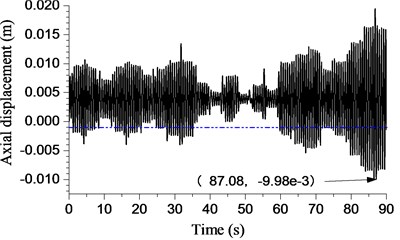
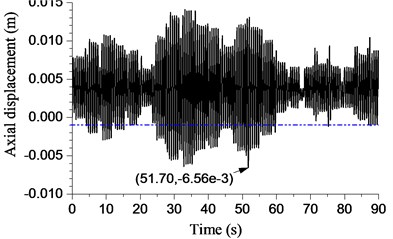
The displacement of bit with different angular speeds is shown in Fig. 15. The rotary table angular speed is 23 rad/s in Fig. 15(a). The curve exceeded the threshold of bit bounce ( −0.001 m) during most time. The maximum amplitude of the bit bounce is 10.5 mm while 85.187 s. It can be said that this is an example of severe bit bounce. The amplitude decreases to some extent when the angular speed increases to rad/s. However, the drop-in amplitude is small. The bit bounce amplitude fluctuates with the development of the rotary table’s angular speed. The minimum amplitude is 5.45 mm when angular speed is 53 rad/s.
Table 7System parameters of bit bounce
(N) | (m) |
10000 | 1000 |
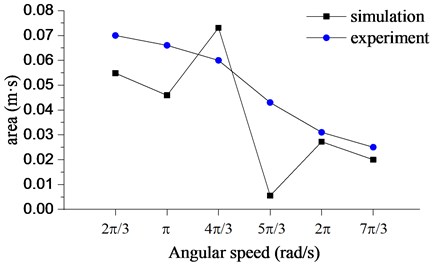
Although the amplitude is different in Fig. 15, the intensity of bit bounce is not clearly identified in Fig. 15(a)-15(e), A method to measure the intensity of bit bounce is presented through comparing the bit bounce region which is bounded by the displacement curve and the threshold. The bigger the area of the bit bounce region, the severer the bit bounce. The bit bounce area of experiment and numerical simulation are presented in Fig. 16.
The area is large when the rotary table angular speed is 23 rad/s –43 rad/s. The maximum displacement is 16.1 mm when the angular speed is 43 rad/s. Meanwhile, the area of the bit bounce region is 0.0731 m·s. When the angular speed is 53 rad/s, the area and maximum displacement are 93 % and 66 % lower than that when the angular speeds are 43 rad/s and 2 rad/s, respectively. There is a gap between the experimental result and the numerical result when the angular speed is 23 rad/s, rad/s and 53 rad/s, especially 53 rad/s.
However, the trend of the numerical simulation is in line with the experiment. Thus, the bit bounce intensity with the higher rotary table angular speed is lower than that with a lower speed.
The intensity of the bit bounce can be reduced through applying the higher angular speed of the rotary table. The trend in this section is the same as that in Section 5.1.2. Thus, promoting the angular speed of the rotary table not only suppresses the intensity of the bit bounce, but stick-slip vibration. Finally, smoothing drilling process, reducing the impact on bit and lengthening the service of the bit can also be realized.
Fig. 16The intensity of bit bounce with different rotary table angular speeds
6. The method of suppressing stick-slip vibration and bit bounce
Unwanted vibrations of the drillstring can diminish the life of the drillstring and dissipate a portion of the energy that is intended to be delivered to the bit. As a result of vibrations, the rate of penetration and bit longevity will be reduced.
The effect of the angular speed of bit and length of drillstring on the drillstring vibrations was presented in Section 4. The rotary table angular speed is one of the most basic parameters and has a significant influence on drilling performance. The effect must be taken into consideration systematically. The drillstring length determines the well depth. The rate of penetration is low when drilling in high abrasive and hard formation. Thus, suppressing the vibration is infeasible through changing the drillstring length. Other methods must be applied to suppress the stick-slip vibration and bit bounce. The radial dimension and initial WOB also have a great influence on the system based on the governing equations of motion. The suppression of stick-slip vibration and bit bounce were investigated by changing the radial dimension of the drillstring and initial WOB in Section 6. The drillstring models based on the API standard are shown in Table 8. The shaded model 5b is used in Section 4.
Table 8API drillstrings
Model | External diameter (in) | Inside diameter (in) | Wall thickness (in) |
4 1/2 a | 4.5 | 3.826 | 0.337 |
4 1/2 b | 4.5 | 3.640 | 0.430 |
5 a | 5 | 4.276 | 0.362 |
5 b | 5 | 4 | 0.500 |
5 1/2 a | 5.5 | 4.778 | 0.361 |
5 1/2 b | 5.5 | 4.670 | 0.415 |
6 5/8 a | 6.625 | 5.965 | 0.330 |
6 5/8 b | 6.625 | 5.901 | 0.362 |
6.1. The suppression of stick-slip vibration
The methods of suppressing stick-slip vibration are presented in this section. The drillstring length is 6000 m. The other parameters are shown in Table 4. The stick-slip frequencies of experiment and numerical simulation with different drillstring models are shown in Fig. 17. The models with ‘b’ are the internal-external upset drillstring. The models with ‘a’ are the ordinary ones. The frequency of the stick-slip vibration reduces with the development of drillstring model in Fig. 17. In the numerical simulation, the frequency is higher than that using ordinary one when applying the internal-external upset drillstring. When 5b (used in Section 4) is applied, the frequency is 35 % higher than that applying 6 5/8b. In the experiment, the frequencies are almost the same as the simulation when applying 4 1/2b and 5a and close to the simulation when applying the other models. Hence, applying the models with the lager radial size can reduce the frequency of stick-slip vibration. Moreover, the frequency can also be suppressed by using the ordinary drillstring in the same drillstring model. However, increasing the radial size is more effective to suppress the stick-slip than applying the ordinary drillstring models.
Fig. 17Stick-slip frequency with different drillstring models
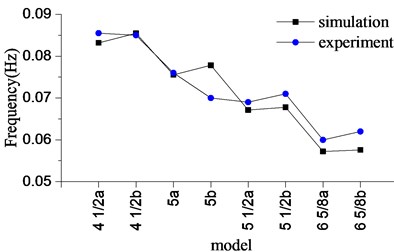
Fig. 18Stick-slip frequency with different WOB
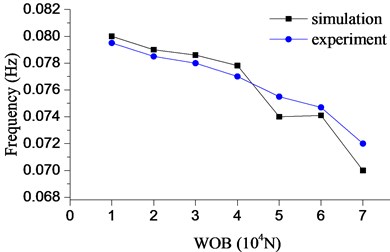
The frequency of stick-slip vibration with different WOB is shown in Fig. 18. A 10000 N WOB is applied in the numerical simulation. When WOB is 70000 N, the frequency of stick-slip vibration is 12.5 % more than that when WOB is 10000 N. In the experiment, the frequency has been declining with the increasing of WOB. And the frequency is coincidence well with the numerical simulation. Thus, a higher WOB can suppress stick-slip vibration effectively. Boosting WOB and drillstring model can suppress the fluctuation of the bit and prolong the service life of bit ultimately.
6.2. The suppression of bit bounce
The parameters shown in Table 4 are applied in this section. Taking the curve shown in Fig. 15(f) as example. The size of the drillstring is shown in Table 8.
Fig. 19The intensity of bit bounce with different drillstring models
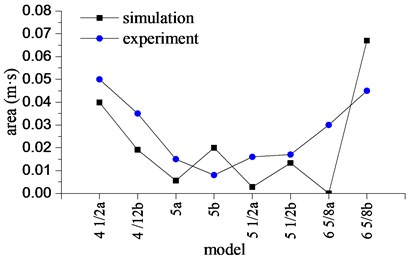
Fig. 20The intensity of bit bounce with different WOB
The intensity of bit bounce with the different drillstring models is shown in Fig. 19. The severer bit bounce appears when the biggest and the smallest models are applied in both experiment and simulation. Bit bounce is suppressed through applying some models revealed in the middle of Table 8. The simulation shows that the intensity when applying a normal drillstring is much lower than that applying an internal-external upset drillstring in most cases. This trend is not obvious in the experiment. However, the experimental result is coincidence well with the numerical simulation in general.
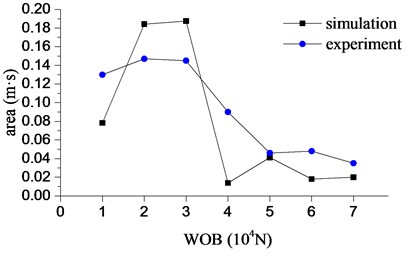
Fig. 20 shows the intensity of bit bounce with different WOB. In numerical simulation, bit bounce is not severe when the initial WOB is at a lower level. But it becomes more severe at a higher level. The average area of the bit-bounce region is 0.023 m·s with the WOB between 50000 N-70000 N. When WOB is between 10000 N-40000 N, the area is 6.5 times greater than that in the high-tonnage section. In the experiment, the range of the area hasn’t changed so much, however has the same trend with the simulation. In short, adopting the higher WOB can lower the intensity of bit bounce under the current situations.
In a word, the numerical simulation and experiment results both show that suppressing stick-slip vibration and bit bounce through changing WOB and drillstring models is feasible. There are some specific drillstring models in suppressing stick-slip vibration and bit bounce. Moreover, the higher WOB is also a method to suppress the bit bounce and stick-slip vibration in the actual drilling process.
7. Conclusions
A two degrees-of-freedom lumped parameters model is developed to describe the axial and torsional motions of the bit. Drillstring gravity, mud damping, added fluid mass and bit-rock interaction are taken into account in this model. In addition, an experimental apparatus is also developed.
It should be emphasized that the paper not only proposes a mechanical explanation of this complex dynamic system, but also provides a lumped parameters model which can be reused in other rotating slender systems subjected to damping and bit-rock interaction.
Numerical simulations and experiments showed that the frequency of stick-slip and the intensity of bit bounce have a downward trend simultaneously with the development of the angular speed of the rotary table and WOB. Thus, the increase of these two parameters is beneficial for suppressing stick-slip and bit bounce in the process of practical drilling. The intensity of bit bounce reduces by applying some middle models. Moreover, the stick-slip frequency reduces with the development of drillstring model. Thus, the rational choice of the drillstring models is an effective method to suppress stick-slip vibration and bit bounce. With the increasing of the drillstring length, the stick-slip frequency and the strength of bit bounce show two different trends. Therefore, a weighting coefficient should be applied to measure the influence of stick-slip vibration and bit bounce on drilling in order to have a better drilling performance.
References
-
Kamell J. M., Yigit A. S. Modeling and analysis of stick-slip and bit bounce in oil well drillstrings equipped with drag bits. Journal of Sound and Vibration, Vol. 333, Issue 25, 2014, p. 6885-6899.
-
Albdiry M. T., Almensory M. F. Failure analysis of drillstring in petroleum industry: a review. Engineering Failure Analysis, Vol. 65, 2016, p. 74-85.
-
Yigit M., Al Ansary A.-S.-D., Khalid M. Active control of drillstring vibrations by mode localization. Journal of Structural Control, Vol. 4, Issue 1, 1997, p. 47-63.
-
Xu S., Liu Y. Z., Zhou L. U., Yan Y. M. Failure analysis of the 18crni3mo steel for drilling bit. Journal of Failure Analysis and Prevention, Vol. 2, 2014, p. 183-190.
-
Spanos P. D., Wengupta A. K., Cunningham R. A. Modeling of roller cone bit lift-off dynamics in rotary drilling. Journal of Energy Resources Technology, Vol. 117, 1995, p. 197-207.
-
Hector P., Jose A. Suppression of stick-slip in drillstrings: A control approach based on modeling error compensation. Journal of Sound and Vibration, Vol. 310, 2008, p. 881-901.
-
Challamel N., Sellami H., Chenevez E. A Stick-slip analysis based on rock/bit interaction: theoretical and experimental contribution. IADC/SPE Drilling Conference, 2000.
-
Brett J. F. The genesis of torsional drillstring vibrations. SPE Drilling Engineering, Vol. 7, Issue 3, 1992, p. 168-174.
-
Yigit A. S., Christoforou A. P. Stick-slip and bit-bounce interaction in oil-well drillstrings. Journal of Energy Resources Technology, Vol. 128, Issue 4, 2006, p. 268-274.
-
Pavone D. R., Desplans J. P. Application of high sampling rate downhole measurements for analysis and cure of stick-slip in drilling. Proceedings of the SPE 69th Annual Technical Conference and Exhibition, 1994.
-
Paslay P. R., Bogy D. B. Drill string vibrations due to intermittent contact of bit teeth. Journal of Manufacturing Science and Engineering, Vol. 85, Issue 2, 1963, p. 187-194.
-
Nishimatsu Y. The mechanics of rock cutting. International Journal of Rock Mechanics and Mining Sciences, Vol. 9, Issue 2, 1992, p. 261-270.
-
Okubo S., Fukui K., Nishimatsu Y. Estimating abrasivity of rock by laboratory and in situ test. Rock Mechanics and Rock Engineering, Vol. 44, Issue 2, 2011, p. 231-244.
-
Akbari B. Polycrystalline Diamond Compact Bit-Rock Interaction. Master Thesis, Memorial University of Newfoundland, 2011.
-
Akbari B. PDC Cutter-Rock Interaction-Experiments and Modeling. Doctor Thesis, The University of Tulsa, 2014.
-
Thomas R., Germay C., Detournay E. A simplified model to explore the root cause of stick-slip vibrations in drilling systems with drag bits. Journal of Sound and Vibration, Vol. 305, Issue 3, 2007, p. 432-456.
-
Detournay E., Thomas R., Shepherd M. Drilling response of drag bits: theory and experiment. International Journal of Rock Mechanics and Mining Science, Vol. 45, Issue 8, 2008, p. 1347-1360.
-
Apostal M. C., Haduch G. A., Williams J. B. A study to determine the effect of damping on finite element based forced frequency response models for bottom hole assembly vibration analysis. SPE Annual Technical Conference and Exhibition, 1990.
-
Ghasemloonia A., Rideout D. G., Butt S. D. Vibration analysis of a drillstring in vibration-assisted rotary drilling: finite element modeling with analytical validation. Journal of Energy Resources Technology, Vol. 135, 2013, p. 1-18.
-
Sampaio R., Piovan M. T., Lozano G. V. Coupled axial torsional vibrations of drillstring by means of nonlinear model. Mechanics Research Communications, Vol. 34, Issue 5, 2007, p. 497-502.
-
Guzeka A., Shufrinab I., Pasternakb E. Influence of drilling mud rheology on the reduction of vertical vibrations in deep rotary drilling. Journal of Petroleum Science and Engineering, Vol. 135, 2015, p. 375-383.
-
Thomas R., Dagrain F., Poyol E. Rock strength determination from scratch tests. Engineering Geology, Vol. 147, 2012, p. 91-100.
-
Divenyi S., Savi M. A., Wiercigroch M. Drill-string vibration analysis using non-smooth dynamics approach. Nonlinear Dynamics, Vol. 70, Issue 2, 2012, p. 1017-1035.
Cited by
About this article

This research is funded by the Natural Science Foundation of China (No. 11372071) and Northeast Petroleum University Innovation Foundation for Postgraduate (No. YJSCX2016-022NEPU).
