Abstract
To create a partial rocking mode in a building structure during an earthquake, two or more rigid cores with joint connection to the foundation, and capable of moving in the two main directions of the building’s plan, can be used. A rigid core with a hinge connection to the foundation is essentially unstable. However, two rigid cores can be connected together by springs and dampers in certain floors to create a stable structure. At the same time, the structure shows a rocking behavior in which the building moves almost as a rigid body. In fact, the effects of all modes other than the fundamental one is almost eliminated. The use of yielding or friction dampers leads to permanent displacements in the structure in an earthquake. Therefore, in this study pre-compressed springs were employed, which do not create any permanent displacement. The pre-compressed springs were used to provide the structure with initial stiffness and prevent any displacement by small forces. Since an elastic spring does not have any damping, it was decided to control the structural displacements by viscous dampers in certain floors. Finally, the proposed structure underwent static and time-history analyses in plastic range, and the results suggested the desirable behavior of the proposed structure. In particular, there were no permanent displacements left in the structure after the earthquake.
1. Introduction
Housner was the first researcher who worked on rocking motion of buildings’ foundations [1]. Later, Clough [2], Chopra [3], Psycharis [4] and Priestly [5] conducted analytical and experimental studies on the rocking behavior of building systems, and got similar results. Azuhata and Midorikawa [6] and also Midorikawa and Azuhata [7, 8] studied on rocking motion of buildings and tested a half-scale 3-story steel building with yielding base plates on shake table, and compared its behavior with that of a fixed base building, and expressed the appropriate effect of allowed uplift. Eatherton performed large-scale cyclic and hybrid simulation tests and developed a kind of controlled-rocking steel building system with replaceable fuses [9]. Hosseini and Noroozinejad Farshangi introduced a kind of rocking motion by using telescopic columns [10]. Also, Hosseini and Ebrahimi worked on rocking mechanism of relatively tall buildings [11]. Tremblay and colleagues studied seismic retrofit of existing low-rise steel buildings in eastern Canada using rocking braced frame system [12]. Also Hosseini and colleagues introduced a kind of seesaw building with friction dampers in columns at the lowest story [13], and Khalkhali and colleagues studied partitioned rocking buildings [14], and also Hosseini and Nejati worked design of repairable regular steel buildings with square plan based on seesaw motion of building structure and using double ADAS (DADAS) dampers [15].
It is crucial to design a structure capable of transitioning into the plastic range during an earthquake for two reasons: 1) reducing the building structural cost, 2) mitigating absolute acceleration – and thus minimizing the damage to non-structural components. Structures transition into the plastic range through various forms. For instance, transition into the plastic range occurs for concentrically brace frame (CBF) structures through plastic behavior of braces, for eccentrically brace frame (EBF) structures through plastic behavior of link beams and for moment structures through plastic behavior of beams at the beam-column connections.
The problem with all of the above configurations, however, is that an -floor non-torsional structure involves degrees of freedom in each main direction. It is nearly impossible to understand the plastic behavior of a structure with degrees of freedom, because earthquake is a random event. In fact, an accurately designed structure might still experience specific earthquakes where displacements are concentrated in certain floors, leading to premature collapse.
In this paper, a new plastic behavior is proposed for a structure with degrees of freedom within the plastic range accurately converting it into a structure with one degree of freedom.
2. Overview of the newly proposed system
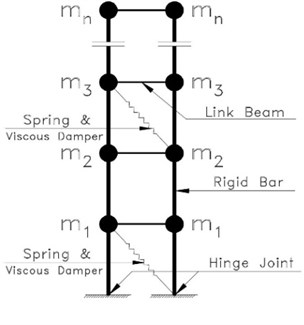
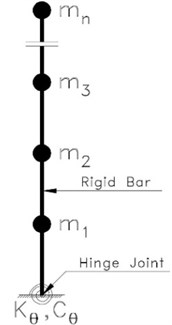
In the proposed method a part of the structure (called rigid core) involves a rocking motion. The rest of the structure is connected by joints to the rigid cores. In the newly proposed method, it is essential to include one or multiple relatively rigid core(s) inside the structure so it can oscillate according to a specific known mode. Moreover, the rigid core is connected to the foundation through a joint. In this configuration, the structure oscillates almost a rigid body, leading to nearly proportional displacements of all floors. In practice, at least two rigid cores (either braced frames or shear walls) are assigned preferably to each side of the building by connecting the joint to foundation for each of the two main directions. Hence, the structure behaves similarly to an inverted pendulum with a joint connection to the ground and a rotational spring showing an inelastic behavior. Nonetheless, force can be applied to the rigid cores in the middle sections by putting two rigid cores adjacent to one another as well as a spring and damper (viscous, visco-elastic, friction, yielding, or link beam, etc.) between the two rigid cores in the middle floors. It should be noted, however, that the rigid cores should be designed to show a fully elastic behavior throughout the earthquake. The inelastic behavior of structures arises from link beams or internal dampers. Fig. 1 displays the idealized configuration for this structure:
Fig. 1a) Two rigid cores involving link beam and spring and viscous dampers, b) the idealized model of a rigid core with torsional spring
a)
b)
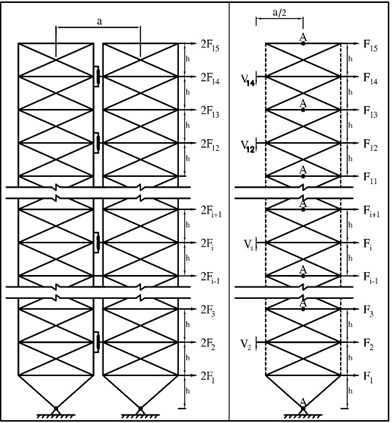
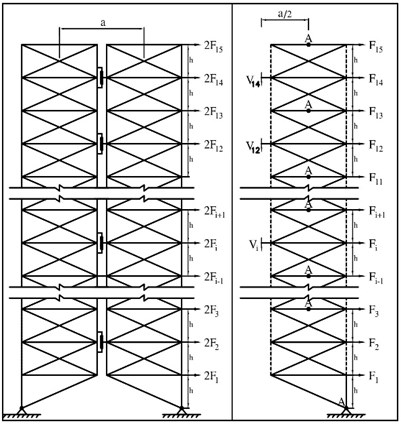
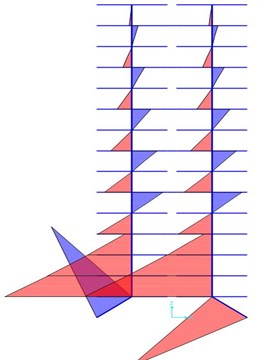
As for actual structures, such rigid core with joint connection to the foundation can be created by one or two bracing spans or one or two spans of steel or concrete shear wall (a steel shear wall is preferred over concrete shear wall owing to its lightness). Fig. 2 illustrates a 15-story frame of the proposed structure, where two rigid cores have been connected to each other by pre-compressed springs and viscous dampers inside the spring in floors 4, 6, 8, 10, 12 and 14.
Fig. 2a) The 15-story rocking structure before and b) after lateral deformation
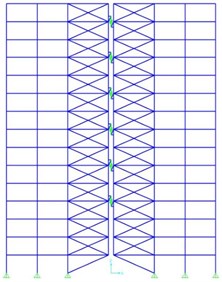
a)
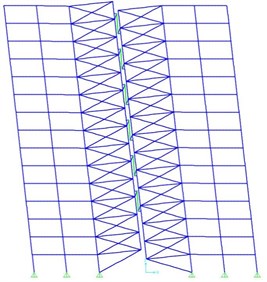
b)
In Fig. 2 the support is displaced from the middle of the rigid core to the side due to widened distance between the supports of the rigid core. This, in turn, mitigates the vertical support response in the rigid core just as the shear force exerted on the link beams between the two rigid cores diminishes according to the span length. Hence, it is highly desirable to include the support at external side of the rigid core.
3. Advantages of the newly proposed system
The new system offers five advantages, including:
• It converts a structure with degrees of freedom in each main direction into a structure with nearly one degree of freedom. This can substantially resolve the problem of uncertain effect of an earthquake on structural behavior, while providing an easier understanding of how the structure behaves and how to better control the structural behavior.
• Given the involvement of a rigid core, the relative displacements are identical on all floors at high accuracy. This, in turn, prevents the displacements from being concentrated in any of the floors, i.e. a soft floor.
• Owing to the rigid core, if one or several springs or dampers are damaged or crushed, the affected floors will not experience failure because the loads of the damaged components are transferred by the rigid core to springs or dampers in other floors, keeping the structure stable. In other words, the rigid core will significantly reduce the premature and progressive collapse of the building. This is not the case in conventional buildings because a damaged floor can initiate a progressive failure in the entire structure.
• Since a rigid core operates within the elastic range, the building is not structurally damaged after the earthquake, the springs and dampers (if damaged) can be repaired at reasonable costs, and there will be no permanent displacement remained in the structure after the earthquake.
• Given the involvement of rigid cores, costs can be minimized by inserting springs and dampers in a few specific floors rather than all floors.
4. Selection of dimensions for the proposed structure, analysis and design
Each floor of the 15-story building is 3.3 meters high, and the structure involves 7 spans. The two spans on the left side and the two spans on the right side are 6 meters long, each of the two rigid cores is 8 meters long, and the middle span is 1 meter long (total span length of 41 meters). The pre-compression force of springs is obtained based on the lateral force exerted on the structure under the seismic force at service level according to Seismic Code 2800, Fourth Edition. This provides the structure with very small, elastic displacements during moderate earthquakes (with an acceleration of one-sixth of that of the design earthquake). Moreover, it can preserve the operational capabilities while preventing the pre-compressed springs from displacement. The project site was assumed to be in Tehran (0.35), and the residential building has a factor of importance (1), the fundamental period of 1.1 sec, and soil classification type III (1.90), resulting in:
The forces exerted on the pre-compressed springs, however, were specified as follows. According to Monograph 360 [16], it is essential to consider two types of load distributions: 1 – load distribution according to the first mode (linear), 2 – uniform load distribution (constant). According to the author’s examination, a linear load distribution can slightly disrupt the linear behavior of rigid cores, because the spring internal forces tend to be greater than uniform load distribution in upper floors, thus leading to significant axial deformation in the rigid core. When employing a uniform load distribution, however, the simultaneous involvement of plastic joints would be far more desirable. Therefore, the lateral seismic forces would be distributed uniformly across the building’s elevation. At the next stage, the forces exerted on the springs were calculated for the lateral force distribution in a way that bending moment exerted on the rigid core (caused by external uniformly distributed forces and the internal pre-compressed spring force) was diminished. In this configuration, the rigid core would not experience substantial bending deformation. Furthermore, the cross-section of braces in the rigid core was specified based on the linear distribution of seismic forces. Hence, the shear deformation of rigid core (which was minimal against flexural deformation) remained constant. The two factors contributed to lower internal deformation in the rigid core, exhibiting a true rigid behavior.
Fig. 3 displays the distribution of forces exerted on the rigid core aiming to create zero bending moment in it.
Fig. 3Internal forces at the rigid core in two configurations: a) support in the middle, b) support on the side
a)
b)
The general distribution of forces in the th story of the rocking building is as illustrated in Fig. 4.
The required spring forces can be obtained by assuming that the bending moment around the center of the rigid core in specified floors (points A) is equal to zero:
In buildings with an even number of floors, the above equation applies to the force exerted on the spring in the lowest floor (Floor 1). As for buildings with an odd number of floors, however, the above equation does not apply to the force exerted on the spring in the lowest floor (Floor 2) (Fig. 5). In this case it can be obtained by Eq. (3):
When the forces are uniformly distributed, an identical lateral force is exerted on all floors. Therefore, it can be obtained through the Eq. (4):
Fig. 4Forces exerted on the rigid core in typical stories of the rocking building
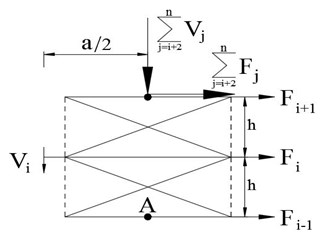
Fig. 5Forces exerted on the rigid core in the lowest floor of a building with an odd number of floors
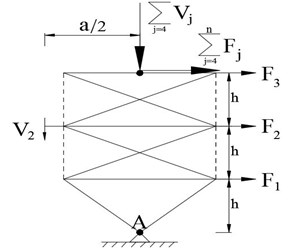
As a result, the equations for calculation of axial forces in springs under uniform distribution of forces can be simplified as Eqs. (5, 6):
In case of buildings with an odd number of floors, the force exerted on springs on the second floor can be obtained through the Eqs. (7, 8):
If , calculated by Eq. (1), is the base shear of operation level earthquake (sum of lateral forces exerted on the two rigid cores) and is the number of floors, then the identical lateral force, exerted on all floors, can be obtained through Eq. (9):
Eqs. (2-9) also apply to the configuration where the support is on the side, except that the sum of forces exerted on springs reduces proportional to the distance between the supports. The following table illustrates the proportions of forces on pre-compressed springs in the 15-story building in two configurations of support on the middle and support on the side for uniform distribution.
Table 1Proportions of pre-compressed spring forces aiming to create zero moment at the rigid core
Story number () | Support on the middle | Support on the side |
14 | 6 | 6 |
12 | 14 | 14 |
10 | 22 | 22 |
8 | 30 | 30 |
6 | 38 | 38 |
4 | 46 | 17.06 |
2 | 66 = 84 | 0 |
SUM | 240 | 127.06 |
According to Table 1, the distance between supports is 9 meters in case of middle support, whereas it is 17 meters in case of side support. Hence, the sum of spring forces in the middle support mode amounts to 9/17 = 0.53. This implies that a few springs should be eliminated in the lower floors so that the sum of forces becomes equal to:
In both cases of middle support and side support, the bending moment curve at the rigid core under uniform lateral load distribution is as shown in Fig. 6.
As it can be seen in Fig. 6, on each two successive floors, the values of negative and positive moments at the rigid core are equal. In spite of lateral forces, there will be a very slight curvature at the rigid core, which in turn substantially facilitates the linear deformation of the rigid core. The distribution of pre-compressed spring forces and stiffness levels, and distribution of damper coefficients are proportional to the values given in Table 1 for the side support. The newly proposed 15-story building was examined initially based on a reference structure. In this reference structure, the pre-compressed spring forces were obtained based on the lateral force of operation level earthquake (distribution according to Table 1) and stiffness of pre-compressed springs was assumed to be 2 % of the structure’s initial stiffness (distribution according to Table 1). The damping coefficients of viscous damper on the 14th floor are as follows: assuming 1 tonf.s/cm. Table 1 displays the distribution of damping coefficients for other floors.
After examining the reference structure, the effects of other factors on structural behavior will was investigated. This study involved several factors transforming and affecting the structural behavior, including:
• Stiffness of pre-compressed springs.
• Damping coefficient of viscous dampers, .
• Damping exponent of viscous dampers, .
Fig. 6Bending moments created at the rigid core in two configurations: a) support at the middle, b) support at the side

a)
b)
Fig. 7Comparison of results obtained by SAP2000 and Perform programs for nonlinear static behavior of a sample single story building
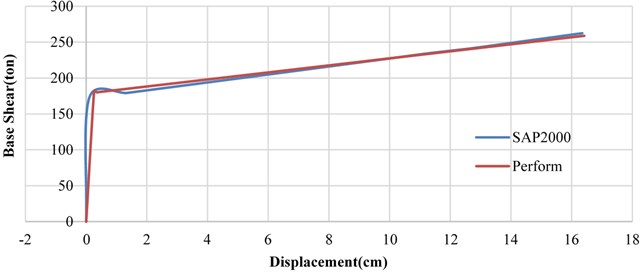
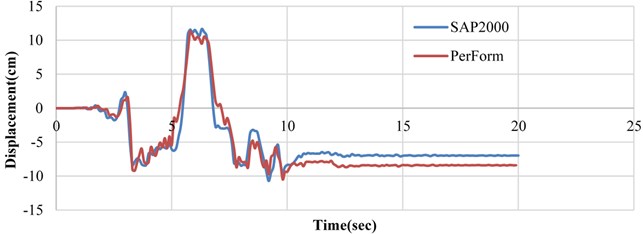
Fig. 8Comparison of time history results obtained by SAP2000 and Perform programs for nonlinear dynamic behavior of a sample single story building
It should be noted that the force of viscous damper is obtained by Eq. (11):
where and represent, respectively, the damping coefficient and damping exponent of the viscous damper. The structure was analyzed by “SAP2000 Ver.19”, where the model was “Multi Linear Elastic” for pre-compressed springs and “Damper Exponential” for viscous dampers. Regarding that based on the available publications, there is no experimental or analytical work similar to the present research, for verification of the two used computer programs, employed for seismic analyses, the nonlinear behavior of a one-story building was analyzed by both computer programs and the results were compared as shown in Fig. 7.
Also, the time history responses of the building obtained by the two programs were compared as presented in Fig. 8.
5. Static inelastic analysis of the proposed reference structure
According to Monograph 360, the proposed reference was analyzed under two loading configurations based on the first mode and uniform distribution. The results suggested that the pre-compressed springs slipped almost simultaneously in all floors (about 10 % difference in displacement). The structure can accommodate any amount of displacement on the roof, whereas the target displacement is maximum 27 cm. The “displacement-base shear” curve in the first loading mode is as Fig. 9.
Fig. 9Displacement-base shear curve and coefficients for load distribution according to the first mode
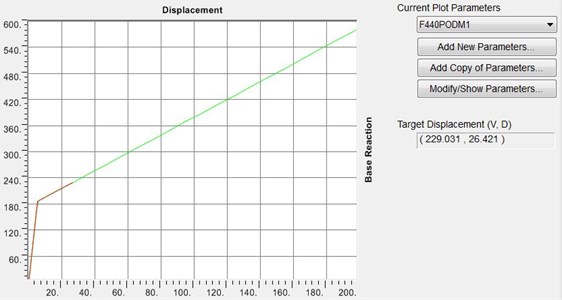
Fig. 10Lateral displacement curves for floors under static inelastic analysis and first mode load distribution
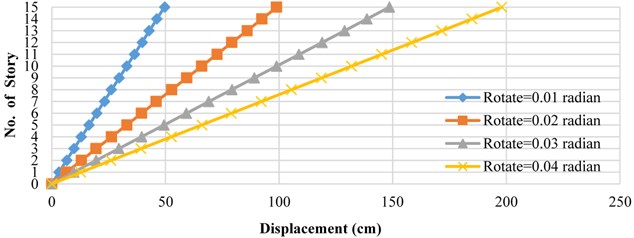
As indicated in the Fig. 9, the structure yields on the curve at a sharp point. This reflects the fact that springs have slipped simultaneously. Such event increases the spring forces at a constant rate. Hence, the logic governing the distribution of forces toward zero bending moment exerted on the rigid core would be always held true. In fact, the rigid-span bending moment will remain zero throughout the analysis. Table 2 displays the relative lateral displacement of floors (in cm) for rotations of 0.01, 0.02, 0.03 and 0.04 radians under the first mode as well as uniform distributions.
Table 2 shows that the maximum difference in relative displacement of floors is 6.1 %. This implies that the rigid core has served its purpose desirably. The lateral displacement curves for the floor under the first loading mode are displayed in Fig. 10.
Table 2Relative displacement of floors for rotations of 0.01, 0.02, 0.03 and 0.04 radians and difference percentages in displacements
First mode load distribution | Uniform load distribution | |||||||
Story | Rot = .01 rad | Rot = .02 rad | Rot = .03 rad | Rot = .04 rad | Rot = .01 rad | Rot = .02 rad | Rot = .03 rad | Rot = .04 rad |
15 | 3.271 | 6.551 | 9.831 | 13.111 | 3.211 | 6.469 | 9.726 | 12.984 |
14 | 3.296 | 6.592 | 9.887 | 13.183 | 3.228 | 6.498 | 9.769 | 13.039 |
13 | 3.309 | 6.610 | 9.911 | 13.212 | 3.240 | 6.516 | 9.791 | 13.067 |
12 | 3.326 | 6.634 | 9.942 | 13.250 | 3.261 | 6.546 | 9.830 | 13.114 |
11 | 3.328 | 6.637 | 9.946 | 13.256 | 3.272 | 6.561 | 9.849 | 13.138 |
10 | 3.328 | 6.637 | 9.947 | 13.257 | 3.283 | 6.576 | 9.870 | 13.163 |
9 | 3.320 | 6.627 | 9.933 | 13.240 | 3.289 | 6.584 | 9.880 | 13.176 |
8 | 3.317 | 6.623 | 9.929 | 13.236 | 3.302 | 6.603 | 9.904 | 13.206 |
7 | 3.298 | 6.597 | 9.897 | 13.197 | 3.302 | 6.603 | 9.904 | 13.205 |
6 | 3.304 | 6.607 | 9.910 | 13.212 | 3.326 | 6.636 | 9.947 | 13.258 |
5 | 3.324 | 6.636 | 9.949 | 13.261 | 3.366 | 6.693 | 10.020 | 13.347 |
4 | 3.321 | 6.633 | 9.945 | 13.256 | 3.383 | 6.717 | 10.051 | 13.386 |
3 | 3.325 | 6.639 | 9.953 | 13.268 | 3.408 | 6.753 | 10.097 | 13.442 |
2 | 3.286 | 6.586 | 9.885 | 13.185 | 3.387 | 6.723 | 10.059 | 13.395 |
1 | 3.148 | 6.391 | 9.634 | 12.877 | 3.244 | 6.522 | 9.801 | 13.079 |
0 | – | – | – | – | – | – | – | – |
Max | 3.328 | 6.639 | 9.953 | 13.268 | 3.408 | 6.753 | 10.097 | 13.442 |
Min | 3.148 | 6.391 | 9.634 | 12.877 | 3.211 | 6.469 | 9.726 | 12.984 |
Variation % | 5.7 % | 3.9 % | 3.3 % | 3.0 % | 6.1 % | 4.4 % | 3.8 % | 3.5 % |
6. Dynamic inelastic analysis of the proposed reference structure
In this section the dynamic inelastic analysis is addressed as a more accurate and more realistic method. This analysis involved 4 Iranian accelerograms, 6 well-known accelerograms and 5 artificial accelerograms for soil type III (a total of 15 accelerograms). The earthquake names, maximum accelerations, velocities and displacements of the accelerograms for maximum acceleration of 1.0 g are as Tables 3, 4.
Table 3The actual earthquakes and their peak values of acceleration, velocity, and displacement
Earthquake | P.G.A. (m/sec2) | P.G.V. (cm/sec) | P.G.D. (cm) |
1-Bam | 9.806 | 185.5 | 117.2 |
2-Naghan | 9.806 | 79.2 | 31.6 |
3-Tabas | 9.806 | 162.9 | 116.4 |
4-Ab Bar | 9.806 | 187.5 | 98.0 |
5-Parkfield | 9.806 | 85.1 | 36.4 |
6-El Centro | 9.806 | 186.4 | 115.6 |
7-Kobe | 9.806 | 187.4 | 78.8 |
8-Northridge | 9.806 | 91.2 | 15.9 |
9-imperial | 9.806 | 99.9 | 44.9 |
10-loma Prieta | 9.806 | 121.5 | 53.2 |
Max | 9.806 | 187.5 | 117.2 |
Min | 9.806 | 79.2 | 15.9 |
Average | 9.806 | 138.7 | 70.8 |
The structural responses were evaluated subjected to accelerograms of different PGA values of 0.25 g, 0.5 g, 0.75 g, 1.0 g, 1.25 g and 1.5 g. The results are as follow.
Table 4Artificial earthquakes and their peak values of acceleration, velocity, and displacement
Earthquake | P.G.A. (m/sec2) | P.G.V. (cm/sec) | P.G.D. (cm) |
Arti-1 | 9.806 | 272.3 | 322.8 |
Arti-2 | 9.806 | 299.5 | 648.4 |
Arti-3 | 9.806 | 287.5 | 168.3 |
Arti-4 | 9.806 | 231.8 | 208.7 |
Arti-5 | 9.806 | 276.4 | 278.5 |
Max | 9.806 | 299.5 | 648.4 |
Min | 9.806 | 231.8 | 168.3 |
Average | 9.806 | 273.5 | 325.3 |
6.1. Displacement curves
The displacement time histories for building floors 1, 3, 5, 7, 9, 11, 13 and 15 of the building were obtained for all 90 cases of dynamic inelastic analysis. For instance, three of the displacement curves are shown in Figs. 11-13.
Fig. 11Displacement histories for floors number 1, 3, 5, 7, 9, 11, 13 and 15 in case of Tabas earthquake (1978) scaled to PGA = 0.75 g
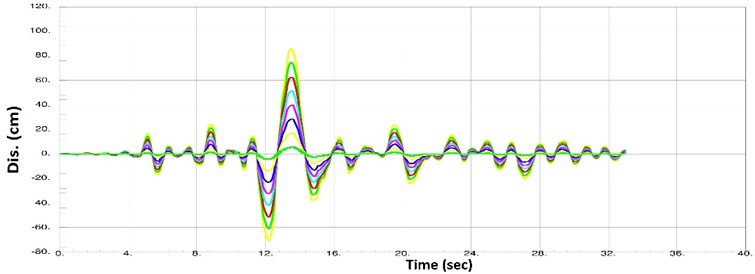
Fig. 12Displacement histories for floors number 1, 3, 5, 7, 9, 11, 13 and 15 in case of Kobe earthquake (1995) scaled to PGA = 0.75 g
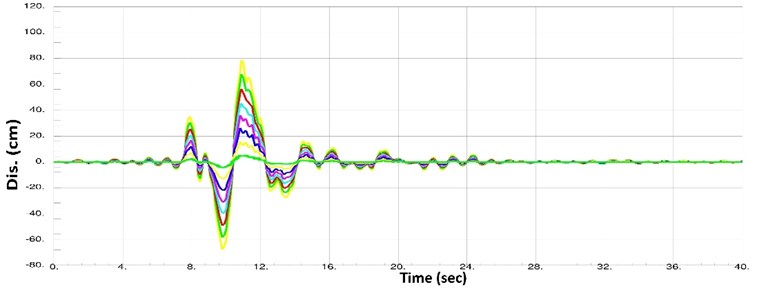
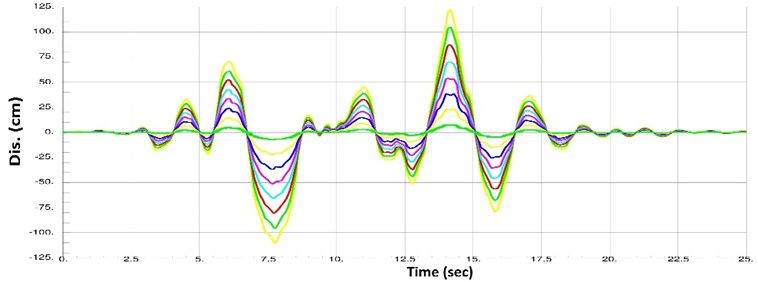
The curves in Figs. 11-13 indicate that all floors of the building have displaced in coordination. In fact, the floors meet zero displacement and maximum and minimum displacements together, reflecting the structural behavior under an almost rigid body mode. In other words, Figs. 11-13 indicate that the rigid core has performed desirably. Hence, no drift concentration occurs in the building’s floors. Furthermore, Figs. 11-13 suggest that the structure returns to its initial state after the earthquake, where there are no permanent displacements. Given the high pre-compressive force in springs, the structure will return even if the walls and non-structural components are damaged. It should be noted that these features were observed in all 90 cases of analysis.
Fig. 13Displacement histories for floors number 1, 3, 5, 7, 9, 11, 13 and 15 in case of the artificial scaled to PGA = 0.75 g
6.2. Rotation in the building floors
The rotation percentages of the building’s roof, which is equal to the ratio of maximum roof lateral displacement to the building’s height, and is same as the rotation of all building’s floors, in case of dynamic inelastic analysis for all 90 earthquake accelerograms are shown in Tables 5, 6.
Table 5Relative building’s rotation percentages for the 10 actual employed earthquakes
P.G.A. (g) | 0 | 0.25 | 0.5 | 0.75 | 1 | 1.25 | 1.5 |
1-Bam | 0 | 0.48 | 1.12 | 1.86 | 2.61 | 3.34 | 4.04 |
2-Naghan | 0 | 0.08 | 0.17 | 0.25 | 0.57 | 0.99 | 1.28 |
3-Tabas | 0 | 0.50 | 1.08 | 1.74 | 2.38 | 3.09 | 3.77 |
4-Ab Bar | 0 | 0.19 | 0.95 | 1.79 | 2.59 | 3.32 | 4.07 |
5-Parkfield | 0 | 0.14 | 0.40 | 1.14 | 1.62 | 2.02 | 2.41 |
6-El Centro | 0 | 0.28 | 1.13 | 1.96 | 2.56 | 3.01 | 3.43 |
7-Kobe | 0 | 0.51 | 1.07 | 1.59 | 2.31 | 3.32 | 4.18 |
8-Northridge | 0 | 0.15 | 0.40 | 0.55 | 0.98 | 1.14 | 1.24 |
9-imperial | 0 | 0.19 | 0.43 | 0.79 | 1.07 | 1.47 | 1.83 |
10-loma Prieta | 0 | 0.28 | 0.75 | 1.16 | 1.51 | 1.83 | 2.16 |
MAX | 0.00 | 0.51 | 1.13 | 1.96 | 2.61 | 3.34 | 4.18 |
MIN | 0.00 | 0.08 | 0.17 | 0.25 | 0.57 | 0.99 | 1.24 |
AVERAGE | 0.00 | 0.28 | 0.75 | 1.28 | 1.82 | 2.35 | 2.84 |
Averages all = 1.55 | |||||||
Table 6Relative building’s rotation percentages for the 5 artificial employed earthquakes
P.G.A. (g) | 0 | 0.25 | 0.5 | 0.75 | 1 | 1.25 | 1.5 |
Arti-1 | 0 | 0.54 | 1.36 | 2.47 | 3.57 | 4.45 | 5.23 |
Arti-2 | 0 | 0.49 | 1.88 | 2.80 | 3.54 | 4.24 | 5.25 |
Arti-3 | 0 | 0.47 | 1.57 | 2.40 | 3.34 | 4.48 | 5.76 |
Arti-4 | 0 | 0.43 | 1.37 | 2.77 | 4.00 | 5.33 | 6.59 |
Arti-5 | 0 | 0.63 | 1.77 | 3.02 | 4.26 | 5.49 | 6.75 |
MAX | 0.00 | 0.63 | 1.88 | 3.02 | 4.26 | 5.49 | 6.75 |
MIN | 0.00 | 0.43 | 1.36 | 2.40 | 3.34 | 4.24 | 5.23 |
AVERAGE | 0.00 | 0.51 | 1.59 | 2.69 | 3.74 | 4.80 | 5.92 |
Averages all = 3.21 | |||||||
As shown in Table 5, the average rotation of the building for the 10 actual employed earthquakes, scaled to PGA = 0.75 g, is 1.28 %.
As shown in Table 6, the average rotation of the building for the 5 artificial employed earthquakes, scaled to PGA = 0.75 g, is 2.69 %.
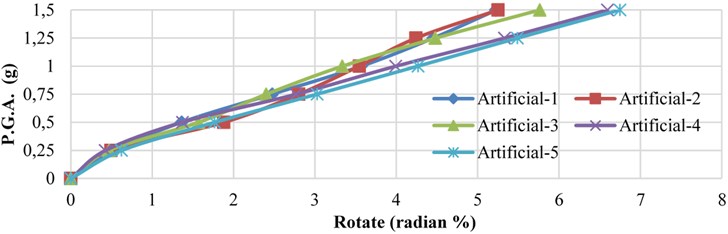
Fig. 14 displays the rotation values for the 5 artificial earthquakes, which have resulted in higher response values comparing to the actual earthquakes.
According to Fig. 14, the relationship between the earthquake peak acceleration and the building’s rotation is almost linear.
Fig. 14Variation of relative floor rotation versus earthquake peak acceleration values for the 5 artificial earthquakes
6.3. Base shear
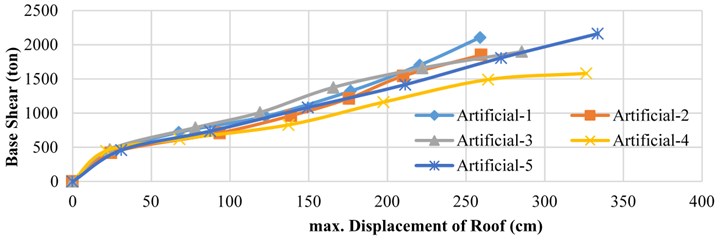
In Fig. 15, variation of the maximum roof displacement with respect to the seismic base shear for PGA values of 0.25 g, 0.50 g, 0.75 g, 1.00 g, 1.25 g, 1.50 g for the 5 artificial earthquake accelerograms are shown.
According to Fig. 15, the curves have a little steeper slope at low acceleration values, comparing with the higher accelerations.
Fig. 15Variation of the maximum roof displacement with seismic base shear for various PGA values in case of the 5 artificial earthquakes
6.4. Force created in pre-compressed springs
Fig. 16 illustrates the curve for pre-compressed springs’ forces with respect to the PGA value of earthquake.
According to Fig. 16, an increase in earthquake acceleration leads to greater spring force with an almost bi-linear behavior.
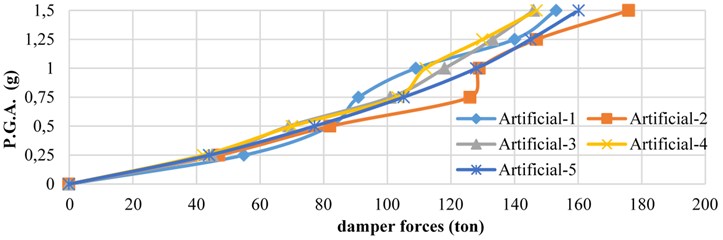
6.5. Force exerted in dampers
Fig. 17 illustrates variation of damper forces with respect to the PGA values of the 5 artificial earthquakes.
According to Fig. 17, an increase in earthquake acceleration leads to spring force with an almost linear relationship.
Fig. 16Maximum force in pre-compressed springs for the 5 artificial earthquakes with various PGA values
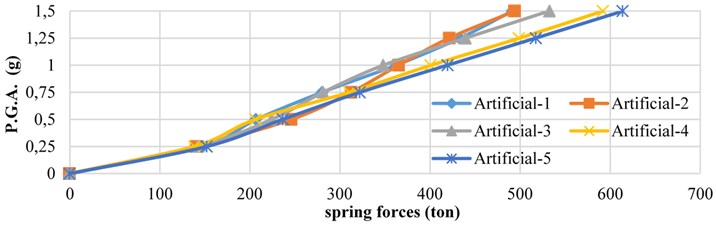
Fig. 17Maximum force curves in dampers for 5 artificial earthquakes
6.6. Effects of stiffness of pre-compressed spring of the reference building on displacements and forces
The previous items all concerned the reference building. However, this section explores the effects of the stiffness value on the roof displacement, base shear and spring and damper forces. Table 7 provides the average results for the 5 artificial accelerograms at with a PGA value of 0.75 g. It should be noted that the third row of the table concerns the reference building.
Table 7Values of floor displacement, base shear, spring and damper forces versus the stiffness values
Stiffness % | Max. Roof Dis. (cm) | Max. Base Shear (ton) | Max. Spring Force (ton) | Max. Damper Force (ton) |
0.5 % | 140.10 | 940.98 | 165.38 | 98.40 |
1 % | 133.36 | 950.22 | 211.44 | 100.18 |
2 %* | 133.34 | 966.78 | 301.02 | 105.18 |
3 % | 125.70 | 1071.22 | 376.22 | 100.66 |
4 % | 116.18 | 1140.26 | 429.04 | 100.56 |
Max | 140.10 | 1140.26 | 429.04 | 105.18 |
Min | 116.18 | 940.98 | 165.38 | 100.18 |
Variation % | –20.59 | +21.18 | +159.43 | ±5.0 |
According to Table 7 an increase in the stiffness of the pre-compressed spring leads to the followings:
1) Reduction of the maximum roof displacement up to 20.6 %.
2) Increase of maximum base shear of the building up to 21.2 %.
3) Increase of maximum spring forces up to 159.4 %.
4) Increase or decrease of the maximum damper forces up to 5 %.
6.7. Effects of damping coefficient of the damper on displacements and forces
This section explores the effects of variation of the damping coefficient in the reference building on the roof displacement, base shear and spring and damper forces. Table 8 provides the average results for the 5 artificial accelerograms with a PGA value of 0.75 g. It should be noted that the third row of the table concerns the reference building
Table 8Values of floor displacement, base shear, spring and damper forces versus the damping coefficient
Damper Coefi. (ton/(cm/sec)) | Max. Roof Dis. (cm) | Max. Base Shear (ton) | Max. Spring Force (ton) | Max. Damper Force (ton) |
0 | 174.78 | 1010.24 | 364.70 | 0.00 |
0.5 | 153.10 | 984.04 | 330.62 | 55.04 |
1* | 133.34 | 966.78 | 300.96 | 105.18 |
1.5 | 116.34 | 981.66 | 276.30 | 142.36 |
2 | 102.32 | 991.60 | 255.42 | 177.52 |
Max | 174.78 | 1010.24 | 364.70 | 177.52 |
Min | 102.32 | 966.78 | 255.42 | 55.04 |
Variation % | –70.82 | ±4.5 | –42.78 | +222.53 |
According to Table 8, an increase in damping coefficient leads to the followings:
1) Reduction of the maximum roof displacement up to 70.8 %.
2) Reduction or increase of the maximum base shear of the building up to 4.5 %.
3) Reduction of the maximum spring forces up to 42.8 %.
4) Increase of the maximum damper forces up to 222.5 %.
6.8. Effects of damping exponent of the damper on displacements and forces
This section explores the effects of variation of the damper’s damping exponent in the reference building on roof displacement, base shear and spring and damper forces. Table 9 provides the average results for the 5 artificial accelerograms with a PGA value of 0.75 g. It should be noted that the third row of the table concerns the reference building.
Table 9Values of floor displacement, base shear, spring and damper forces versus the damping exponent
Damping Exponent | Max. Roof Dis. (cm) | Max. Base Shear (ton) | Max. Spring Force (ton) | Max. Damper Force (ton) |
0.20 | 121.58 | 1010.62 | 282.94 | 100.80 |
0.40 | 128.24 | 985.20 | 293.22 | 102.68 |
0.60* | 133.34 | 966.78 | 301.02 | 105.18 |
0.80 | 137.64 | 967.74 | 307.70 | 106.14 |
1.00 | 141.16 | 973.40 | 313.16 | 107.38 |
Max | 141.16 | 1010.62 | 313.16 | 107.38 |
Min | 121.58 | 966.78 | 282.94 | 102.68 |
Variation % | +16.10 | ± 4.5 | +10.68 | +4.58 |
According to Table 9, an increase in damping exponent leads to the followings:
1) Increase of the maximum roof displacement up to 16.1 %.
2) Reduction or increase of the maximum base shear of the building up 4.5 %.
3) Increase of the maximum spring forces up to 10.7 %.
4) Increase of the maximum damper forces up to 4.6 %.
7. Conclusions
Based on nonlinear static as well as time history analyses by using 10 well-known accelerograms and 5 artificial accelerograms the following conclusions can be made:
• The target displacement of the structure was 27 cm, whereas tolerable displacement is theoretically unlimited.
• The pre-compressed springs began to slip in all floors simultaneously either in static or dynamic analyses. Such event changes the spring forces at a constant rate. Hence, the logic governing the distribution of forces which leads to zero bending moment exerted on the rigid core will always hold true. In fact, the rigid-span bending moment remains zero throughout the analysis.
• Lateral deformation of the structure occurred with a constant slope, so that the relative deformations of all floors were identical at a high accuracy. In fact, the rigid core served its purpose desirably, because the relative displacements of floors were equal, and there was no possibility for the drift to be concentrated in any of the building floors, preventing the building from premature collapse.
• Springs and dampers exhibited great capacities owing to their intrinsic characteristics as well as the equal distribution of drift along the height, preventing its concentration.
• The structure returned to its initial position after the earthquake, with no permanent displacement. Given the high pre-compression force in springs, the structure will return even if some non-structural components are damaged.
• By increasing the pre-compressed spring stiffness floor displacements decrease, while the base shear and springs forces increase.
• Increasing the damping coefficient of the dampers only leads to higher damper forces, while decreases the floors’ displacements and springs forces.
• An increase in the damping exponent increases the floors’ displacements as well as springs and dampers forces.
References
-
Housner G. W. The behavior of inverted pendulum structures during earthquakes. Bulletin of the Seismological Society of America, Vol. 53, Issue 2, 1963, p. 403-417.
-
Hucklebridje A. A., Clough W. R. Seismic response of uplifting building frame. Journal of Structural Division, Vol. 104, Issue 8, 1978, p. 1211-1229.
-
Chopra A. K., Yim S.-C.-S. Simplified earthquake analysis of structures with foundation uplif. Journal of Structural Engineering, Vol. 111, Issue 4, 1985, p. 906-930.
-
Psycharis I. N. Dynamic Behavior of Rocking Structures Allowed to Uplift. Report No. EERL-81-02, Earthquake Engineering Research Laboratory, California Institute of Technology, Pasadena, CA, 1992.
-
Pristly J. N., Evison R. J., Carr A. J. Seismic response of structure free to rock on their foundations. Bulletin of the New Zealand National Society for Earthquake Engineering, Vol. 11, Issue 3, 1998, p. 141-150.
-
Azuhata T., Midorikawa M. Study on applicability of rocking structural systems to building structures. Earthquake Engineering and Structural Dynamics, 2003, https://doi.org/10.1117/12.483985.
-
Midorikawa M., et al. Shaking table tests on seismic response of steel braced frames with column uplift. Earthquake Engineering and Structural Dynamics, Vol. 35, 2006, p. 1767-1785.
-
Azuhata T., Midorikawa M., Ishihara T. Earthquake damage reduction of buildings by self-centering systems using rocking mechanism. The 14th World Conference on Earthquake Engineering, 2008.
-
Eatherton M. R. Large-Scale Cyclic and Hybrid Simulation, Testing and Development of a Controlled-Rocking Steel Building System with Replaceable Fuses. Ph.D. Thesis, University of Illinois at Urbana-Champaign, 2010.
-
Hosseini M., En Farsangi Telescopic columns as a new base isolation system for vibration control of high-rise buildings. Earthquakes and Structures, Vol. 3, Issue 6, 2012, p. 853-867.
-
Hosseini M., Ebrahimi H. Applying ‘deliberate directing of damage’ idea for creation of repairable buildings by using rocking tubular frame structural system and yielding-plate dampers at foundation level. 7th International Conference on Seismology and Earthquake Engineering, Tehran, Iran, 2015.
-
Tremblay R., Mottier P., Rogers C. Seismic retrofit of existing low-rise steel buildings in eastern Canada using rocking braced frame system. 2016, ir.lib.uwo.ca.
-
Hosseini M., Fekri M., Yekrangnia M. Seismic performance of an innovative structural system having seesaw motion and columns equipped with friction dampers at base level. The Structural Design of Tall and Special Buildings, Vol. 25, Issue 16, 2016, p. 842-865.
-
Khalkhali S. M. H., Hosseini M., Aziminejad A. Dividing building’s structure into 4 interactive rocking parts to make it repairable after major earthquakes. 17th World Conference on Earthquake Engineering, Santiago, Chile, 2017.
-
Nejati F., Hosseini M. Design of repairable regular steel buildings with square plan based on seesaw motion of building structure and using DADAS dampers. Journal of Structural, Vol. 8, Issue 3, 2017, p. 326-340.
-
Instructions on Seismic Rehabilitation of Existing Buildings. Monograph No. 360, Presidential Deputy of Strategic Planning and Supervision, Iran, 2013.
About this article

