Abstract
Interface debonding identification is critical for ensuring the safety of steel-reinforced concrete structures. Laer-measured operating deflection shapes (ODSs) can be utilized to precisely designate the presence and location of interface debondings. However, using such densely-sampled ODSs poses a challenge for overcoming intense noise interference. With this concern, this study proposes a noise-robust dynamics feature relying on ODSs, namely Teager-Kaiser energy of multi-resolution ODS, to identify interface debondings in steel-reinforced concrete structures. Owing to the multi-resolution analysis, this feature is capable of suppressing noise; and because of the damage sensitivity of the Teager-Kaiser energy, the feature can intensify damage signatures. The Teager-Kaiser energy of multi-resolution ODS is applied to identify surface debondings on a steel-reinforced concrete slab, whose ODSs are acquired using a scanning laser vibrometer. The experimental results show that the dynamics feature is of strong noise robustness and damage sensitivity, capable of designating the presence and location of the interface debondings under a noisy environment. Furthermore, damage identification using the proposed dynamics feature is a non-baseline method, requiring no structural baseline information such as temperature, materials, geometry, and boundary conditions.
1. Introduction
Steel-reinforced concrete structures are commonly used in civil engineering. Debonding damage between interfaces of steel and concrete can accumulate and develop, thus identification of such damage is critical for ensuring the safety of the structures [1-6]. However, identifying interface debondings in steel-reinforced concrete structures is a challenge for traditional non-destructive testing methods as interface debondings can be barely judged from appearance of steels or concretes.
Structural damage identification relying on operating deflection shapes (ODSs) has attracted increasing attentions. An ODS is defined as the vibrational deflection of a structure subject to a harmonic excitation at an arbitrary loading frequency [7, 8]. With the aid of the non-contact laser measurement using a scanning laser vibrometer (SLV), densely-sampled ODSs can be measured to precisely identify structural damage. Representative studies using SLV-measured ODSs to identify damage in beam-like structures are as follows. Pai and Young [9] proposed a boundary effect detection method using ODSs measured by a SLV to detect small damage in beams, with the damage treated as an introduced boundary. Waldron et al. [10] utilized the SLV to measure a pair of ODSs of healthy and damaged states of a beam, and they used the difference between the pair of ODSs to indicate the presence and location of the damage. Xu et al. [11] proposed an approach for identifying interfacial debonding between dissimilar structural components by reconstructing the distribution of interfacial forces and canvassing local perturbance to the structural dynamic equilibrium. Asnaashari and Sinha [12] utilized a SLV to measure ODSs of a cracked beam corresponding to a natural frequency and a higher harmonic frequency caused by the crack, respectively. The ODSs' difference, defined as a residual ODS, was experimentally validated to be capable of identifying a crack in a beam. Representative studies are as follows. Cao et al. [13] proposed the wavelet-transform curvature ODS for damage detection in beam-like structures. The experimental results show the method can suppress noise and intensify damage signatures.
Although SLV-measured ODSs have been increasingly utilized for structural damage identification, intense noise interference is the most concern of the damage identification methods. To precisely locate damage, ODSs need to be densely sampled to produce sampling intervals small enough to match damage sizes; however, for most damage identification methods relying on ODSs, densely sampling can cause intense noise interference [14-15]. Addressing this problem, this study proposes a noise-robust dynamics feature relying on ODSs, namely Teager-Kaiser energy (TKE) of multi-resolution ODS (MR-ODS), for interface debonding identification in steel-reinforced concrete structures. First, a measured ODS is decomposed into the approximation and details by the WT-based multi-resolution analysis (MRA). Then, by introducing the TKE operator, the TKE of MR-ODS is formulated based on the decomposed ODS. Damage-caused changes in the TKE of MR-ODS can be utilized to designate the presence and location of interface debondings.
The rest of this paper is organized as follows. Section 2 formulates the TKE of MR-ODS. Section 3 applies the TKE of MR-ODS to identify interface debondings in a steel-reinforced concrete slab, whose ODSs are measured via non-contact measurement using a SLV. Section 4 presents the conclusions of this study.
2. Teager-Kaiser energy of MR-ODS
2.1. MR-ODS
By the theory of the MRA [16, 17], an orthonormal, compactly supported wavelet basis of space of measureable, square integral functions is formed by dilating and translating a mother wavelet function :
where and denote sets of real and integer numbers, respectively. satisfies the following two-scale equation:
where is a scaling function that is dilated and translated as:
And satisfies the following two-scale equation:
where and denote quadrature mirror filters and have the relationship:
Based on the orthonormal base expressed in Eq. (1), the space can be spanned by:
Eq. (6) implies that the analysis and synthesis of an ODS in can be, respectively, realized by:
Such wavelets provide a framework for the MRA as stated in the following.
Derived from Eq. (7), forms a subspace of , leading to:
For all , are orthogonal to each other, from which is expressed as:
where denotes summing vector spaces. On the other hand, . forms a subspace of , which leads to . Substituting into Eq. (9) results in:
Thus, a sequence of closed subspaces nested as:
Forms the MRA of .
Based on the above definitions, an ODS in the subspace with the finest resolution can be decomposed into the first to the th level:
where is the approximation of at level in , and is the detail of at level in . Eq. (12) can be implemented by the discrete wavelet transform (DWT) [18]; the fundamental discrete wavelet, the Haar wavelet, is utilized for the MRA in this study. For a damaged beam-like structure, damage features carried in its ODS can be retained in the approximation while the noise components can be separated and contained in the details.
2.2. TKE
Kaiser formulated the TKE operator to measure the TKE of an discrete oscillating signal [19]:
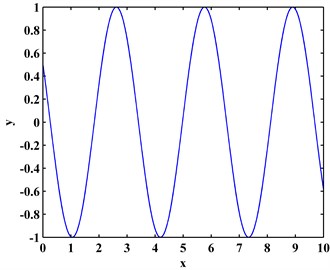
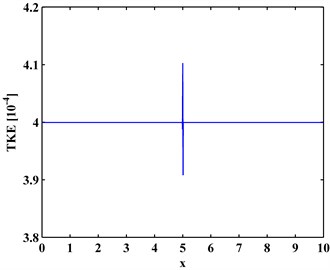
The TKE is very sensitive to slight changes in signals. To demonstrate such sensitivity, consider a signal that is a consine signal with a very slight perturbance at 5:
The signal is discreted with the sampling interval of 0.01, and the discrete is shown in Fig. 1(a); its TKE is calculated by Eq. (13) and shown in Fig. 1(b). In Fig. 1(a), the slight perturbance at 5 causes barely visible change and can be negligible, whereas a peak rapidly arises in the TKE of at the location of perturbance ( 5). Thus, the TKE can sensitively reflect local slight perturbance in a signal.
Fig. 1a) Cosine signal with local slight perturbance and b) its TKE
a)
b)
2.3. TKE of MR-ODS
Damage can cause rapid changes in the TKE of ODSs; in turn, such changes can be utilized to designate the presence and location of damage. However, the TKE operator is very susceptible to noise [19], therefore actual damage-caused changes in the TEK can be masked by the intense noise interference. To this end, noise components need to be separated from ODSs. In accordance with the MRA introduced in Section 2.1, an ODS can be decomposed into the th approximation and the first to th details ( by Eq. (12), and the TKE of ODS can be expressed as:
By discarding the details up to a satisficing level that contain noise components and retaining approximation that contains damage features, the TKE of MR-ODS is formulated, denoted as :
At a satisficing level, noise interference can be basically eliminated in the TKE of MR-ODS; synchronously, damage-caused changes in the TKE of MR-ODS can be utilized to designate the presence and location of damage. It is worth mentioning that the damage identification using the TKE of MR-ODS is a non-baseline method, requiring no structural baseline information such as temperature, materials, geometry, and boundary conditions.
3. Debonding identification in steel-reinforced concrete slabs
3.1. Steel-reinforced concrete slabs with interface debonding
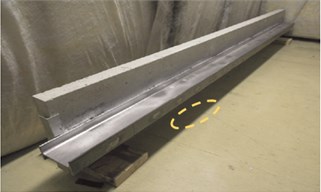
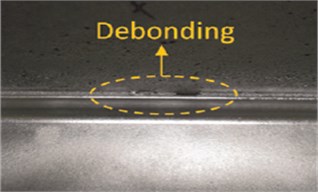
A simply-supported steel-reinforced concrete slab is taken as a specimen. The concrete slab is reinforced externally with an I-shaped steel beam and internally with rebars. The concrete slab is 2350 mm in length, and seven width-through debondings denoted as D1-D7 are scattered at the interface between the I-shaped steel beam and the concrete slab. The steel-reinforced concrete slab is shown in Fig. 2(a) with a zommed-in view of the bebonding labeled in a yellow dashed ellipse (Fig. 2(b)). The locations and sizes of the seven debondings are listed in Table 1.
Table 1Debonding locations and relative sizes
Number of debondings | Location (mm) | Relative size (%) |
D1 | 400-430 | 1.3 |
D2 | 650-690 | 1.7 |
D3 | 890-940 | 2.1 |
D4 | 1160-1230 | 3.0 |
D5 | 1450-1500 | 2.1 |
D6 | 1705-1745 | 1.7 |
D7 | 1950-1980 | 1.3 |
Fig. 2Steel-reinforced concrete slab a) with zoomed-in view of debonding labeled in yellow dashed ellipse b)
a)
b)
3.2. Debonding identification
3.2.1. MR-ODS
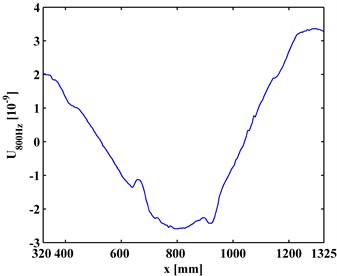
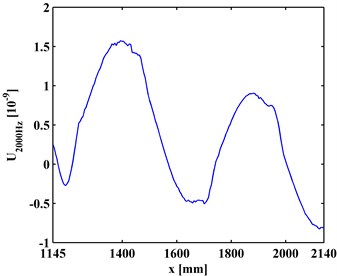
Since the span of the steel-reinforced concrete slab is too long for laser scanning, the inspection region of the is divided into the left inspection region (320-1325 mm) and right inspection region (1145-2140 mm) with a small overlap covering the fourth debonding D4. An electromechanical shaker was attached to the beam at the location of 480 mm away from the left end of the steel beam to generate a flexural harmonic excitation. A SLV was employed to scan the I-shaped steel beam subject to the harmonic excitation, whereby the corresponding ODS of the steel-reinforced concrete slab was measured. The ODSs of the left- and right- inspection regions of the slab were measured using the SLV under arbitrarily selected excitation frequencies, i.e., 800 and 1200 Hz, respectively. The ODSs, denoted as with the angular frequency, for the left and the right inspection regions at 800 Hz and 2000 Hz are shown in Figs. 3(a) and 3(b), respectively.
Fig. 3ODSs for a) left and b) right inspection regions at 800 Hz and 2000 Hz, respectively
a)
b)
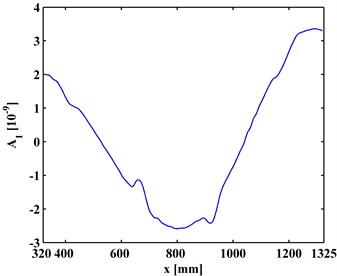
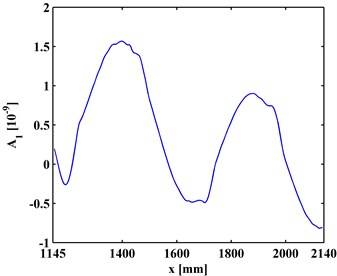
Fig. 4The first-level approximations of ODSs for a) left and b) right inspection regions at 800 Hz and 2000 Hz, respectively
a)
b)
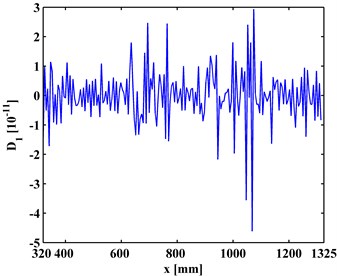
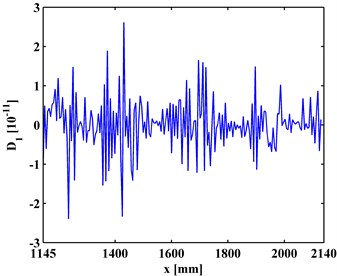
Fig. 5The first-level details of ODSs for a) left and b) right inspection regions at 800 Hz and 2000 Hz, respectively
a)
b)
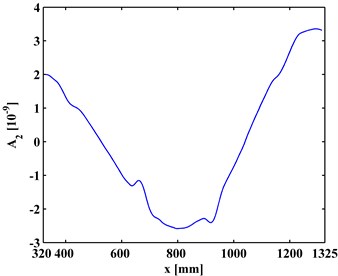
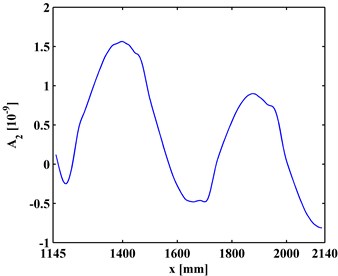
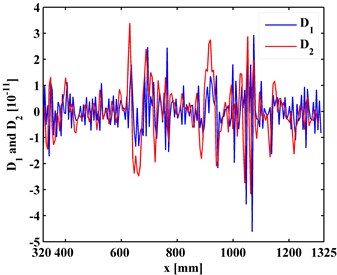
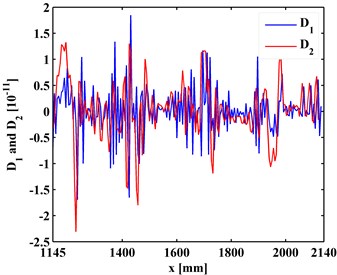
By Eq. (12), the first-level ( 1) approximations and details are extracted from the ODSs of the left and right inspection regions of the slab, shown in Figs. 4 and 5, respectively. By comparing Figs. 3 and 4, it can be seen that the approximations are much smoother that the ODSs. Similarly, the second-level ( 2) approximations (Fig. 6) together with details and (Fig. 7) are extracted from the ODSs. It can be seen that by increasing the decomposition level in the MRA, approximations become smoother (Figs. 4 and 6) because more noise components are separated from the ODSs (Figs. 5 and 7).
Fig. 6The second-level approximations of ODSs for a) left and b) right inspection regions at 800 Hz and 2000 Hz, respectively
a)
b)
Fig. 7The first- and second-level details of ODSs for a) left and b) right inspection regions at 800 Hz and 2000 Hz, respectively
a)
b)
3.2.2. TKE of MR-ODS
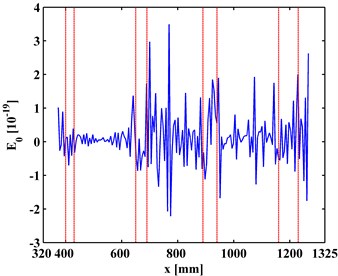
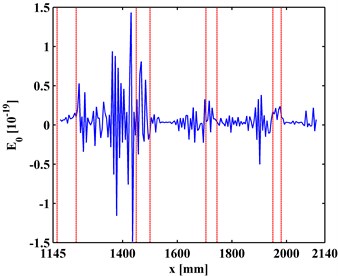
The TKE of MR-ODSs are obtained by Eq. (16) with values in the boundary-effect interval vanished [20]. For the finest resolution with level being zero, the approximations of the ODSs are the ODSs themselves, and the corresponding TKE of ODS is denoted as . is shown in Fig. 8 with the actual debonding locations bounded by pairs of red dashed lines. It can be seen from Fig. 8 that intense noise interference dominates the results and debonding-caused peaks are totally masked.
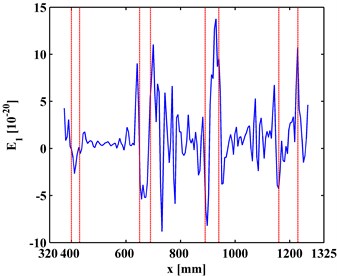
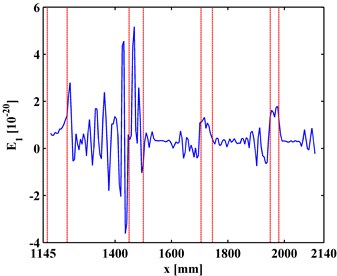
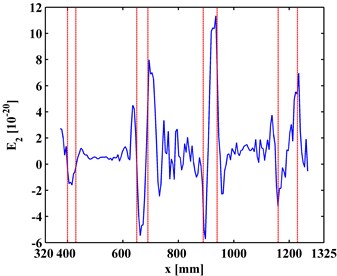
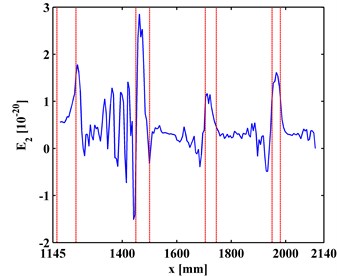
For the first-level ( 1), the corresponding TKE of MR-ODS, denoted as is obtained and shown in Fig. 9, where noise interference is suppressed and debonding-caused peaks to appear at locations of actual debondings. For the first-level ( 2), the corresponding TKE of MR-ODS, denoted as is obtained and shown in Fig. 10, where noise interference is basically eliminated and debonding-caused peaks can be clearly identified, corresponding to the actual debonding locations bounded by pairs of red dashed lines. For this scenario, the second level can be regarded as the satisficing level. It should be noted that the fourth peak for the left inspection region (Fig. 10(a)) and the first peak for the right inspection region (Fig. 10(b)) indicate the same debonding D4 as the two inspection regions have an overlap covering the fourth debonding.
The experimental results show that the TKE of MR-ODS is of strong noise robustness and damage sensitivity, and can be applied to designate the presence and location of interface debondings of a steel-reinforced concrete slab under a noisy environment.
Fig. 8TKE of ODS for a) left and b) right inspection regions at 800 Hz and 2000 Hz, respectively
a)
b)
Fig. 9TKE of MR-ODS in the first level for a) left and b) right inspection regions at 800 Hz and 2000 Hz, respectively
a)
b)
Fig. 10TKE of MR-ODS in the second level for a) left and b) right inspection regions at 800 Hz and 2000 Hz, respectively
a)
b)
4. Conclusions
Identifying surface debondings between steel and concrete is critical for ensuring the safety of the steel-reinforced concrete structures. Laser-measured ODSs are of dense sampling and have been increasingly utilized for structural damage identification; however, noise interference is the most concern for such ODSs. This study proposes a noise-robust dynamics feature relying on ODSs, namely TKE of MR-ODS, to identify surface debondings in steel-reinforced concrete structures. The capability of the proposed dynamics feature to identify surface debondings is validated on a steel-reinforced concrete slab, whose ODSs are acquired using a SLV. Some conclusions are drawn as follows.
1) Owing to the MRA, a measured ODS can be decomposed into the approximation that contains damage features and details that contain noise components.
2) Owing to the sensitivity of the TKE to slight changes in signals, damage-caused changes in the TKE of MR-ODS can be utilized to designate the presence and location of damage.
3) Damage identification using the TKE of MR-ODS is a non-baseline method, requiring no structural baseline information such as temperature, materials, geometry, and boundary conditions.
References
-
Farrar C. R., Worden K. An introduction to structural health monitoring. Philosophical Transactions of The Royal Society A: Mathematical Physical and Engineering Sciences, Vol. 365, 2007, p. 303-315.
-
Ou J., Li H. Structural health monitoring in mainland China: Review and future trends. Structural Health Monitoring, Vol. 9, Issue 3, 2010, p. 219-231.
-
Manoach E., Samborski S., Mitura A., Warminski J. Vibration based damage detection in composite beams under temperature variations using Poincare maps. International Journal of Mechanical Sciences, Vol. 62, 2012, p. 120-132.
-
An Y., Ou J. Experimental and numerical studies on model updating method of damage severity identification utilizing four cost functions. Structural Control and Health Monitoring, Vol. 20, Issue 1, 2013, p. 107-120.
-
Wang S., Ren Q., Qiao P. Structural damage detection using local damage factor. Journal of Vibration and Control, Vol. 12, Issue 9, 2006, p. 955-973.
-
Cao M. S., Ding, Y. J., Ren W. X., Wang Q., Ragulskis M., Ding Z. C. Hierarchical wavelet-aided neural intelligent identification of structural damage in noisy conditions. Applied Sciences, Vol. 7, Issue 4, 2017, https://doi.org/10.3390/app7040391.
-
Schwarz B. J., Richardson M. H. Introduction to operating deflection shapes. CSI Reliability Week, Vol. 10, 1999, p. 121-126.
-
Bae W., Kyong Y., Dayou J., Park K., Wang S. Scaling the operating deflection shapes obtained from scanning laser Doppler vibrometer. Journal of Nondestructive Evaluation, Vol. 30, Issue 2, 2011, p. 91-98.
-
Pai P. F., Young L. G. Damage detection of beams using operational deflection shapes. International Journal of Solids and Structures, Vol. 38, Issue 18, 2001, p. 3161-3192.
-
Waldron K., Ghoshal A., Schulz M. J., Sundaresan M. J., Ferguson F., Pai P. F., Chuang J. H. Damage detection using finite element and laser operational deflection shapes. Finite Elements in Analysis and Design, Vol. 38, Issue 3, 2002, p. 193-226.
-
Xu H., Su Z., Cheng L., Guyader J. L., Hamelin P. Reconstructing interfacial force distribution for identification of multi-debonding in steel-reinforced concrete structures using noncontact laser vibrometry. Structural Health Monitoring, Vol. 12, Issues 5-6, 2013, p. 507-521.
-
Asnaashari E., Sinha J. K. Development of residual operational deflection shape for crack detection in structures. Mechanical Systems and Signal Processing, Vol. 43, Issue 1, 2014, p. 113-123.
-
Cao M., Zhu X., Xu W., Li X., Xu H., Manoach E. Detection of debonding in steel-reinforced bridges using wavelet curvature features of laser-measured operating deflection shapes. Journal of Vibroengineering, Vol. 19, Issue 3, 2017, p. 1845-1853.
-
Cao M., Cheng L., Su Z., Xu H. A multi-scale pseudo-force model in wavelet domain for identification of damage in structural components. Mechanical Systems and Signal Processing, Vol. 28, Issue 2, 2012, p. 638-659.
-
Yang Z., Radzienski M., Kudela P., Ostachowicz W. Damage detection in beam-like composite structures via Chebyshev pseudo spectral modal curvature. Composite Structures, Vol. 168, 2017, p. 1-12.
-
Mallat S. A theory for multiresolution signal decomposition: The wavelet representation. IEEE Transactions on Pattern Analysis and Machine Intelligence, Vol. 11, Issue 7, 1989, p. 674-693.
-
Cao M., Qiao P. Integrated wavelet transform and its application to vibration mode shapes for the damage detection of beam-type structures. Smart Materials and Structures, Vol. 17, Issue 5, 2008, p. 55014-1.
-
Mallat S. A Wavelet Tour of Signal Processing. Academic Press, 2008.
-
Kaiser J. F. On a simple algoritm to calculate the energy of a signal. Proceedings of the Acoustics, Speech and Signal Processing, 1990.
-
Xu W., Cao M., Ding, K.,Radzienski M., Ostachowicz W. Crack identification in CFRP laminated beams using multi-resolution modal Teager-Kaiser energy under noisy environments. Materials, Vol. 10, 2017, https://doi.org/10.3390/ma10060656.
About this article
The authors are grateful for the partial support provided by the Natural Science Foundation of China (No. 11772115). The authors are also grateful for the experimental support from Dr. Hao Xu in The Hong Kong Polytechnic University.
