Abstract
Hidden damage severely threatens the safety of structures due to its invisibility and indistinguishability. Debonding is typical hidden damage in steel-reinforced bridges. Detection of multiple debondings in steel-reinforced bridges poses a challenge for traditional nondestructive methods that require damage location as prior knowledge, but this condition is usually not satisfied for debonding located within the bridge. Differing from existing studies, this study explores a vibrational method of detecting multiple debondings needing no prior knowledge, that uses a scanning laser vibrometer to acquire densely-sampled operating deflection shapes of bridges. The operating deflection shape carries richer information than mode shapes for damage characterization. Nevertheless, densely-sampled deformed quantities are commonly susceptible to noise when used to identify damage. To detect multiple debondings, a new feature is developed, the wavelet-transform curvature operating deflection shape. This feature is used to identify multiple debondings in a steel-reinforced concrete slab dismantled from a bridge, clearly demonstrating the strengths of suppressing noise, intensifying the signatures of debonding, and requiring no prior knowledge of damage location. The proposed method holds promise for detecting multiple hidden damage in various structures besides bridges.
1. Introduction
Damage can impair the integrity and reduce the performance of a structure, thereby threatening structural safety. Hidden damage, such as debonding, is barely visible from appearance and thus difficult to identify, for which reason the identification of hidden damage is highly challenging. The development of methods to identify hidden damage is a research focus of increasing interest in the civil, mechanical, military, and aerospace fields. Debonding is a common type of hidden damage in a steel-reinforced bridge; identification of such debonding is critical for ensuring the safety of the bridge. However, debonding detection in steel-reinforced bridges poses a challenge for traditional nondestructive methods that require prior knowledge of the location of damage, but this condition is usually not satisfied for debonding located within the bridge.
Differing from nondestructive methods, vibration-based damage detection methods that rely on changes in natural frequencies, mode shapes, damping, and their derivatives to characterize damage have been rapidly developed [1-6]. In particular, the operating deflection shape (ODS) as a generalized mode shape has been increasingly utilized for structural damage detection. Traditionally, an ODS is defined as the vibrational deflection of a structure subjected to a harmonic excitation at an arbitrary loading frequency [7, 8]. When the loading frequency is a natural frequency, a mode shape is provoked as a particular ODS.
Recently, the emerging scanning laser vibrometer (SLV) is becoming an advanced tool to measure ODSs. The SLV features non-contact measurement, much higher resolution and greater accuracy than conventional sensors; moreover, it adds no mass or stiffness effect to the structure under investigation. Representative studies using SLV-measured ODSs to identify damage in a beam, the prototype of a bridge, are as follows. Pai and Young [9] proposed a boundary effect detection method using ODSs measured by a SLV to detect small damage in beams, with the damage treated as an introduced boundary. Waldron et al. [10] utilized the SLV to measure a pair of ODSs of healthy and damaged states of a beam, and they used the difference between the pair of ODSs to indicate the presence and location of the damage. Xu et al. [11] proposed an approach for identifying interfacial debonding between dissimilar structural components by reconstructing the distribution of interfacial forces and canvassing local perturbance to the structural dynamic equilibrium. Asnaashari and Sinha [12] utilized a SLV to measure ODSs of a cracked beam excited at a natural frequency, clearly evincing the higher harmonic frequency caused by the crack, respectively. The difference between the ODSs, defined as a residual ODS, was experimentally validated to be capable of identifying a crack in a beam.
To precisely locate damage, ODSs need to be densely sampled with tiny spatial sampling intervals. Commonly, densely-sampled deformed quantities evince the difficulty of susceptibility to noise when used to identify damage [13-15]. Hence, the susceptibility of a densely-sampled ODS to noise is the major concern for using it to identify damage. To detect damage while tolerating noise interference, this study aims to develop a sophisticated damage identification method relying on densely-sampled ODSs measured by a SLV. The method consists of two components: (i) the curvature of an ODS, called the curvature operating deflection shape (CODS). Damage-caused loss of bending stiffness leads to changes in CODSs; in turn, such changes can be utilized to designate the presence and location of damage [16, 17]. As bending stiffness can be reduced in the location of hidden damage such as debonding, the CODS can be employed for hidden damage identification; (ii) a wavelet-transform curvature operating deflection shape (WT-CODS) is derived from the CODS by using the wavelet transform to promote the CODS. The WT-CODS provides a noise-robust feature for portraying hidden damage. The performance of the WT-CODS is validated in identifying multiple debondings in a steel-reinforced concrete slab dismantled from a bridge model.
2. Formulation of WT-CODS
2.1. CODS
Similar to the definition of the traditional curvature mode shape (CMS) of a beam proposed by Pandey [18], the CODS is defined as the second-order derivative of an ODS at frequency [16, 17]:
where is the bending moment, is the bending stiffness with being Young’s modulus and the moment of inertia, and and (the prime denotes the differentiation) are the ODS and CODS of the beam at the frequency , respectively. Eq. (1) implies that can be approximately obtained by the second-order central difference of with the sampling interval .
Damage can change the , causing discontinuity in ; in turn, this discontinuity is likely to manifest the presence, location, and even extent of the damage. Theoretically, the CODS provides a dynamic feature for indicating structural damage including hidden damage such as debonding. Nevertheless, the CODS has a noticeable drawback of being susceptible to noise, due to the second-order differentiation involved in Eq. (1), which can amplify any slight noise involved in the ODS used to generate the CODS [13-15].
2.2. WT-CODS
The WT can be expressed as [19, 20]:
where denotes the WT coefficient of a signal with and being the scale and translation parameters, respectively; ; denotes the complex conjugate of ; denotes the convolution of with , with denoting convolution.
Starting with the Gaussian function , the Mexican hat wavelet is derived as
by expanding the CODS in the wavelet domain using , WT-CODS is derived as
Superior to the CODS, the WT-CODS can suppress noise interference and intensify damage signature under the framework of the multi-scale analysis: noise components can be suppressed and the damage signature can be intensified as the scale increases. When the scale reaches a certain value, the damage signature stands out clearly as a peak across scales, totally overwhelming the noise components. Moreover, the WT-CODS inherits the merits of the CODS in characterizing damage with no need of prior knowledge such as the location and type of damage, or the material parameters and boundary conditions of the structure being inspected.
3. Experiment
A concrete slab of 2350 mm long in the -direction (beam length) reinforced externally with an I-shaped steel beam and internally with rebars, dismantled from a bridge model, is taken as the specimen [11]. Seven through-width debondings denoted D1-D7 are scattered at the interface between the concrete slab and the steel beam, to simulate multiple debondings in a real bridge. A debonding is zoomed-in for detailed display at the lower part of Fig. 1. The locations and sizes of the seven debondings are listed in Table 1. The concrete slab is simply supported at its two ends for testing.
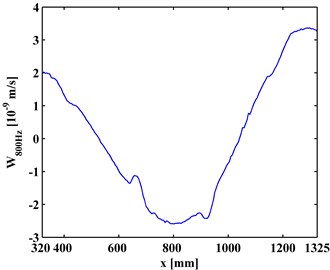
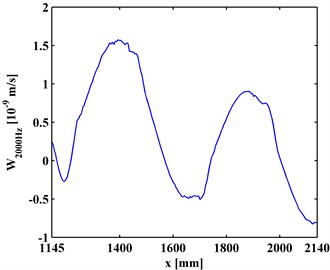
A SLV is employed to measure the ODSs of the I-shaped component of the steel beam. Because its span is too long for laser scanning, the inspection region of the reinforced slab is divided into a left inspection region (320-1325 mm) and a right inspection region (1145-2140 mm) with a small overlap covering the fourth debonding (D4). An electromechanical shaker is attached to the steel beam 480 mm from its left end to generate a transverse force excitation. ODSs of the left and right inspection regions of the steel beam are measured using the SLV under arbitrarily selected excitation frequencies, in this case, 800 and 1200 Hz. The ODSs, , for the left and the right inspection regions at 800 Hz and 2000 Hz are shown in Figs. 2(a) and 2(b), respectively.
Fig. 1Steel-reinforced concrete slab with zoomed-in view of debonding
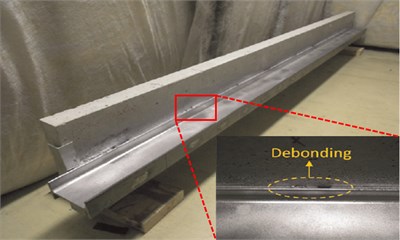
Table 1Locations and sizes of debonding zones
Debonding zones | Location (mm) | Relative span to length (%) |
D1 | 400-430 | 1.3 |
D2 | 650-690 | 1.7 |
D3 | 890-940 | 2.1 |
D4 | 1160-1230 | 3.0 |
D5 | 1450-1500 | 2.1 |
D6 | 1705-1745 | 1.7 |
D7 | 1950-1980 | 1.3 |
Fig. 2ODSs for a) left and b) right inspection regions at 800 Hz and 2000 Hz, respectively
a)
b)
4. Debonding detection
4.1. CODS
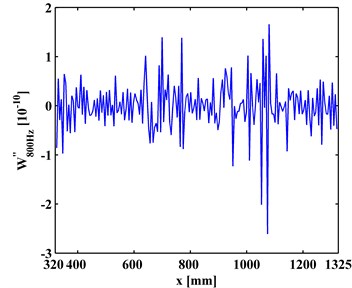
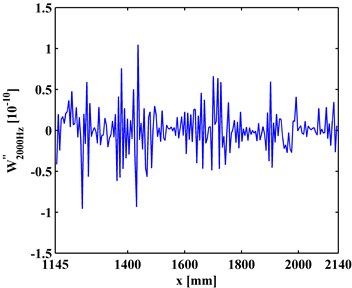
The CODSs, , obtained by Eq. (1), are presented in Figs. 3(a) and 3(b). It can be seen in Fig. 3 that noise interference masks any debonding-caused changes, from which no debonding can be identified.
4.2. WT-CODS
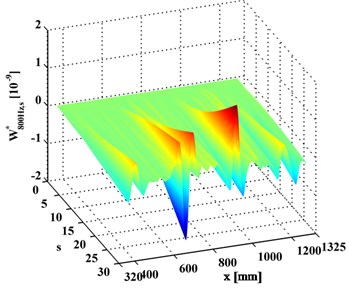
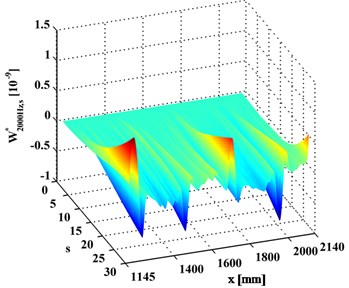
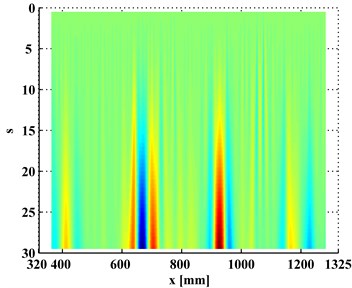
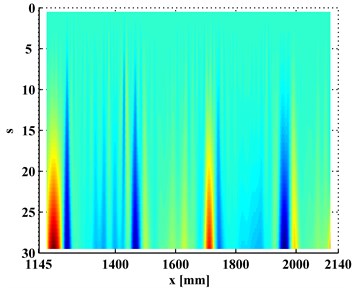
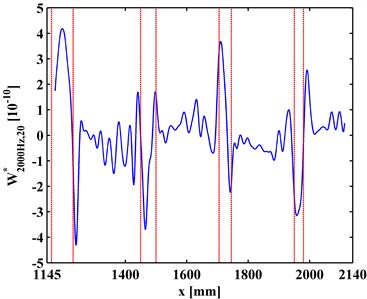
In contrast, the WT-CODS, , obtained by Eq. (5), are shown in Figs. 4(a) and 4(b), where four singular peaks stand out, definitely indicating the presence of the four debondings in each inspection section. In planforms of the (Figs. 5(a) and 5(b)), four singularity peaks that arise across scales in the -axis distinctly pinpoint the debonding of each inspection region. It should be noted that the fourth peak of the left inspection region (Fig. 5(a)) and the first peak of the right inspection region (Fig. 5(b)) indicate the same debonding, as the two inspection regions have an overlap covering the fourth debonding.
Fig. 3CODSs for a) left and b) right inspection regions at 800 Hz and 2000 Hz, respectively
a)
b)
Fig. 4WT-CODSs for a) left and b) right inspection regions at 800 Hz and 2000 Hz, respectively
a)
b)
Fig. 5Planforms of WT-CODSs for a) left and b) right inspection regions at 800 Hz and 2000 Hz, respectively
a)
b)
4.3. Multiscale effect of WT-CODS
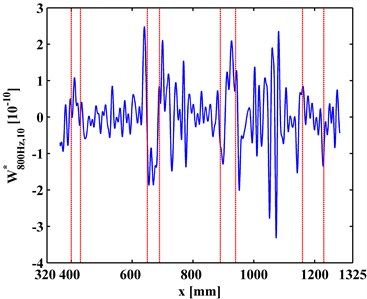
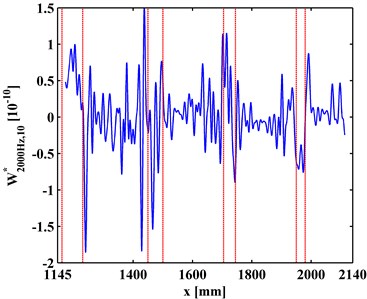
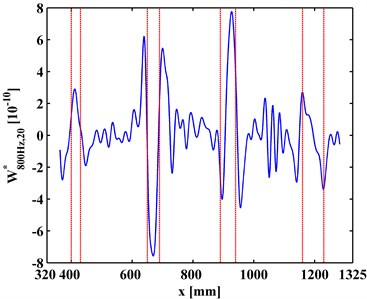
at a scale is a slice of . Variation of with the increase of is investigated to clarify the multiscale effect of WT-CODS on the characterization of debonding. with respect to 800 Hz for the left inspection region at 10, 20, 30 are extracted from , leading to , , and (Figs. 6(a), 7(a), and 8(a)), respectively. Similarily, with respect to 2000 Hz for the right inspection region at 10, 20, 30 are obtained from giving and (Figs. 6(b), 7(b), and 8(b)), respectively. In Figs. 6-8, the actual location of each debonding is bounded by a pair of dashed red lines. In the case of 10, noise components dominate and , from which it is difficult to discriminate the debonding-caused singular peaks (Fig. 6); in the case of 20, noise interference is largely alleviated in and , from which the singular peaks can basically imply debondings except for some uncertainty about the debonding D4 (Fig. 7); in the case of 30, noise components are entirely removed from , and the singular peaks unambiguously delineate the locations of the debondings (Fig. 8), in fair agreement with the actual debonding location bounded by each pair of dashed red lines.
The variations of the peak value indicating debonding and the signal-to-noise ratio (SNR) with the increase of s from 10, 20 to 30 are tabulated in Tables 2 and 3, respectively. Clearly, in Table 2 the peak value increases with the increase of the scale, signifying the intensification of the debonding signature; in Table 3, the SNR increases with the increase of the scale, indicating the gradual suppression of noise interference. These observations indicate the multiscale effect of the WT-CODS, which endows the method with distinct merits in characterizing debonding in the steel-reinforced concrete slab.
Fig. 6WT-CODSs at scale of 10 for a) left and b) right inspection regions at 800 Hz and 2000 Hz, respectively, with actual debonding locations indicated by pairs of dashed red lines
a)
b)
Fig. 7WT-CODSs at scale of 20 for a) left and b) right inspection regions at 800 Hz and 2000 Hz, respectively, with actual debonding locations indicated by pairs of dashed red lines
a)
b)
Fig. 8WT-CODSs at scale of 30 for a) left and b) right inspection regions at 800 Hz and 2000 Hz, respectively, with actual debonding locations indicated by pairs of dashed red lines
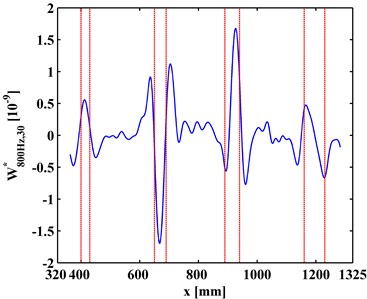
a)
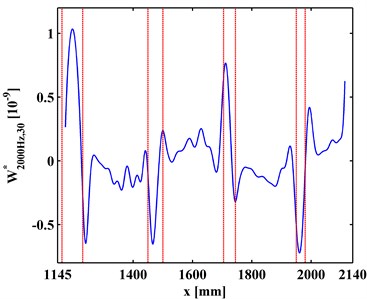
b)
Table 2Variation of peak value with the increase of scale
WT-CODSs and debondings | Peak value (10-9) | |||
10 | 20 | 30 | ||
D1 | 0.109 | 0.284 | 0.527 | |
D2 | 0.187 | 0.746 | 1.683 | |
D3 | 0.209 | 0.765 | 1.673 | |
D4 | 0.135 | 0.321 | 0.640 | |
D4 | 0.100 | 0.418 | 1.030 | |
D5 | 0.154 | 0.369 | 0.653 | |
D6 | 0.113 | 0.358 | 0.756 | |
D7 | 0.076 | 0.314 | 0.723 | |
Table 3Variation of SNR with the increase of scale
WT-CODSs | SNR | ||
10 | 20 | 30 | |
42.81 | 57.41 | 64.95 | |
43.00 | 58.17 | 65.97 | |
5. Conclusions
This study proposes a new damage feature, WT-CODS, for identification of hidden damage in beam-type structures. The capability of the WT-CODS to detect hidden damage is validated by identifying multiple debondings in a steel-reinforce concrete slab dismantled from a bridge, with the ODSs acquired using a SLV. Some appealing observations about the proposed WT-CODS in characterizing hidden damage are as follows.
1) The multiscale analysis properties of the WT transmit the superior characteristics of the WT-CODS to the CODS in portraying debondings of steel-reinforced concrete slab.
2) The WT-CODS can eliminate noise components while intensifying damage features as the scale increases, whereby damage can be identified under noisy conditions.
3) The WT-CODS inherits the merits of the CODS in characterizing damage while requiring no prior knowledge of features such as the location and type of the damage and the material parameters and boundary conditions of the structure under inspection.
4) With the aid of long-distance laser measurement, the WT-CODSs relying on laser-measured ODSs have the potential to identify multiple hidden damage such as debonding in real large-scale bridges.
References
-
Farrar C. R., Worden K. An introduction to structural health monitoring. Philosophical Transactions of the Royal Society A: Mathematical, Physical and Engineering Sciences, Vol. 365, 2007, p. 303-315.
-
An Y. H., Ou J. P. Experimental and numerical studies on model updating method of damage severity identification utilizing four cost functions. Structural Control and Health Monitoring, Vol. 20, Issue 1, 2013, p. 107-120.
-
Xu B., Song G., Masri S. F. Damage detection for a frame structure model using vibration displacement measurement. Structural Health Monitoring-an International Journal, Vol. 11, Issue 3, 2011, p. 281-292.
-
Wang S. S., Ren Q. W., Qiao P. Z. Structural damage detection using local damage factor. Journal of Vibration and Control, Vol. 12, Issue 9, 2006, p. 955-973.
-
Lam H., Yin T. Dynamic reduction-based structural damage detection of transmission towers: practical issues and experimental verification. Engineering Structures, Vol. 33, 2011, p. 1459-1478.
-
Song G., Li H., Gajic B., Zhou W., Chen P., Gu H. Wind turbine blade health monitoring with piezoceramic-based wireless sensor network. International Journal of Smart and Nano Materials, Vol. 4, Issue 3, 2013, p. 150-166.
-
Schwarz B. J., Richardson M. H. Introduction to operating deflection shapes. CSI Reliability Week, Vol. 10, 1999, p. 121-126.
-
Bae W., Kyong Y., Dayou J., Park K., Wang S. Scaling the operating deflection shapes obtained from scanning laser doppler vibrometer. Journal of Nondestructive Evaluation, Vol. 30, Issue 2, 2011, p. 91-98.
-
Pai P. F., Young L. G. Damage detection of beams using operational deflection shapes. International Journal of Solids and Structures, Vol. 38, Issue 18, 2001, p. 3161-3192.
-
Waldron K., Ghoshal A., Schulz M. J., Sundaresan M. J., Ferguson F., Pai P. F., Chuang J. H. Damage detection using finite element and laser operational deflection shapes. Finite Elements in Analysis and Design, Vol. 38, Issue 3, 2002, p. 193-226.
-
Xu H., Su Z., Cheng L., Guyader J.-L., Hamelin P. Reconstructing interfacial force distribution for identification of multi-debonding in steel-reinforced concrete structures using noncontact laser vibrometry. Structural Health Monitoring, Vol. 12, Issues 5-6, 2013, p. 507-521.
-
Asnaashari E., Sinha J. K. Development of residual operational deflection shape for crack detection in structures. Mechanical Systems and Signal Processing, Vol. 43, Issue 1, 2014, p. 113-123.
-
Cao M. S., Radzieński M., Xu W., Ostachowicz W. Identification of multiple damage in beams based on robust curvature mode shapes. Mechanical Systems and Signal Processing, Vol. 46, Issue 2, 2014, p. 468-480.
-
Cao M. S., Xu W., Ostachowicz W., Su Z. Q. Damage identification for beams in noisy conditions based on Teager energy operator-wavelet transform modal curvature. Journal of Sound and Vibration, Vol. 333, Issue 6, 2014, p. 1543-1553.
-
Cao M. S., Xu W., Ren W., Ostachowicz W., Sha G. G., Pan L. A concept of complex-wavelet modal curvature for detecting multiple cracks in beams under noisy conditions. Mechanical Systems and Signal Processing, Vol. 76, 2016, p. 555-575.
-
Ratcliffe C. P. A frequency and curvature based experimental method for locating damage in structures. Journal of Vibration and Acoustics-Transactions of the ASME, Vol. 122, 2000, p. 324-329.
-
Yoon M. K., Heider D., Jr Gillespie J. M., Ratcliffe C. P., Crane R. M. Local damage detection with the global fitting method using operating deflection shape data. Journal of Nondestructive Evaluation, Vol. 29, 2010, p. 25-37.
-
Pandey A. K., Biswas M., Samman M. M. Damage detection from changes in curvature mode shapes. Journal of Sound and Vibration, Vol. 145, Issue 2, 1991, p. 321-332.
-
Mallat S. A Wavelet Tour of Signal Processing. Academic Press, 2008.
-
Wang Q., Deng X. M. Damage detection with spatial wavelets. International Journal of Solids and Structures, Vol. 23, Issue 36, 1999, p. 3443-3468.
Cited by
About this article

The authors are grateful for the partial support provided by the Natural Science Foundation of China (No. 51508156) and the Qing Lan Project of Jiangsu Province (No. 2014035).
W. Xu and M.S. Cao conceived the concept; X.M. Li and E. Manoach designed the algorithm; H. Xu conducted the experiment and analyzed the data; X. Zhu and M.S. Cao wrote the paper.
