Abstract
The paper presents the possibilities of diagnosing with the use of vibracoustic signal of mechanical damages of diesel engines, which are not detected by the OBD system. This system does not recognize such damages, but it masks them delaying information about the damage to the point where the regulatory values of controlling work of the engine will exceed the limit values. This is because the aim of the OBD system is to ensure the minimization of exhaust emissions. There were made measurements of vibroacoustic signal of the head of the car engine with fuel injection system Common Rail, where there were introduced mechanical failures typical and dangerous for the engine. It has been proved that the OBD system does not recognize these damages and the work of the engine is correct. Therefore, there is a need for an additional diagnostic system which supports the OBD system in detection of this type of damages. It seems that the use of vibroacoustic signal as an additional analyzed signal should improve the sensitivity of the on-board diagnostic system to damages of diesel engine. The author tested the sensitivity of vibroacoustic signal to damages introduced to the engine and he presented the proposition of the system based on simple measures of the vibroacoustic signal, which allows for both detecting mechanical damages and their identification.
1. Introduction
Diesel engines are basically the only type of engine used in vehicles. These are the basic features which decided about: low fuel consumption, small increase in combustion at high loads and long service life. The introduction of electronic control systems of engine work operation of the engine resulted in the fact that the simplicity of this engine is no longer so obvious because high pressure injection systems (Common Rail) controlled electronically or diesel particulate filter are the factors which seriously increase the purchase cost. It is the result of engineers work all over the world who look for new constructional solutions which allow to fulfill strict norms concerning toxicity of exhaust fumes. Another important problem is the fact that the use of electronics to control the engine work improves the access to information about the parameters of controlling. However, it does not necessarily facilitate the diagnosis of engine work and detection of its damages. There is a certain group of damages, mainly mechanical ones, which is not detected in the early stages of development. At the same time, information about the damage is masked by the OBD system [1, 2]. This is because the priority aim of the OBD system is to reduce the toxicity of exhaust fumes. The system adjusts injector opening time so as to get the fuel mixture close to stoichiometric, which results in masking the damage. As long as the operating parameters do not exceed the limit values, the diagnostic system OBD will assess the condition of the engine as good. An example of such a damage is a group of mechanical damages of the engine which influence the reduction of compression pressure such as burn of the valve or damage of the head sill. If these damages are not detected, it may lead to a serious accident and unexpected exclusion of an object from the operation. It may even lead to complete engine destruction. Therefore, there is a need for an additional diagnostic system which supports the OBD system in detection of this type of damages. It seems that, just as in the SI engines, additional analysis of vibroacoustic signal should improve the sensitivity of the on-board diagnostic system to mechanical damages of diesel engine [1, 3-10].
2. Control systems of diesel engines
Injection systems have undergone tremendous evolution since the introduction of the first injection pumps, starting with simple injection systems with sequential injection pumps controlled mechanically, unit injectors, ending with high-pressure Common Rail systems [11].
To meet strict requirements of minimization of exhaust fumes toxicity, there was increased the injection pressure up to approx. 200-250 MPa.
The increase in pressure in the systems with unit injectors was carried out by placing the system increasing the pressure of injection and the injector dosing the fuel in a common housing and in the case of a Common Rail system by using one high-pressure accumulator, which supplies all the injectors. Such a solution as Common Rail allows to maintain the condition of constant pressure when all cylinders are supplied (Fig. 1). In addition, the injection of fuel into the accumulator does not take place during the injection, but between consecutive injections of fuel into the cylinders, thereby the pressure drop is minimized during the fuel injection.
Fig. 1The scheme of supplying the diesel engine with common rail [11]
![The scheme of supplying the diesel engine with common rail [11]](https://static-01.extrica.com/articles/18075/18075-img1.jpg)
Injectors in the Common Rail system are independently controlled so the parameters of injection can be adjusted for each cylinder separately depending on the current working conditions of the engine.
An electronic control system analyzes a lot of signals like rotational speed of the engine, position of the crankshaft and the camshaft, the position of the accelerator pedal, the temperature of inlet air, the temperature of coolant etc., so as to optimize the quantity of fuel because of the minimization of exhaust emissions. For each type of the engine there is constructed so called injection map including dependency of injection parameters of the conditions of engine work. The system analyzing these conditions reads parameter values for given work conditions from map injection sensor and realizes them.
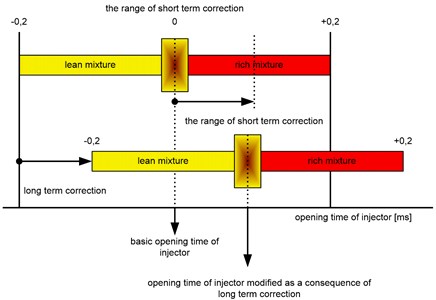
Regardless of the detailed construction of a particular solution of the system of injection diesel engine, the control system, despite the analysis of so many input parameters can only change two output parameters: starting time of injection and the injectors opening time.
The changes (corrections) of these two parameters are called respectively a long-term correction of the fuel dosage (long term fuel trim) and short-term correction of the fuel dosage (short term fuel trim) (Fig. 2) [11-12].
As a result of the introduction of these corrections, the map of opening times changes. If corrections are small and do not result in exceeding the limit values of other measured parameters, the user will not be informed about that. Only when the values are exceeded, MIL will illuminate. Then, a diagnostician will search for a failure because the system itself cannot identify it.
Fig. 2Controlling the opening of the injector by the OBD system
3. The engine as a generator of vibroacoustic signal
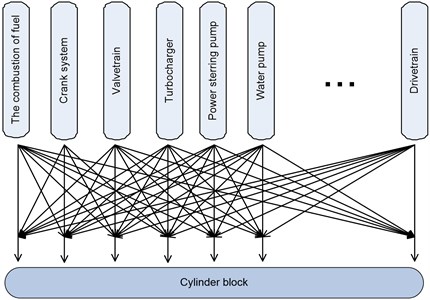
Vibrations of the housing of combustion engine are not only the effect of processes occurring inside e.g. movement of elements of the piston-combustion system or combustion processes of fuel-air mixture in combustion chamber but also the processes occurring outside the housing generated by the powertrain components and accessories. Each of these systems requires additional impacts influencing the vibroactivity of the housing not only directly but also indirectly by the mutual interaction between the individual elements.
While analyzing the vibration signal of the engine housing the mutual non-linear relationships between the frequency response functions of particular elementary excitations cannot be omitted (Fig. 3) [13-15].
It is also important to take into account the frequency response function between the place of generating extortions and a measuring point of vibrations of the body. Knowledge of these relationships allows to detect disturbances of the signal which is the result of the emergence and development of damage of any of the components of the engine. It also allows for its proper identification.
Fig. 3A simplified schematic diagram of interpenetration of vibration signals generated by the elements and engine components on the way from their origin to the point of measurement on the motor housing
Engine systems work in a specific order. Different cycle phases of work are strictly ordered. Therefore, if the starting point is determined (marker in the signal which will be a point of reference), it is possible to assign the observed change of the signal (impulse) to the specified part of the cycle and to the specified kinematic pair (Fig. 4).
Fig. 4An example course of one working cycle of a single-cylinder combustion engine [2]
![An example course of one working cycle of a single-cylinder combustion engine [2]](https://static-01.extrica.com/articles/18075/18075-img4.jpg)
In the case of a new engine, the observed emitted signal can be written with a good approximation as a sum of harmonic dominants and impulse elements:
where:
, – amplitudes of the signal components;
– frequencies of vibrations of components;
– impulse function;
– time specifying the occurrence of the impulse phenomenon;
– phases of signal components;
– random noise (total noise).
As time goes by, as a result of degradation of elements of each of these systems, there appear stronger disturbances of their work, which results in reduction in the dominance of harmonic components of frequencies extortion and increase in the randomness of the vibroacoustic signal. This is consistent with the fundamental premise of the analysis of the vibroacoustic signals which says that the development of damage is manifested in increased energy dissipation [7, 13-15].
It does not, however, mean that the primary result of increasing damage is the increase in the amplitudes of vibrations and noise of the engine, therefore, the general increase in the level of vibroacoustic signal. There is a group of damages which does not give such an effect and even contrary, results in its reduction. However, it cannot be claimed that in these cases the vibroacoustic signal is insensitive to these damages, the information about the growing damage should be sought in the change of the structure of the vibroacoustic signal [2, 17-21].
4. Diagnostic experiment
The sensitivity analysis of the vibroacoustic signal was carried out based on the results of extensive multidimensional diagnostic experiment with the use of a vehicle with a diesel engine conducted by the author [22].
This experiment was based on the measurement of the vibroacoustic signal of the engine housing in a good condition and with mechanical damages introduced for experiment needs. The object of the research was Ford Mondeo with a diesel engine with a capacity of 2.0 liters equipped with Common Rail system of injection.
There were introduced mechanical simulating damages to the object in the diagnostic experiment:
burning of the exhaust valve in an initial state;
burning of the exhaust valve in an advanced state;
damage of the seal under the head;
damage of the injector.
The introduced damages were done in such a way that their shape was consistent with previous work [2, 22, 24-26] i.e. so as to correspond to actual operation in the geometric sense and to the effect in the form of decrease in compression pressure in the cylinder. Damaged elements are presented in Figure 5.
Fig. 5The view of damaged parts

The effect of damages was to reduce the compression pressure in the first cylinder (Table 1). Despite a decrease in pressure, the OBD system did not recognize the introduced defects, which means that none of the parameters analyzed by the system did not reach the limit values. Therefore, the effect was limited only to the modification of the control parameters, so as to prevent excessive exhaust emissions. It should be noted that throughout the duration of the experiment, both the OBD system and engine control system were operational.
Table 1The pressure in the first cylinder for different states of damage
Undamaged engine | Small valve damage | Major valve damage | Damage of the seal under the head |
3 [MPa] | 2,75 [MPa] | 2,5 [MPa] | 2,8 [MPa] |
Measurements were carried out at constant rotational speeds of the engine at the 2nd, 3rd and 4th gear with several fixed values of these speeds.
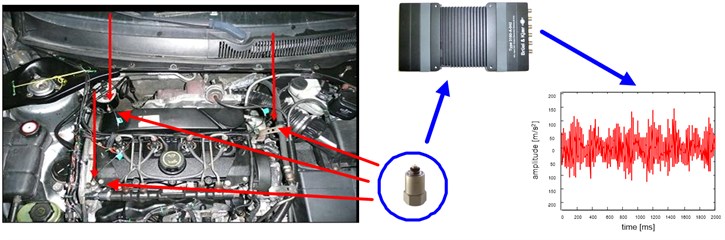
There were measured vibration accelerations in three directions, at two points in the engine head (over the 1st and the 4th cylinder) and at one point of the gearbox housing. Additionally, there was recorded the signal from the sensor of the position of the camshaft. The scheme of measuring system and the places of mounting the sensors is presented in Fig. 6.
In this work, the analysis was based on the signal recorded by the sensor on the head closest to the place of damage (over the 1st cylinder). However, as it was shown in the previous works in vibroacoustic Laboratory of Warsaw University of Technology, the sensor can be placed over any cylinder without the loss of information about the developing damage.
Fig. 6Distribution of sensors of acceleration of the head vibrations with the scheme of the measuring system
There were recorded time signals of amplitudes of the vibration acceleration with the length 30 s and 60 s with a sampling frequency of 65536 Hz. Results with the length of 1 s, 5 s and 10 s were subjected to the analysis both in time and frequency domain. It resulted in frequency resolution of 1 Hz, 0,2 Hz and 0,1 Hz. The recorded signals were resampled and averaged.
The need of resampling results from both the difficulty of keeping the constant rotational speed of the engine while measuring and from the uneven work of the engine.
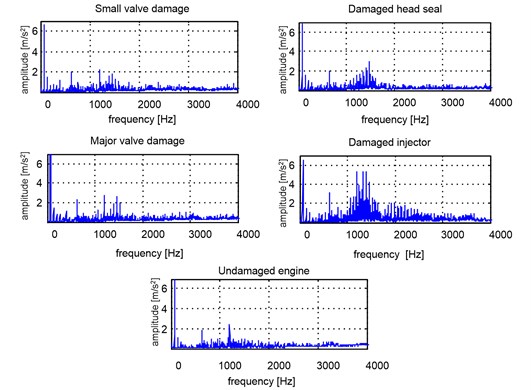
The signals of the length 1s were chosen from 10 second resampled time signals. After that, they were averaged. Fig. 7 illustrates an exemplary one-sided power spectrum of the whole signal for all types of damages for the fourth gear and for the rotational speed of the engine shaft which equals 2000 rpm/ min.
Fig. 7Averaged amplitude spectra of vibration acceleration of the head for different operating states, 4th gear, 2000 RPM
For such processed signals, there were calculated basic measures for time signal and its envelope.
In comparison to the instantaneous signal the analysis of wideband measures of averaged signals did not give positive results in the form of damage identification. However, it allowed to determine the occurrence of the state of emergency, and nominate certain band of frequencies, which are sensitive to damage.
Fig. 8Filtered averaged amplitude spectra of vibration acceleration of the head for different operating states, 4th gear of 2000 RPM
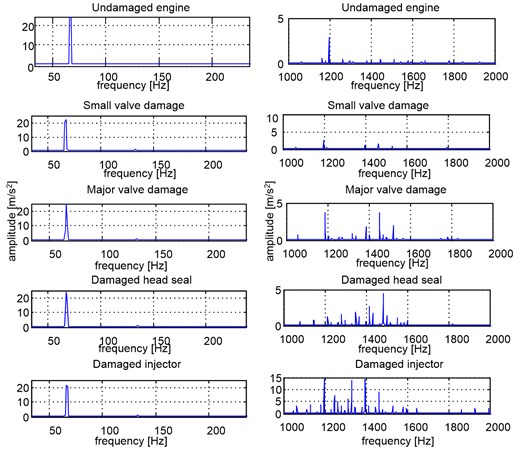
The identified damages disrupt the combustion process, and thus disrupt the rotational speed of the engine shaft. That is why, there were selected frequency bands including the first three harmonics of the ignition frequency of the engine which after filtration were subjected to further analysis. The second frequency band is the band 1000-2000 Hz, which seems to be sensitive to damage of the head seal and the injector. Fig. 8 shows one-sided power spectrum of the filtered signal in the selected bands for all types of damages for the fourth gear and the rotational speed of the engine shaft which is 2000 RPM.
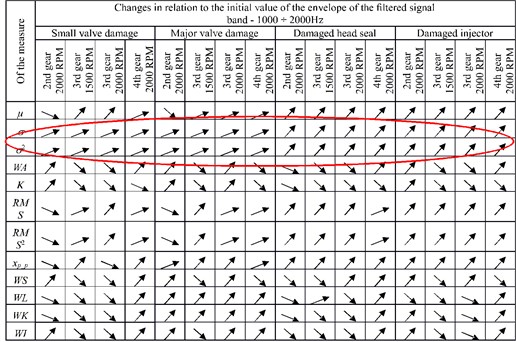
It should be noted that thanks to resampling and averaging the signal, the analysis results were improved because after filtration in the selected band signal trend of the changes of the measures calculated for the envelope, for all the gear and engine speed (except in one case, i.e. 3rd gear of 2000 RPM) had the same character. These concerns e.g. the variance and peak-to-peak value. In order to make the presentation of the results easier, the changes in measure are shown in a table filled with arrows indicating the increase or decrease of the measure value in relation to the value for the state operationally good. Fields marked with a red line include measures with a steady trend of changes, regardless of the parameters of gear and rotational speed of the engine. Fig. 9 refers to changes in the values of the measures calculated from the envelope of the averaged filtered signal in band covering 1st, 2nd and 3rd harmonic of the ignition frequency, and Fig. 10 refers to measurements calculated from the envelope of averaged filtered signal in the band of 1000-2000 Hz.
Fig. 9Relative changes in the values of measures for the frequency band covering 1st, 2nd and 3rd harmonic of ignition frequency
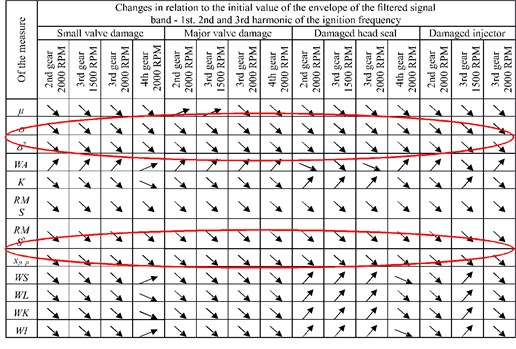
Fig. 10Changes in relation to the initial value of the envelope of the filtered signal band – 1000-2000 Hz
It can be said that the envelope of resampled averaged and filtered signal in certain frequency bands may be the basis for the decisive algorithm of support system of OBD system in detection of mechanical damages undetected by this system.
5. The proposal of diagnosing algorithm
Due to the fact that the idea of the proposed algorithm is its implementation into OBD system working while driving means that its operation should be based on calculations of simple signal measures.
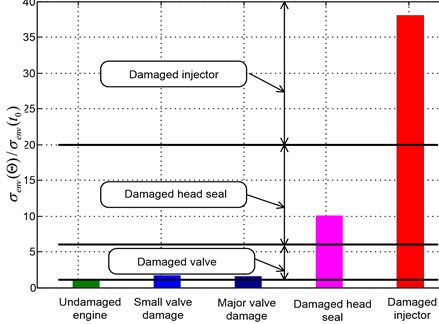
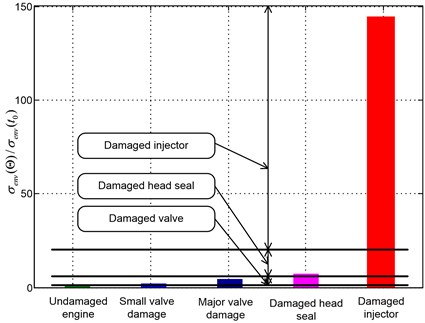
It results from the analyses of sensitivity to tested damages of simple function estimates for averaged courses of vibroacoustic signal presented in Figs. 9 and 10 that the differences between the damages are so important that on the basis of such simple measures it is possible to build a diagnostic system which will be sensitive not only to mechanical damage but it will also allow to identify the type of the damage. The analysis of variance of the envelope of sampled averaged signal allowed to determine the threshold limit of its value, so as to differentiate clearly different types of damages. The results are shown in Figs. 11-14.
Fig. 11Changing the variance of the envelope of the filtered signal in the band of 1000-2000 Hz for the 2nd gear and rotational speed of 2000 RPM
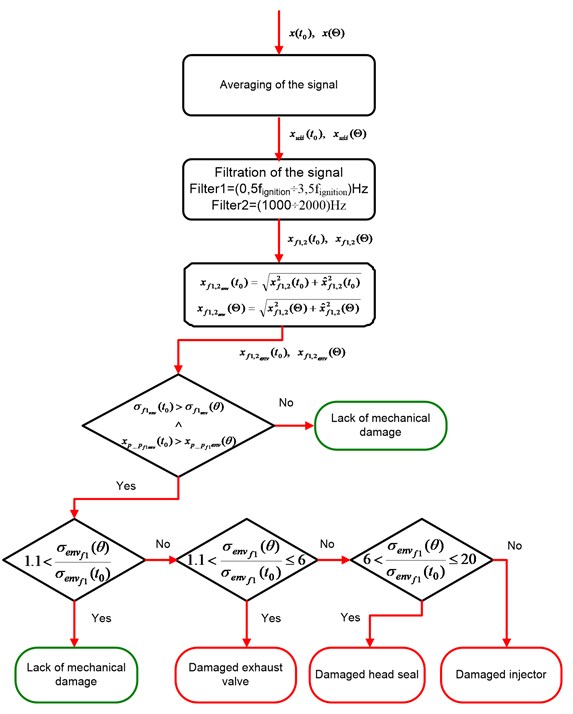
Logic diagram of such a system might look like Figure 15, where is the vibration signal of the engine housing in the state operationally good and is the vibration signal after the time of the operation .
Fig. 12Changing the variance of the envelope of the filtered signal in the band of 1000-2000Hz for the 3rd gear and a rotational speed of 1500 RPM
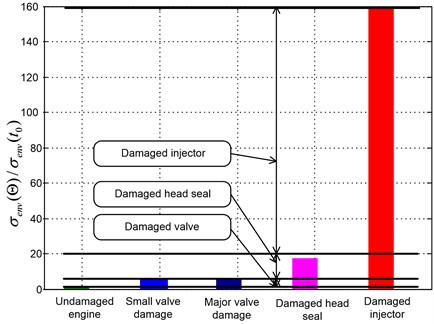
Fig. 13Changing the variance of the envelope of the filtered signal in the band of 1000-2000Hz for the 3rd gear and rotational speed of 2000 RPM
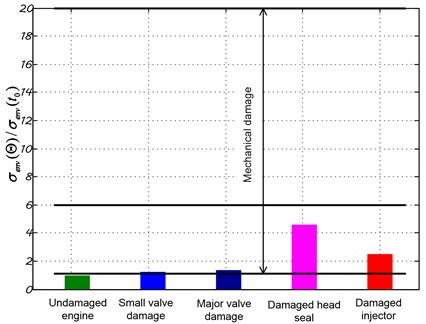
Fig. 14Changing the variance of the envelope of the filtered signal in the band of 1000-2000Hz for the 4th gear and rotational speed of 2000 RPM
As expected in any of the analyzed cases the OBD system did not recognize the introduced fault, which means that none of the parameters analyzed by the system has not reached limit values. Therefore, the system was limited only to the modification of the control parameters, so as to avoid excessive exhaust emissions.
It should be clearly stated that there can be found diagnostic measures of vibroacoustic signal, which describe mechanical damages of the diesel engine and they allow for identification of all types of analyzed damages, similarly like in the case of the spark ignition engine.
It allows for its use as a supplement to the OBD system during normal operation of the vehicle. There were used inequalities in the presented scheme:
which corresponds to the ideal case of “one hundred percent” repeatability of measurements.
In practical application, these inequalities (2) should be replaced with inequalities:
in which values and should be assumed in each case on the basis of numerous attempts of value not smaller than 3 distribution.
Although operation of such a system was not examined in the conditions of damages of control system, it may be assumed that it is effective for all research because the damage of control system will be detected anyway. The vibration symptoms are practically independent of this system.
Other solutions proposed in the literature do not meet this assumption, assuming complex measures using signals from the control system e.g. from the sensor of rotational speed of the shaft, or registration of the beginning of the injection) [2, 7, 9, 26].
Thus, it can be clearly stated that for the tested objects despite the “masking”, studied mechanical damages are distinguishable and legible with the use of relatively simple measures and the use of a simple algorithm so that the diagnosing mode “on-line” is possible.
Fig. 15Logic diagram of the proposed system of diagnosing mechanical failures
6. Conclusions
Presented considerations indicate that it is possible to find the symptoms of vibroacoustic signal and to propose the measures allowing for detecting mechanical damages which are not detectable by OBD system and identification of these damages. Secondly, they show that it is possible to make an attempt to develop concluding algorithm which will allow to detect these damages “on-line”. It is supposed to be the basis of the system supporting the diagnostic OBD system for vehicles with diesel engines in detecting this type of damages.
This means that the essence of the algorithm is that its action uses simple measures calculated with methods which are not time consuming and not requiring large operational memory and specialized software.
It should be emphasized that the research was difficult because the test vehicle has been driven over 250 000 km, which means that wear processes in the engine were already at an advanced stage and introduced damages caused reduction in pressure in a cylinder about similar amount, i.e. approx. 2,5 MPa. All this resulted in the fact that it was very difficult to “extract” the information about the growing damage from such a disturbed signal.
To sum up, it should be stated that despite the difficulties, there was developed a method of processing the vibroacoustic signal recorded on the engine head, which allowed to find measures sensitive to mechanical damages and propose an efficient concluding algorithm.
The proposed algorithm has been tested on a vehicle in an advanced operating state and damages with low and high levels of development. Thus, it can be concluded that if the diagnostician had access to a reference signal recorded at much lower mileage, detection of mechanical damages would be much easier.
It should be emphasized that despite the advanced degree of damages in any of the analyzed cases, the OBD system did not recognize the damages introduced as a state of emergency and further operation of the vehicle in this state was at the risk of emergency engine stop, damage and even destruction of the engine! It means that using the system analyzing the vibroacoustic signal, supporting the OBD system in the detection of mechanical damages of the engine is by all means appropriate in the safe operation of vehicles with diesel engines.
References
-
Dąbrowski Z., Zawisza M. Investigations of vibroacoustic signals sensitivity to mechanical defects not recognised by the OBD system in diesel engines. Mechatronic Systems, Mechanics and Materials. Solid State Phenomena, Vol. 180, 2012, p. 194-199.
-
Madej H. Diagnosing the Mechanical Damages in Combustion Engines Masked by Electronic Control Devices. Publishing House ITE, Radom, 2009, (in Polish).
-
Dąbrowski Z., Górnicka D. An attempt to diagnose damages to exhaust valve of the engine with spark ignition with vibroacoustic methods. 15th Nationwide Scientific Symposium on Automotive Problems of Environment Protection, Warsaw, 2008, (in Polish).
-
Deuszkiewicz P., Górnicka D. Rice Frequency as a Measure of Damage to the Combustion Engine Valve. Przegląd Mechaniczny, No. 4, 2009, (in Polish).
-
Dąbrowski Z., Madej H. Masking mechanical damages by modern systems of combustion engines control. Journal of KONES, 2006, (in Polish).
-
Dąbrowski Z., Zawisza M. Diagnostics of mechanical defects not recognized by the OBD system in self-ignition engines. Combustion Engines, Vol. 3, Issue 2011, 146, p. 99.
-
Komorska I. Vibroacoustic Diagnostic Model of the Vehicle Driver System. Scientific Publishing Institute for Sustainable Technologies, Radom, 2011.
-
Mlynczak J. Algorithm determining the setting force at point machines. 14th Transport Systems Telematics Conference (TST), Telematics – Support for Transport, Book Series on Communications in Computer and Information Science, Vol. 471, 2014, p. 321-330.
-
Burdzik R., Konieczny L., Stanik Z., et al. Analysis of impact of chosen parameters on the wear of camshaft. Archives of Metallurgy and Materials, Vol. 59, Issue 3, 2014, p. 957-963.
-
Burdzik R. Implementation of multidimensional identification of signal characteristics in the analysis of vibration properties of an automotive vehicle’s floor panel. Eksploatacja i niezawodność – Maintenance and Reliability, Vol. 16, Issue 3, 2014, p. 458-464.
-
Łazarz B., Madej H., Pieruń G., Stanik Z. Diagnosing damages of combustion engines valves on the basis of vibration analysis. 4th International Congress of Technical Diagnostics, Olsztyn, 2008, (in Polish).
-
Madej H., Bednarowski J. Detecting vibration sources in machines with the cepstrum analysis method. Vibroacoustics, Vol. 3, 1976, p. 34-42, (in Polish).
-
Madej H., Czech P. Attempt to utilize histogram of vibration cepstrum of engine body for setting up the clearance model of the piston-cylinder assembly for PNN neural classifier. Journal of KONES, Powertrain and Transport, Vol. 15, Issue 3, 2008.
-
Merkisz J., Mazurek S. On-board diagnostic systems of cars. Transport and Communication Publishers, Warsaw, 2007, (in Polish).
-
Rokosch U. Fumes cleaning systems and on-board diagnostic systems of OBD cars. Transport and Communication Publishers, Warsaw, 2007.
-
Batko W., Dąbrowski Z., Engel Z., Kiciński J., Weyna S. Modern methods of examining vibroacoustic processes. Scientific Publishing Institute for Sustainable Technologies, Radom, 2005, (in Polish).
-
Cempel Cz. Vibroacoustic Diagnostics of Machines. PWN, Warsaw, 1989, (in Polish).
-
Żółtowski B., Cempel Cz. Engineering of Machines Diagnostics. Publisher of Institute for Sustainable Technologies, Radom, 2004.
-
Batko W., Dąbrowski Z., Kiciński J. Nonlinear Effects in Technical Diagnostics. Publishing and Printing House of the Institute for Sustainable Technologies – NRI, Poland, 2008.
-
Charchalis A. Diagnosing engine room and specialized equipment operated on Polish naval army ships. 2nd International Congress of Technical Diagnostics, Diagnostics, 2000, (in Polish).
-
Gardulski J., Wilk A. An attempt to use vibroacoustic signal to assess the combustion process. 4th Symposium – Szczyrk, 1978 (in Polish)
-
Grządziela A. The possibility to diagnose selected elements of ship engine room offline. 9th Congress of Technical Devices Operation, Krynica, 2001, (in Polish).
-
Niziński S. Vibroacoustics in Diagnosing Combustion Engines. Collective Work, Vehicle Diagnostics, Ossolineum, 1981, (in Polish).
-
Zawisza M. Vibroacoustic symptoms as a complement of OBD system of diesel engines. Scientific Publishing Institute for Sustainable Technologies – PIB, Radom, 2015, (in Polish).
-
Górnicka D. Examining vibroacoustic sensitivity of symptoms of combustion engines. Scientific Journal of Polish Naval Academy, Vol. 1, Issue 184, 2011, (in Polish).
-
Górnicka D. Vibroacoustic diagostics of mechanical damages of piston combustion engines. Scientific Journal of Polish Naval Academy, 2017, (in Press), (in Polish).
-
Górnicka D., Zawisza M., Stanik Z. Vibroacoustic signal as a symptom of mechanical damages to diesel engine completing OBD system. 15th Scientific Conference of Vibroacoustics and Vibrotechnique, 10th Nationwide Seminar Vibroacoustics in Technical Systems Vibrotech, Sękocin Stary, 2010, (in Polish).
-
Komorska I., Górnicka D. Adaptation of engine vibration characteristics for diagnostics of mechanical defects. Combustion Engines, Vol. 3, Issue 146, 2011.
Cited by
About this article

