Abstract
Damage detection at an early stage is of great importance especially for infrastructures since the cost of repair is considerably less than that of reconstruction. The change in stiffness and frequency could obviously indicate the occurrence of damage and its severity. Wavelet transform is a powerful mathematical tool for signal processing which provides more details compared to Fourier transform. In this paper, a model-free output-only wavelet-based damage detection analysis has been performed in order to achieve perturbation of detailed function of acceleration response in bridge piers. First, a nonlinear time-history finite element analysis was performed using 9 consequent earthquake records; from which, time-history acceleration response was derived. Also pushover and hysteresis curves were drawn based on the results. Furthermore, applying wavelet transform to structural response, some irregularities appeared in decomposed detailed function which imply on damage presence in the models. Finally, peak values of details could lead us to time instants of damage.
1. Introduction
It has been estimated that about 2.5 million bridges are operated by global transportation network all over the world. Bridges would be frequently rated by management system using various techniques. According to the US Federal Highway Agency (FHWA), about 30 % of bridges have been categorized to be deficient in their present forms. Regarding the case, focusing on bridges is an inevitable issue which requires structural health monitoring, diagnosis and improvement. Damage is often defined as changes to the material and/or geometric properties of structural elements, including changes to the boundary conditions and system integration which influences on the current or future performance of such members. Structural Health Monitoring (SHM) which is a damage assessment strategy should be utilized as a preventive tool before bridges become deficient. Damage detection and identification has several methods which are categorized based on the type of measured data and also the technique of damage identification from the measured data.
In 2006, Zha and Law proposed a new method of crack identification for bridge beams subject to a moving load using wavelet analysis. In their study, dynamic behavior of the cracked beam was analyzed using mode superposition. Their work was validated by both simulation and experiment [1]. Hou et al. (2006) introduced a wavelet-based technique to extract the instantaneous modal parameters to obtain the health condition of a three-story shear building [2]. Pakrashi et al. (2007) suggested a new method based on wavelet-kurtosis for damage detection in different crack depth ratios and crack positions having various signal to noise ratios [3]. Gökdağ and Kompaz (2009) also proposed a new wavelet-based method for damage detection of beam-type structures by combining both continuous and discrete wavelet transforms. Their method was based on the assumption that a damaged mode shape could be composed of an undamaged mode and local damage-induced variations [4]. Bagheri et al. (2009) presented a new technique for vibration-based damage identification of plate structures via curvlet transform. They applied their method into a four-fixed supported rectangular plate containing one or two damages with arbitrary length, depth and location [5].
Beskhyroun et al. (2010) also proposed a new technique based on wavelet transform for structural damage detection. Their method was verified both experimentally and numerically using a railway bridge [6]. Todorovska and Trifunac (2010) used experimental data derived from a six-story building during the 1979 Imperial Valley ground motion. They found that the irregularities detected in the wavelet details correlate well with the observed damage. However, they could not assess the level of damage [7]. In 2011, Bagheri et al. proposed a new method for detection of linear flaws in plate structures by 2D discrete wavelet transform [8].
Loh et al. (2011) used dynamic shake table data from a typical RC column test to explore the efficiency of different damage detection methods including signal processing-based and model-based approaches in which the damage induced in the column remained on the serviceability limit [9]. In 2013, Miyamoto introduced a newly proposed state representation methodology (SRM) and its application to bridges using monitoring data. He developed a frequency slice wavelet transform which successfully reveals the change in characteristics of signal [10]. Using a local excitation method, Oshima et al. (2013) investigated the damage detection of real steel bridges. The primary achievement of their project was the development of test beds that meet wider needs for structural health monitoring experiments [11]. Hamad et al. (2014) presented an RC beam model with multiple-distributed flexural cracks to investigate the degradation in vibration characteristics of cracked RC beams. Their model was subject to incremental static four-point bending, while its dynamic behavior is examined at each load increment using swept sine and harmonic excitations. The comparisons revealed that the proposed crack model is able to quantitatively predict changes in vibration characteristics of cracked reinforced concrete beams [12]. Makki Alamdari et al. (2015) proposed a new damage localization method on the basis of symbolic dynamics of time series data to detect and localize a gradually evolving deterioration in the system. The performance of their method was examined on a flexural beam and also a truss bridge subjected to varying Gaussian excitation in presence of white noise in single and multiple damage states. Simulation results under various damage conditions confirmed the efficiency of their proposed approach for localizing deteriorations in the structure [13].
The present study aims to utilize a model-free output-only wavelet-based damage detection method in which only accelerations (obtained from analyzes) have been used. The procedure includes two analysis types which were applied to the response signals as: 1) Fourier transform to extract the vibration frequency of structure in all stages of loading protocol and 2) Discrete wavelet transform to detect perturbation in decomposed detailed function of acceleration response.
2. FEM modeling and nonlinear time-history analysis
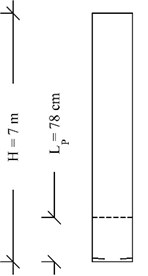
A circular reinforced concrete bridge column was considered as the structural member on which finite element modeling and time-history analysis were performed. Fig. 1 presents a schematic view of bridge column section and elevation. The circular column diameter was selected to be 1.2 m with a cantilever length of 7 m. Also a 250 ton lumped mass as the representative of bridge deck was simulated. The reinforcement of column includes 35Φ25 bars (Reinforcement ratio = 1.52 %). Furthermore, in order to have suitable confinement and prevent buckling, sufficient transverse reinforcement was provided as well.
Finite element modeling was developed in OpenSees 2.44 [14]. Nonlinear beam – column element having two potential plastic hinges in both ends was selected from element library (Fig. 1).
In this element, the plastic hinge length would be calculated using Eq. (1) [15]:
In which , , and are diameter of longitudinal rebars, element length, yielding stress and ultimate rupture strength of steel respectively. Considered values of the above parameters to be used in modeling are summarized in Table 1.
Fig. 1Details of structural model
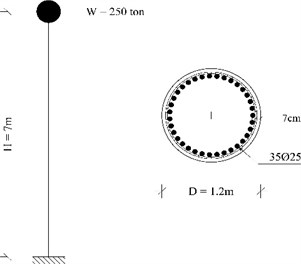
Table 1Materials properties
Reinforcement | Concrete | ||
400 MPa | 40 MPa | ||
600 MPa | 34.5 MPa | ||
200000 MPa | 22480 MPa | ||
Fig. 2Beam with hinges element (adopted from [14])
![Beam with hinges element (adopted from [14])](https://static-01.extrica.com/articles/16474/16474-img2.jpg)
Substituting the values of Table 1 in Eq. (1), one can obtain the plastic hinge length to be 78 cm. In order to define the plasticity in plastic hinges, fiber section method was selected.
A fiber section has a general geometric configuration formed by sub-regions of simpler, regular shapes (e.g. quadrilateral, circular and triangular regions) called patches. In addition, layers of reinforcement bars can be specified. The subcommands patch and layer are used to define the discretization of the section into fibers. Individual fibers, however, can also be defined using the fiber command (During generation, the Fiber objects are associated with uniaxial Material objects), which enforce Bernoulli beam assumptions [14]. The uniaxial material consists of Concrete01 based on Mander et al. (1988) [16] and Reinforcing Steel adopted from [17]. Strength and stiffness degradation of steel in cyclic loads are considered based on Coffin and Manson fatigue. Considering second-order P-Delta effects, coordinate transformation would be done which performs a linear geometric transformation of element stiffness and resisting force from the local to global system.
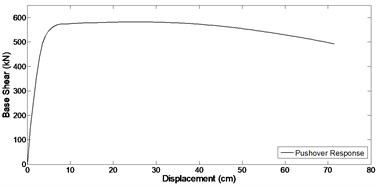
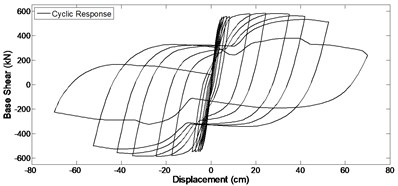
Fig. 3a) Pushover response and b) cyclic response, of the bridge column
a)
b)
In order to assign damping to all defined elements and nodes, a damping matrix is specified as a combination of stiffness and mass-proportional damping matrices. Damping ratio equal to 5 percent was assumed for the models. Fig. 3 shows pushover and cyclic response of the bridge column.
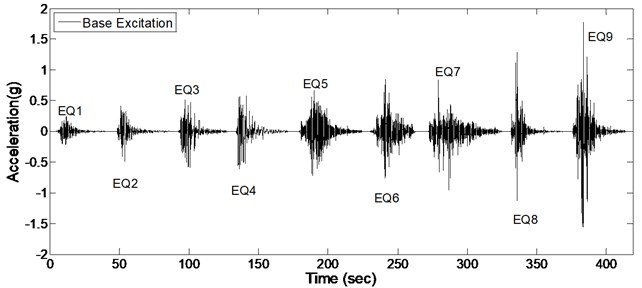
Performing nonlinear time-history analysis, 9 consequent records starting from low values of PGA with gradual increase up to the last one were applied to the models in order to simulate whole up to collapse procedure. In order to remain the dynamic characteristics of structure after finishing records and to have distinct frequency component and dynamic characteristics of each single record, a white noise with low amplitude was applied before and after all records. It is worth to mention that structural damage due to each record would be considered at the starting point of next earthquake. Table 2 presents details of the considered ground motion and Fig. 4 shows consequently of input records having white noises through them.
Table 2Ground motions: general information
EQ | Earthquake name | Date | Station | PGA (g) | Magnitude |
EQ1 | Loma Prieta | 10/18/1989 | Anderson Dam | 0.244 | 6.93 |
EQ2 | Northridge | 01/17/1994 | Converter Sta East | 0.493 | 6.69 |
EQ3 | Imperial Valley | 10/15/1979 | Bonds Corner | 0.588 | 6.53 |
EQ4 | Kobe | 01/16/1995 | Takatori | 0.616 | 6.90 |
EQ5 | Landers | 06/28/1992 | Lucerne | 0.721 | 7.28 |
EQ6 | Tabas, Iran | 09/16/1978 | Tabas | 0.852 | 7.35 |
EQ7 | Chi-Chi, Taiwan | 09/20/1999 | WNT | 0.958 | 7.62 |
EQ8 | Northridge | 01/17/1994 | Pacoima Dam | 1.285 | 6.69 |
EQ9 | Northridge | 01/17/1994 | Tarzana, Cedar Hill | 1.779 | 6.69 |
Fig. 4Consequent input ground motions
3. Damage detection using structural response
In order to detect the damage, it is required to evaluate the structural response of bridge column. Fig. 5 shows acceleration response for bridge column top subject to the mentioned consequent records (presented in Fig. 4). It should be noted that each time-history response of Fig. 5 is a specific part of global acceleration response of whole structure due to ground motions of Fig. 4.
As it could be expected from the values of Table 2, maximum acceleration of imposed ground motions increase gradually which induces an increase in maximum value of structural acceleration response. Before applying Wavelet transform to structural response, it is necessary to have an appropriate understanding of signal characteristics which results in better detection of damage; for instance, vibration frequency is one of significant characteristics which is used in this regard. By occurring the damage, stiffness would decrease and consequently the vibration frequency is affected. In this study, in order to indicate this change in frequency due to damage, Fourier spectrum of acceleration response based on applied white noises before and after each record is investigated which is shown in Fig. 6.
Fig. 5Acceleration response of structure due to 9 earthquakes
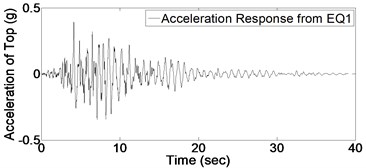
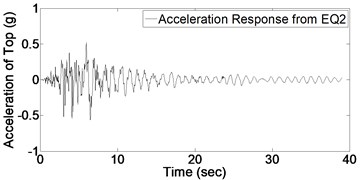
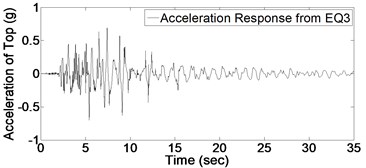
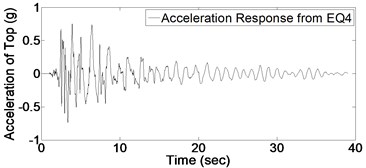
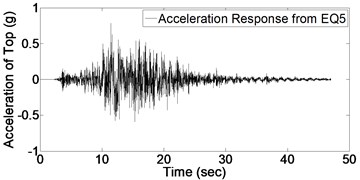
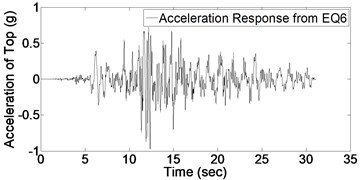
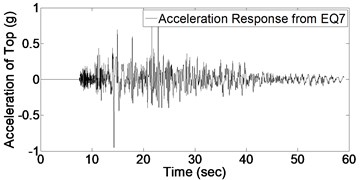
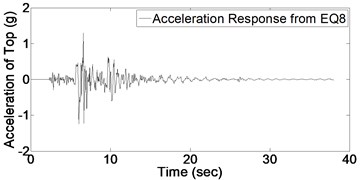
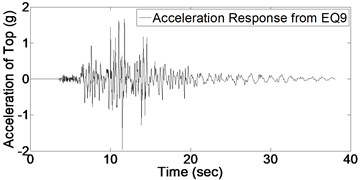
Fig. 6Fourier spectrum before first and after last earthquake
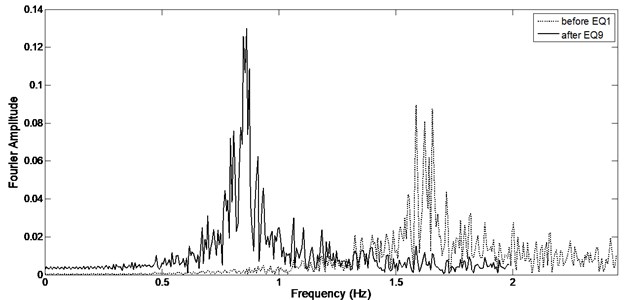
As it could be seen from Fig. 6, the vibration frequency of undamaged structure is equal to 1.65 Hz which decreases to 0.84 Hz after applying all records (in damaged column).
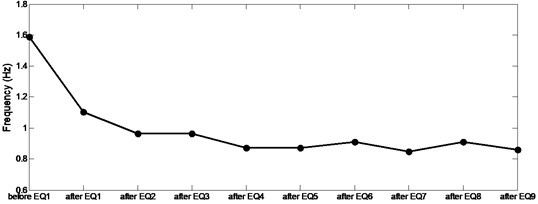
Fig. 7, shows vibration frequency history through analysis. Frequency variation in Fig. 7 implied on a considerable change cause of first four records while not having important shift due to other 5 records. It is concluded that undamaged column would considerably affected by any occurred damage which results in great decrease of stiffness but in contrast, by reaching to fifth record, earthquake energy would be dissipated due to inelastic behavior of column which reduces its influence on stiffness change and finally the damage.
Fig. 7Vibration frequency history during analysis
After processing the signal using discrete wavelet transform, a finite number of spikes would be derived from high frequency part of signal. At each time instant, the details are standardized using the following equation:
In which and are mean and standard deviation of available details respectively.
Fig. 8Standardized decomposed details of acceleration from EQ1
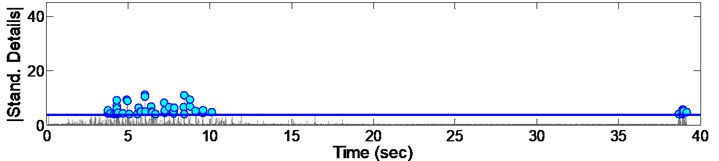
Fig. 9Standardized decomposed details of acceleration from EQ2
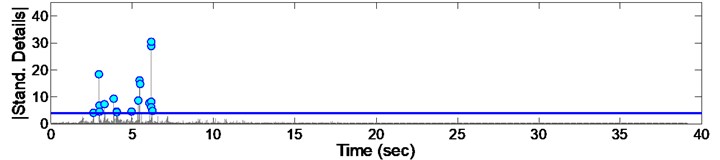
Fig. 10Standardized decomposed details of acceleration from EQ3
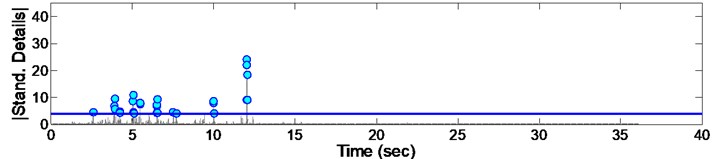
By standardizing the data, a considerable number of points with much more irregularity appeared and there for a threshold was considered to eliminate the lower points. For this, all instants with standard value lower than 4 (which is equal to details having absolute amplitude deviated more than from ) are considered as damage points. Performing the mentioned threshold to points, the confidence level would be guaranteed to be more than 95 %. Considering the above procedure, a set of results will be obtained which are presented in Figs. 8 to 16.
Fig. 11Standardized decomposed details of acceleration from EQ4
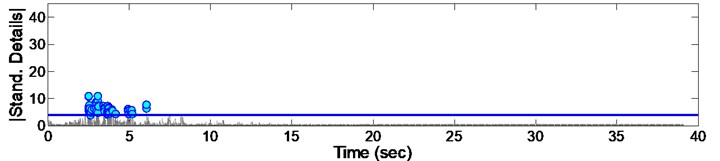
Fig. 12Standardized decomposed details of acceleration from EQ5
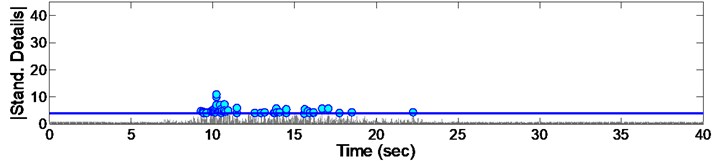
Fig. 13Standardized decomposed details of acceleration from EQ6
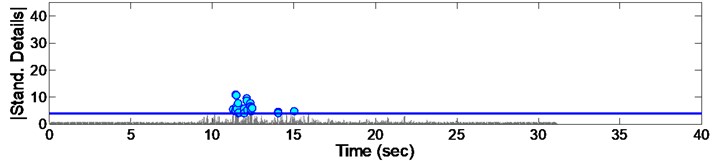
Fig. 14Standardized decomposed details of acceleration from EQ7
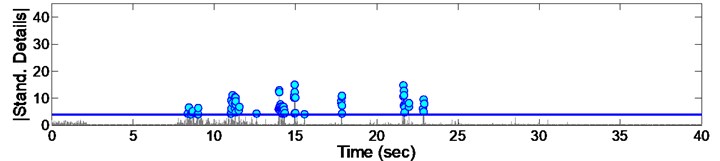
Fig. 15Standardized decomposed details of acceleration from EQ8
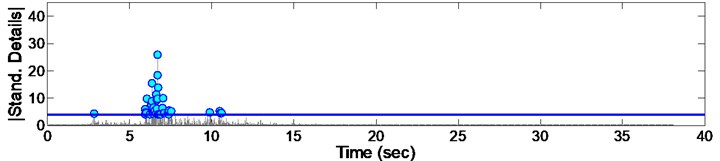
As it could be seen from the Figs. 8 to 16, some irregularities appeared which imply on damage occurrence in columns due to records. The instant of the peak value of detail, is considered as the most effective damage time. The summary of the mentioned instants due to all 9 consequent records are presented in Fig. 17. Furthermore, it could be concluded that there are different irregularities due to different records having no special sequence; so we cannot afford the damage intensity from them.
Fig. 16Standardized decomposed details of acceleration from EQ9
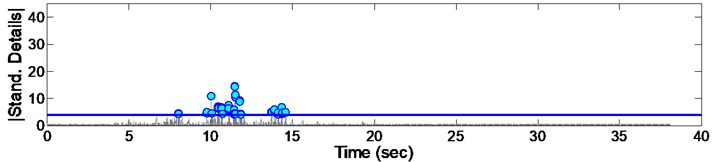
Fig. 17Time of damage in column for each record
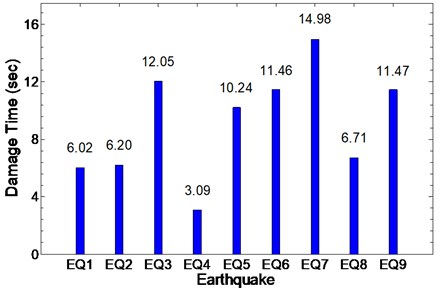
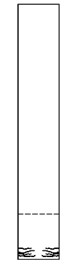
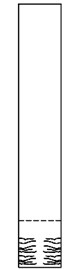
Fig. 18Schematic damage pattern and time instant after each earthquake (EQ1 to EQ9)
a) 6.02 sec, after EQ1

b) 6.02 sec, after EQ2

c) 12.05 sec, after EQ3
d) 3.09 sec, after EQ4

e) 10.24 sec, after EQ5

f) 11.46 sec, after EQ6
g) 14.98 sec, after EQ7
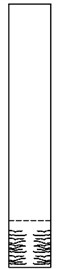
h) 6.71 sec, after EQ8
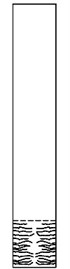
i) 11.47 sec, after EQ9
In order to have better understanding of results, the location and approximate pattern of damage (cracking) and time of main damages are shown in bridge column after each earthquake (Fig. 18).
4. Conclusions
Nonlinear time-history finite element analysis was performed on a specific bridge pier. Pushover and hysteresis responses were also derived for structural models. Utilized beam-column element had the capability of two potential plastic hinges in both ends. In order to have much more accurate results, strength and stiffness degradation were also considered. Then, 9 consequent earthquakes with gradual increase in their PGA, having low-amplitude white noises between them, were applied to the models. Two parallel results were obtained including responses from main records and white noises. A Fourier transform was applied to the white-noise responses. The corresponding results indicate that the damage would gradually increase in various levels of imposed protocol due to structural stiffness reduction; the same results could be seen in the frequency shift.
In the other hand, top column acceleration response due to main records was evaluated using wavelet transform and decomposed detailed functions were derived. After standardizing the available data, a threshold was selected by which the lower values of spikes were omitted. The remaining points are the representatives for damage episodes. The peak values of perturbation were considered as most effective time instants of damage. It is concluded that only having acceleration output of structure and applying a mathematical procedure would enable us to detect the damage even with lack of characteristics of undamaged structure. Finally, it could be concluded from the results of the present investigation that signal processing is a powerful technique for structural health monitoring of infrastructures.
References
-
Zhu X., Law S. Wavelet-based crack identification of bridge beam from operational deflection time history. International Journal of Solids and Structures, Vol. 43, Issues 7-8, 2006, p. 2299-2317.
-
Hou Z., Hera A., Shinde A. Wavelet-based structural health monitoring of earthquake excited structures. Computer-Aided Civil and Infrastructure Engineering, Vol. 21, Issue 4, 2006, p. 268-279.
-
Pakrashi V., Basu B. Structural damage detection and calibration using a wavelet-kurtosis technique. Engineering Structures, Vol. 29, Issue 9, 2007, p. 2097-2108.
-
Gökdağ H., Kopmaz O. A new damage detection approach for beam-type structures based on the combination of continuous and discrete wavelet transforms. Journal of Sound and Vibration, Vol. 324, Issues 3-5, 2009, p. 1158-1180.
-
Bagheri A., Ghodrati Amiri G., Seyed Razzaghi S. Vibration-based damage identification of plate structures via curvelet transform. Journal of Sound and Vibration, Vol. 327, Issues 3-5, 2009, p. 593-603.
-
Beskhyroun S., Oshima T., Mikami S. Wavelet-based technique for structural damage detection. Structural Control and Health Monitoring, Vol. 17, Issue 5, 2010, p. 473-494.
-
Todorovska M. I., Trifunac M. D. Earthquake damage detection in the Imperial County Services Building II: analysis of novelties via wavelets. Structural Control and Health Monitoring, Vol. 17, Issue 8, 2010, p. 895-917.
-
Bagheri A., Ghodrati Amiri G., Khorasani M., Bakhshi H. Structural damage identification of plates based on modal data using 2D discrete wavelet transform. Structural Engineering and Mechanics, Vol. 40, Issue 1, 2011, p. 13-28.
-
Loh C. H., Mao C. H., Huang J. R., Pan T. C. System identification and damage evaluation of degrading hysteresis of reinforced concrete frames. Earthquake Engineering and Structural Dynamics, Vol. 40, Issue 6, 2011, p. 623-640.
-
Miyamoto A. A new damage detection method for bridge condition assessment in structural health monitoring. Journal of Civil Structural Health Monitoring, Vol. 3, Issue 4, 2013, p. 269-284.
-
Oshima T., Miyamori Y., Mikami S., Yamazaki T., Beskhyroun S., Kopacz M. F. Small damage detection of real steel bridge by using local excitation method. Journal of Civil Structural Health Monitoring, Vol. 3, Issue 4, 2013, p. 307-315.
-
Hamad W. I., Owen J. S., Hussein M. F. M. Modelling the degradation of vibration characteristics of reinforced concrete beams due to flexural damage. Structural Control and Health Monitoring, Vol. 22, Issue 6, 2015, p. 939-967.
-
Makki Alamdari M., Samali B., Li J. Damage localization based on symbolic time series analysis. Structural Control and Health Monitoring, Vol. 22, Issue 2, 2015, p. 374-393.
-
McKenna F., Fenves G. L., Scott M. H. Open System for Earthquake Engineering Simulation – OpenSees. http://opensees.berkeley.edu, 2000.
-
Englekirk R. E. Seismic Design of Reinforced and Precast Concrete Buildings. John Wiley and Sons, Inc., Hoboken, New Jersey, 2003.
-
Mander J. B., Priestley M. J. N., Park R. Theoretical stress-strain model for confined concrete. Journal of Structural Engineering, Vol. 114, Issue 8, 1988, p. 1804-1826.
-
Mohle J., Kunnath S. Reinforcing Steel Material. http://opensees.berkeley.edu, 2006.
Cited by
About this article

